If we count only the import side and not the export side of re-exports, as some in the Administration have suggested, we might as well go “whole hog” and redefine the trade balance completely: Let’s count imports, but not exports.
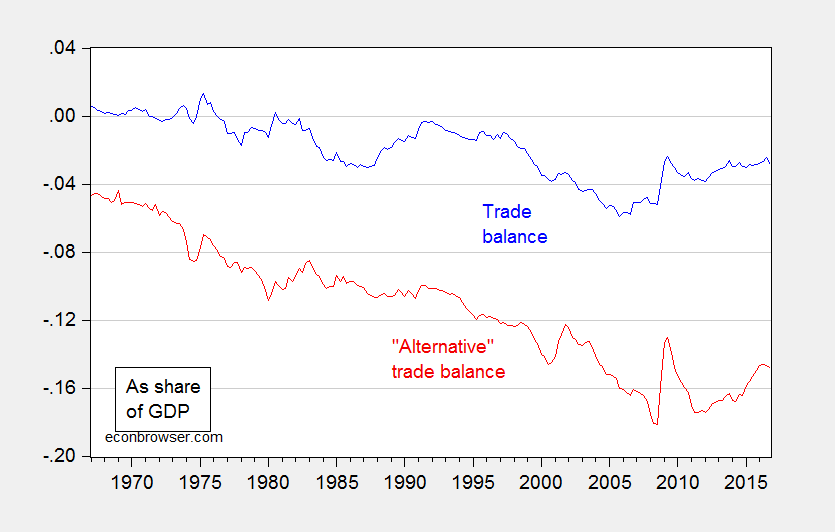
Figure 1: The trade balance defined as net exports/GDP (blue), and the trade balance excluding exports (red). Source: GDP advance release for 2016Q4, and author’s calculations.