Beware the headlines — month-on-month inflation is (again) down, even if up year-on-year. Trimmed and chained CPI price inflation are also down, while sticky price inflation was flat. Headline and core CPI did surprise on the upside though (m/m, 10 bps over Bloomberg consensus).
Category Archives: Uncategorized
Year in Review, 2021: Cleaning Up What Trump Wrought
Last year’s recap was subtitled “Hanging on for dear life (and rational policymaking)”. This year, at least we’ve ended the self-inflicted economic uncertainty (and officially sanctioned economic mendacity) of the previous four years.
China, Omicron, and US Inflation
When assessing the course of US inflation, it’s helpful to have a model; the one I use is the AD-AS model described in this post. The cost of imported inputs can be interpreted as a cost-push shock (rather than an overheated economy caused by high aggregate demand relative to low potential GDP). In this context, China — as a major supplier of inputs and commodities to the US — looms large. And hence, developments there loom large. The preliminary findings that the Chinese vaccines are not particularly effective against the omicron variant, combined with the Chinese authorities’ zero tolerance for covid infections, means that the disruptions to imports from China are likely to continue for some time.
Using Chained Quantities when Relative Prices Change a Lot
Usually, summing up chained quantities yields relatively small errors. However, when relative prices change a lot, then the differences can be large. That’s the case with relative prices of consumption since the pandemic. Hence, the sum of the components does not equal the total for consumption.
Business Cycle Indicators, End-2021
With the release of personal income and consumption, we have some of the last readings we’ll receive this year (although December’s readings will still be coming in in January). Here are some key indicators followed by the NBER BCDC.
Breakevens and Term Spreads Pre- & Post-Manchin
Manchin’s announcement that he would vote against BBB constituted a kind of event study. Here are the market indicators of expected inflation and economic activity.
Per Capita GDP Doing Just Fine, Linearly, since 1947
If you don’t believe me, take a look at this time series plot of available US GDP per capita.
On Confidence Intervals and Logs
Confidence Intervals
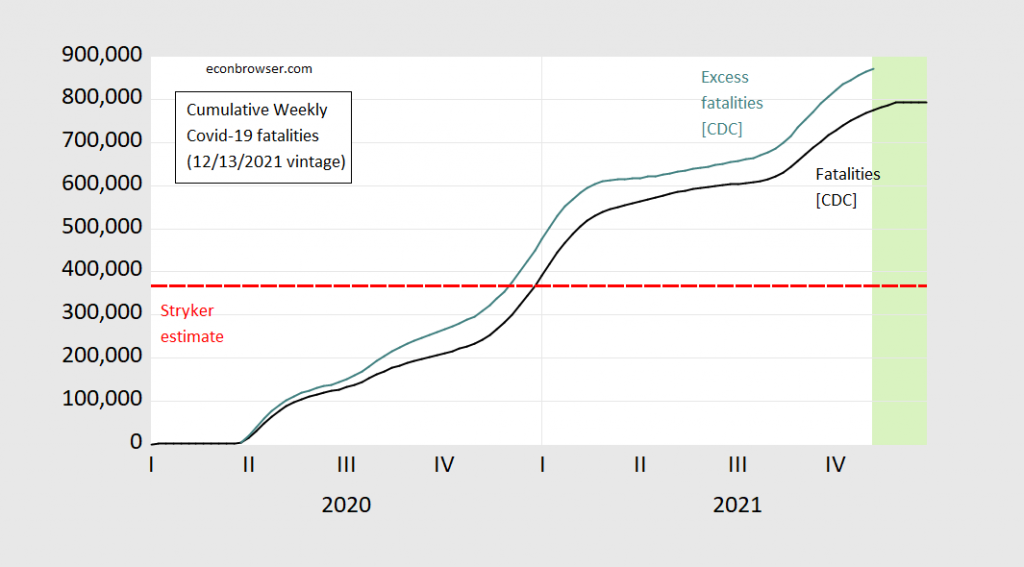
As the Nation Approaches 800,000 Covid Fatalities [updated graph]
Commenter Rick Stryker wrote confidently on August 20, 2020:
If I’m right, then we’d get a total death toll of 368K.
As of the 12/13/2021 CDC release of officially tabulated Covid-19 fatalities, cumulative fatalities through the week ending 11/27 were 793.834, somewhat exceeding 368,000.
[updated 12/16, 10:30am Pacific] Here is a graph to depict what this “forecasting miss” looks like:
Figure 0: Cumulative weekly fatalities due to Covid-19 as reported to CDC for weeks ending on indicated dates (black), cumulative excess fatalities calculated as actual minus expected (teal). Note excess fatalities equals zero for early observations where expected exceeds actual. Light green shading denotes CDC data that are likely to be revised. Source: CDC 12/13/2021 vintage, and author’s calculations.
Interests and Policy
Reader JohnH writes:
There is little discussion of the industry influence in the media, and even on Google, and certainly not among economists, who shun any discussion of power dynamics and corporate influence in the global economy like the plague.
