Category Archives: Wisconsin

Return of the Log (Function)

Ed Hanson writes, after plotting the data:

The graph shows, in general, Minnesota’s increasing gap of per capita income over Wisconsin since at least 1970. It is not just since 2011 that this trend began.

This observation is right in a way — wrong in a deeper, more economically interesting, way. Investigation highlights the usefulness of the log function.
Continue reading

Per Capita GDP in MN, WI over 30 Years

Reader Ed Hanson accuses me of misleading people about the growth rate of per capita income in Minnesota and Wisconsin, by omitting results on trends in long samples, and focussing on short samples. Personally, I don’t recall plotting per capita income, but rather per capita income (which differs from GDP), but here for the interested reader is a graph of the relevant data, for the longest span readily available.
Continue reading

Wisconsin NFP Employment Continues Decline

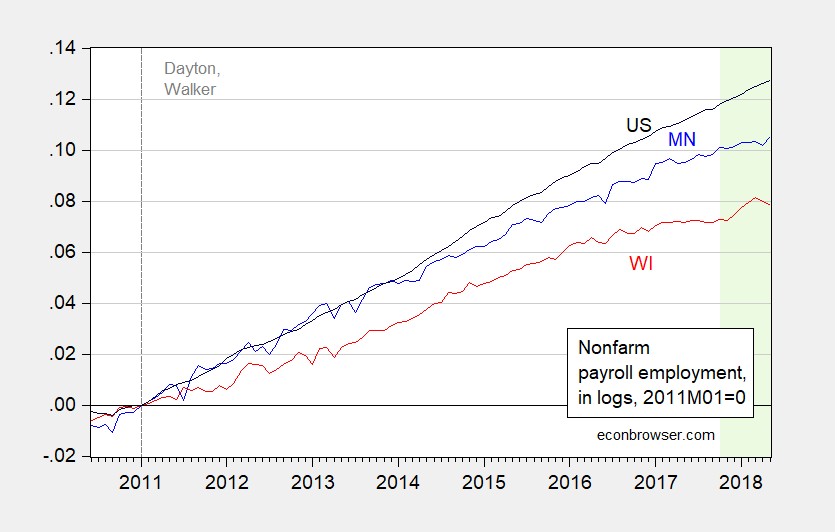
It’s below peak, and April numbers revised down.Private employment 17,500 below Governor Walker’s target of an additional 250,000 jobs by January 2015. From WI DWD today.


Figure 1: Nonfarm payroll employment in Minnesota (blue), Wisconsin (red), and US (black), all in logs normalized to 2011M01=0. Light green shaded dates indicates data not yet benchmarked using QCEW data. Source: WI DWD, MN DEED, BLS and author’s calculations.
Continue reading

A Wisconsin Fixed Effect

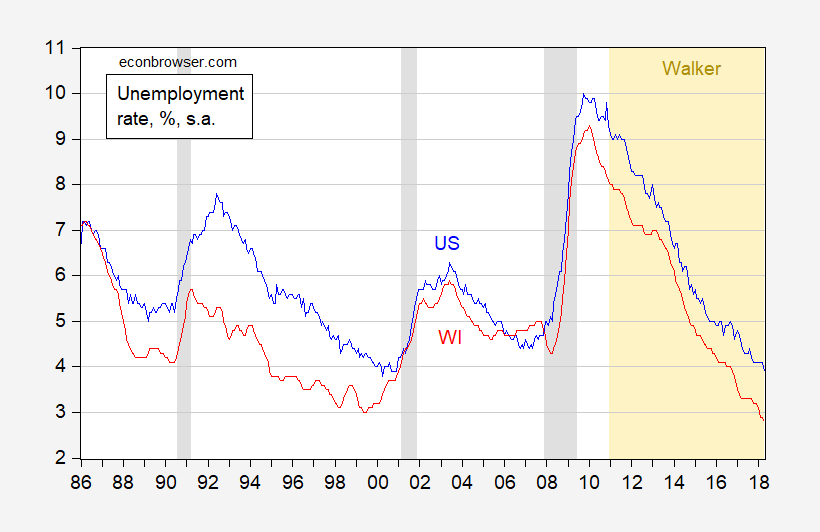
Wisconsin’s unemployment rate has dropped to 2.8 percentage points in April. The national rate is 3.9 percentage points. Proof of Walkernomics success? Well, since on average Wisconsin’s unemployment rate is typically 0.9 percentage points below, the answer is “no”. Consider the Wisconsin and US unemployment rates.


Figure 1: Unemployment rate for United States (blue), for Wisconsin (red). NBER defined recession dates shaded gray; Walker administrations shaded orange. Source: BLS, DWD, NBER.

Continue reading