Reader PeakTrader says the fortunes of Minnesota and Wisconsin “began to diverge decade before Walker”. I don’t buy it.
Category Archives: Wisconsin
Wisconsin and Its Neighbors
Still not the leader of the pack.
Wisconsin CPI-deflated Wages back to January 2011 Levels
Regarding the slowdown in employment growth in February, reader Neil asks:
To what extent could the weakness in February be a payback for the outsized growth in December and January. The three month average for nonfarm growth in Wisconsin looks solid. Also, do you have any thoughts on the average hourly earnings data? Looks like Wisconsin is seeing strong growth over the last year.
Wisconsin February Employment Wrapup: Growth at Standstill, Private NFP Still 18,800 below Gov. Walker’s 250,000 New Jobs Promise
Wisconsin nonfarm payroll employment for January revised down, flatlines for February.
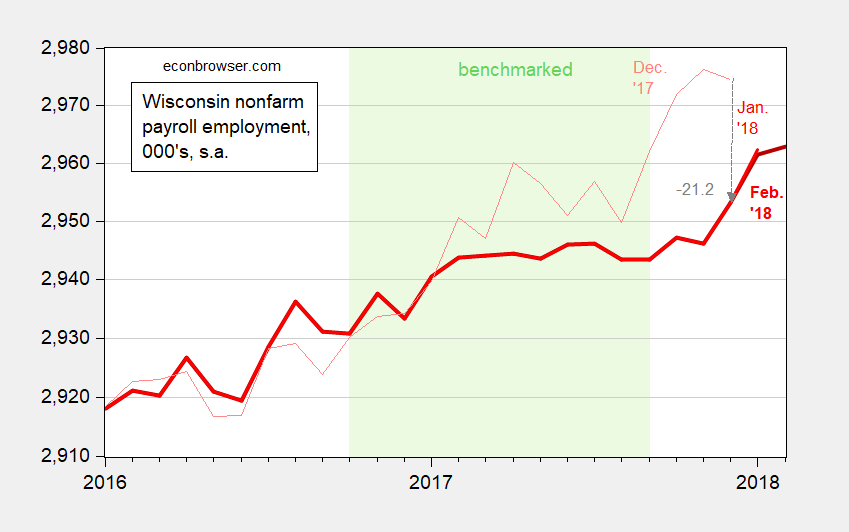
Figure 1: Wisconsin nonfarm payroll employment, February release (dark bold red), January release (red), December (pink), 000’s, s.a, on log scale. Light green shaded period denotes data benchmarked to QCEW data. Source: BLS.
Comparative Employment Growth in California and Wisconsin
Both Governors Brown and Walker are coming to the end of their second terms. Time to appraise how their respective economies have fared, in terms of employment.
Wisconsin Manufacturing Employment Boom Revised Away
New state level employment data, benchmarked through September 2017, released yesterday indicate the manufacturing employment surge reported last year has been erased, as I predicted in this post. The October-January data do not incorporate additional information from the Quarterly Census of Employment and Wages.
Wisconsin, Trade and Section 232
I was interviewed on the weekly newsmagazine Here and Now today about Mr. Trump’s tariffs on steel and aluminum:

Regarding Wisconsin, cheese was not on the Hit List, but motorcycles and cranberries were.
Austerity, What’s It Good For?
With apologies to Seinfeld. It seems like a long time ago that conservatives argued for cutting taxes and cutting spending so as to spur expansion — but the Brownback and Walker experiments in Kansas and Wisconsin are in some sense just being completed now, some five years after Governor Brownback’s “shot of adrenaline” forecast.
Wisconsin GDP since Walker
Here are GDP series for Wisconsin, as compared to Minnesota and the Nation, normalized to 2011Q1 when Governor Walker took office. I’ve indicated the implementation of the Manufacturing and Agriculture Credit, and percentages, as well.
Tax Preferences for Manufacturing and Manufacturing Value Added in Wisconsin
State level data for GDP in 2017Q3 were released yesterday. This is an opportunity to evaluate the progress of manufacturing value added (as opposed to employment) in Wisconsin after passage of the Manufacturing and Agriculture Credit (MAC).