From an article in the La Follette Policy Review:
In 2010 as the Great Recession was releasing its grip on the world’s economy, the United Kingdom’s newly elected Conservative-Liberal government embarked upon a policy of fiscal consolidation—higher taxes and drastically reduced spending—with the aim of stabilizing the ratio of government debt to gross domestic product (GDP) while spurring economic growth….
… Reducing the size of government and reducing government borrowing would free up resources to spark a strong recovery driven by the private sector. In the United States, the Obama Administration maintained elevated spending through 2011 to stimulate overall demand. In contrast to the predictions of Prime Minister Cameron’s government, and contrary to the views of opponents of President Obama’s economic program, American income per capita continued a steady, albeit slow, recovery while per- capita income in the United Kingdom languished; indeed, the country fell into another recession.
The tale of two economies — and two fiscal policies — can be illustrated by reference to Figure 1 in the article:

Figure 1: Log real per capita GDP in US (blue) and in the UK (red), 2007Q3=0. Source: US BEA and UK Office of National Statistics, and author’s calculations.
For those who wonder what a broader cross-country comparison of growth rates and a measure of stimulus — namely the cyclically adjusted budget balances — reveals, one need look no further than Figure 2.
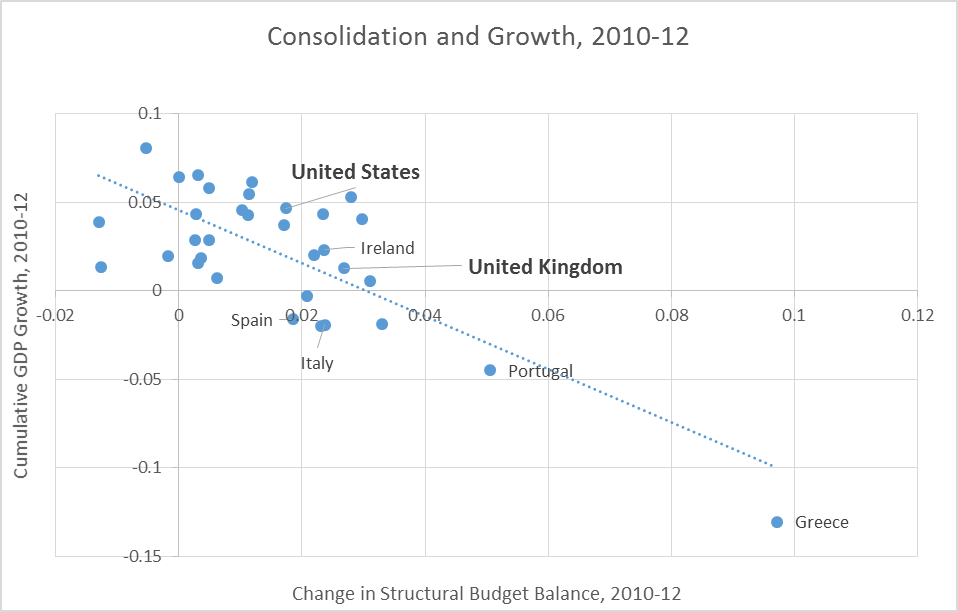
Figure 2: Cumulative GDP Growth and Change in Cyclically Adjusted budget Balance as a Share of Potential GDP, 2010-2012, for Advanced economies. Source: International Monetary Fund, World Economic Outlook October 2013 database, and author’s calculations.
The relationship is statistically significant, and negative. That is, countries that embarked upon fiscal consolidation in the 2010-12 period experienced slower growth. The regression coefficient is -1.10 (with a t-stat over 5.7 using White robust standard errors). That is, for each one percentage point increase in the structural budget balance (as a share of potential GDP), real GDP growth is lower by 1.1 percentage point. That finding remains intact if Greece is omitted.
The aforementioned negative correlation applies to the consolidation period; if one examines the longer 2009-13 period of recession and recovery, one finds that the the slope coefficient rises in absolute value) to -1.43. If one then uses the change in the primary structural budget balance (i.e., the structural budget balance omitting interest payments), then the slope coefficient rises (in absolute value) to -1.52, again significant. Some people have argued that the euro zone countries should be excluded, as they are not independent observations. It seems a little extreme to me to drop them all, but even if one does (and omits the city-states of Singapore and Hong Kong), one still obtains a negative coefficient of -0.85, statistically significant with a p-value of 0.002. The adjusted R2 is 0.33 (higher than the adjusted R2 for the full sample, at 0.22!)
All these developments have served to disrupt a seeming consensus on the limited efficacy of fiscal policy that prevailed before the Great Recession. From the article:
In the 1990s and first decade of the next century, a synthesis of the Keynesian and Real Business Cycle models— – dubbed the New Keynesian approach— – came to the fore. New Keynesians models varied but carried the common characteristics of sticky (or unresponsive in the short run) wages and prices. On the eve of the Great Recession of 2008-2009, the New Keynesian perspective dominated macroeconomic policy analysis. These models suggested that monetary policy would have little to moderate impact on output and, in fact, argued that constraining monetary policy to some set of well-defined rules, hence, eliminating discretion, would yield the best outcome. The implications of New Keynesian models for fiscal policy were largely unexamined, mostly because conventional wisdom already held that changes in spending and taxes (which require Congressional action) would be too difficult to accomplish in time to stabilize the economy.
So, on the eve of the Great Recession, it seems that mainstream macroeconomics had come to a comfortable spot; the basic model was again agreed upon, and the disputes revolved around parameter values. Nonetheless, even the models with estimated impact at the higher end implied modest effects of monetary and fiscal policy.
Then, vociferous debate in the United States over the 2009 stimulus package dispelled the illusion of consensus.
…
Why Was the Consensus Wrong?
The view that the impact of government spending was relatively small was common to analysts with both the Keynesian and New Keynesian perspectives. One reason that view proved wrong was that experts predicated it on “normal times”. But the times were hardly normal, for at least three reasons:
- Short term interest rates remained stuck near zero for more than five years, what is called the zero lower bound.
- The extent of economic slack was much greater than experienced during other recessions after World War II.
- The financial system was severely impaired.
Each of these points is discussed in greater detail in the Fiscal Multipliers entry in the New Palgrave Dictionary of Economics (post here).
I conclude:
The intellectual landscape half a decade after the Great Recession is quite different than it was a decade ago. Mainstream macroeconomic thought took the stable growth-low inflation environment of the previous 20 years as the norm. It assumed that the financial system had evolved to be robust to asset booms and busts. These assumptions proved grossly wrong, and so the need to re-assess many of the conclusions that followed is unsurprising.
It is interesting to consider the form in which intellectual resistance to this re-assessment takes. The response does not usually address the correlation shown in Figure 2. Nor does the rebuttal typically address why the price and wage levels typically fell during the great recession, rather than rise, as would be implied in a real business cycle interpretation reliant upon a negative supply shock (see this post). Rather, there are appeals to the Treasury view — fiscal stimulus in that manifests in higher activity in one sector must crowd out an equal amount of activity in the private sector. This argument is typically couched in an axiomatic mode. A more mathematically sophisticated approach argues that wedge between the intertemporal marginal rate of substitution and the marginal productivity of labor — the “labor wedge” — is due to taxes, either implemented or anticipated (so the recession beginning in 2007 could be blamed on the incipient policies of the incoming Obama administration, which began in 2009). More on the insights of the business cycle accounting approach in a future post.
The entire article is here.
Update, 3/13 9AM Pacific: Reader Britmouse wonders about the elevated inflation in the UK as a counter to the aggregate demand argument. A cursory examination of the data shows that inflation fell during periods of declining GDP growth, as shown in Figure 3.
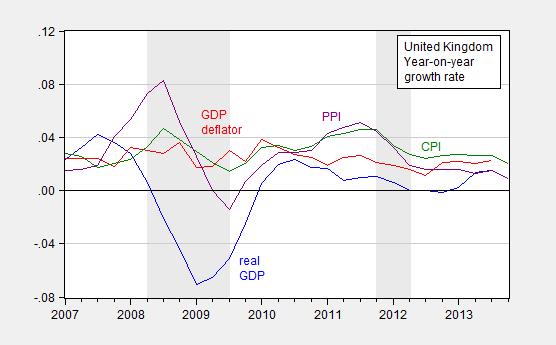
Figure 3: Year on year real GDP growth (blue), GDP deflator inflation (red), CPI inflation (green) and PPI inflation (purple). Recession dates shaded gray. Source: IMF, International Financial Statistics, accessed 3/13/2014.
The covariation of price inflation with economic activity seems more consistent with standard demand side interpretations than a supply side one.
From our previous exchanges I recall you are familiar with the UK macro data, which is freely available from the ONS. Your use of real GDP to explain demand-side effects hence remains curious.
If we take the period since 2007 Q3, the predominant factor explaining the difference between UK and US real GDP is supply-side. In the UK, hours worked has grown by 2% over the six years to 2013Q3, whereas US hours worked is roughly flat. US output/hour has risen 10%, whereas UK output/hour has fallen 2%. Thus we get a difference of about 8% in the change in the level of real GDP. It would be interesting – and pertinent – to repeat this analysis for the period of “fiscal contraction”.
Your reference to price and wage levels falling is also interesting; I am interested to know why you omit any discussion of the rise in UK inflation during the “double-dip” recession, with the CPI rate peaking at 5.2% in 2011. Indeed, there was not a single month during the 2010-2012 period of fiscal consolidation in which the inflation rate fell below the Bank of England’s 2% inflation target. Is this symptomatic of an “aggregate demand shortfall” in the Keynesian model?
I also find it “interesting to note” that regurgitations of the “fiscalist” narrative explaining the path of UK real GDP fail to address these well-known issues concerning productivity and inflation.
Britmouse: I’ve added Figure 3 for your benefit. Inflation falls when GDP falls. I think that’s what I would’ve predicted given primarily AD shocks during the recession periods.
I don’t understand your argument about hours. Total labor input will equal by accounting demand induced labor input. How the input is allocated between hours and productivity would depend on institutional factors and relative prices. Now, if you want to make an equation between average labor productivity and total factor productivity, well you are a braver person than I, upon reflecting upon labor hoarding, variable capacity utilization, etc.
The inflation picture is hardly as clear as you imply. Inflation (CPI/PPI) rises from 2010 to late 2011 – two of the years of fiscal consolidation, and again, crucially, remains above the Bank of England’s 2% target throughout 2012; you have ignored the question of what this implies for macro policy. The Bank has not merely hit, but overshot its nominal target for the entire period of fiscal consolidation. Apparently you believe it correct that we should take that data as evidence that monetary policy is unable to offset the effects of fiscal consolidation at the ZLB? Or do you have an “intellectual resistance” to addressing such issues?
If we compare the path of the GDP deflator between the US and the UK, as you did with RGDP, we find a similar story that the UK has had significantly greater inflation than the US; the price level has risen about 5% faster over the six year period to 2013Q3.
The point about hours is simply to illustrate that that the change in employment between the two countries over the period in questions shows the opposite of the result of the change in real GDP. This is sufficient to show that movement of RGDP should not be purely attributed to demand-side shocks. If you saw a negative productivity shock what else would you expect to see but higher inflation and lower measured productivity and output?
Britmouse: Since I’m primarily an open-economy macro guy, it occurs to me that one big difference between the US and UK is the latter is substantially smaller, and more open. In particular, if you look at the import price index, you’ll see a big shock in 2011-2012, which explains some of the faster overall inflation in the UK. I don’t expect that import prices are affected by technology shocks or government spending shocks — do you?
There were two import price shocks: 2007-8 and 2009-11 – the first was more severe in magnitude and speed. (On a historical note the import shocks are not dissimilar in magnitude to the early 1990s devaluation, which was co-incident with strong real growth, an interesting question is why this time was different.)
Why would you identify these very significant price shocks as anything other than a supply-side shock? The UK has a significant dependence on imported energy, in particular.
What happens when they do the same analysis with interest rates.
I’m unsure. As you surely know, there is an argument within the UK about the extent to which austerity occurred. That is, there were large cuts in public investment spending but also increases in safety net social spending.
jonathan: Given the multiplier is larger for spending on goods and services than for transfers, I would expect a contractionary impact from a shrinkage of the structural budget deficit.
Total Economic Debt to GDP
USA 2.75:1
UK 5:1
Good game and thanks for playing
http://www.gfmag.com/tools/global-database/economic-data/11855-total-debt-to-gdp.html#axzz2vs8YPfoo
Also, you need to show a reduction in debt:gdp for this to be meaningful. Proving you can borrow and increase consumption isn’t impressive.
The UK has suffered a negative labor productivity shock since 2007. This is an aggregate supply (AS) problem that neither fiscal nor monetary policy can do much to remedy.
According to The Conference Board:
http://www.conference-board.org/data/economydatabase/
Real GDP per hour worked declined by 2.5% between 2007 and 2009 in the UK, and in 2012 it was still 2.2% below its peak in 2007. In contrast US real GDP per hour worked has increased every year since 2007, and as of 2012 was up by 5.6%. In log terms the gap between US and UK labor productivity since 2007 reached 7.8% as of 2012. This more than accounts for the difference in real GDP per capita growth since 2007Q3.
This underscores the fact that the appropriate way of comparing the effectiveness of policies meant to affect aggregate demand (AD) is in fact to compare AD, that is nominal GDP (NGDP), not real output or real GDP (RGDP), since shifts in short run aggregate supply (SRAS) can change RGDP just as easily as shifts in AD can.
The following is the graph of logged NGDP per capita for the US and the UK indexed to zero in 2007Q3:
http://research.stlouisfed.org/fred2/graph/?graph_id=152889&category_id=0
It should be clear from looking at the graph that US and UK NGDP per capita performance was very similar until between 2011Q3 to 2012Q2 when a noticable gap opened up. Could fiscal policy have played a role?
In my opinion the most objective way of measuring fiscal policy stance is the change in the general government cyclically adjusted balance, particularly the cyclically adjusted primary balance (CAPB). The cyclically adjusted balance takes into account any changes in the general government budget balance due to the business cycle. Thus changes in the cyclically adjusted balance are mostly due to discretionary fiscal policy, and consequently may be taken as a proxy for the degree of fiscal stimulus. The CAPB goes a step further, factoring out changes in net interest on government debt and thus ensuring that practically all of the changes in fiscal balance are discretionary in nature. The best place to find CAPB data is the IMF Fiscal Monitor. You can find the CAPB on the bottom half of Table 2 on page 70:
http://www.imf.org/external/pubs/ft/fm/2013/02/pdf/fm1302.pdf
Between calendar years 2007 and 2009 the UK’s CAPB decreased by 5.1% of potential GDP, or exactly the same amount as the US’. This in part reflects the UK’s own fiscal stimulus, which although at 1.9% of GDP according to the OECD was approximately the third the size of the US’s fiscal stimulus, was nevertheless still significant, with over three quarters of its fiscal effect due to the reduction in the VAT from 17.5% to 15.0% during calendar year 2009.
In 2010 and 2011 the UK’s CAPB increased by 1.9% and 2.6% of potential GDP respectively. This partly reflected the increase of the VAT from 15.0% to 17.5% in 2010 and to 20.0% in 2011. (Note that the change in government took place in early 2010.) In contrast the US CAPB decreased by 0.2% of potential GDP in 2010 and then increased by 1.0% of potential GDP in 2011 as fiscal consolidation got underway there as well, largely as a result of the unwinding of the US fiscal stimulus.
The UK’s CAPB decreased by 0.2% of GDP in 2012 as fiscal consolidation was paused. In contrast the US CAPB increased by 1.1% of potential GDP in 2012. Thus it is somewhat ironic that the gap in NGDP per capita growth mostly opened up the very year the UK’s fiscal policy stopped being more contractionary than the US’.
Perhaps policy lags can explain this. Typically the major models assume that something like 80% of the level effect of government spending changes occurs in the first year of impact rising to near 100% the following year, and 40-50% of the level effect of tax changes occurs in the first year of impact rising to near 90% the following year. Since most of the fiscal tightening involved VAT increases, this might explain why the tax increases in 2010 and 2011 did not have much effect until 2011Q4 through 2012Q2. But I also suspect that monetary policy may be playing a role, as both the UK and the US have had large QE programs and each has been done in fits and starts since November 2008.
Finally, in 2013 the UK’s CAPB increased by 0.9% of potential GDP. By way of comparison the US CAPB increased by 2.3% of potential GDP. It’s perhaps too early to judge the effects of these most recent fiscal consolidations, but as the mystery of the unusually long lagged effects of UK fiscal consolidation suggests, perhaps the effects of monetary policy need also to be considered here.
1) Out of the 33 advanced nations included in the scatterplot, 17 are Euro Area nations or nations pegged to the euro (i.e. Denmark). If you separate them into two groups accordingly and remove Hong Kong as it is pegged to the dollar (leaving 15 non-euro nations), what you will notice is the apparent correlation is confined to the set of euro nations. This can be verified by regressing growth on the change in cyclically adjusted balance. The R-squared value of the euro nations and the non-euro nations is 0.661 and 0.093 respectively, the euro result is significant at the 1% level, and the non-euro other is not statistically significant. The point is of course that the non-euro nations each have their own independent monetary policy which may be able to offset fiscal policy.
2) As I mentioned in my previous comment above, the UK has been subject to a large decline in labor productivity effectively meaning it has suffered a negative aggregate supply shock. Consequently it might be better if nominal GDP were used instead of real GDP, as that is a more direct measure of aggregate demand. (A shift in aggregate supply can also change real GDP.) Replacing real GDP growth with nominal GDP growth raises the R-squared of the euro group to 0.720 and reduces the R-squared of the non-euro group to 0.015.
3) The cyclically adjusted balance tends to understate the amount of fiscal consolidation taking place in the Euro Area periphery. A better measure is the cyclically adjusted primary balance which can be found in the IMF Fiscal Monitor. Using this in place of the cyclically adjusted balance reduces the R-squared of the euro group to 0.602 and raises the R-squared of the non-euro group to 0.017. (It also reduces the number of nations to 14 for each set.) Interestingly, the slope of the non-euro group is now positive although it is obviously still not statistically significant.
4) In my opinion the end dates should be changed. Most of the Euro periphery and the UK began fiscal consolidation in earnest in 2010. Furthermore, the US just underwent its heaviest year of fiscal consolidation. Thus I would choose 2009 and 2013 as the end dates. Doing this results in an R-squared value of 0.827 for the euro group and 0.000 for the non-euro group.
5) One can go further with the non-euro group by focusing on those nations at or near the zero lower bound in interest rates. But this would only leave five nations (the Czech Republic, Japan, Switzerland, the US and the UK). Adding the Euro Area as a whole expands this to six currency areas. The R-squared value is 0.219 but the result is statistically insignificant. Interestingly the slope is positive and this is driven primarily by the US and the UK.
Mark A. Sadowski: I believe trends in total factor productivity have an impact on trend potential GDP, but I think it is a serious error to take short run movements in calculated average labor productivity — or even multifactor productivity — as supply shocks, given that MFP/TFP is calculated as a residual. In fact, if you inspect the UK ONS calculations, you will see implied “techological regress” starting in 2003 in primary sectors! And what sector experienced the biggest AS shock? Construction! Now, one could say the UK construction firms “forgot” how to use their bulldozers as efficiently as they used to, starting in 2005, and accelerating in 2009. Or one could say that the decline in measured TFP incorporates a lot of stuff driven from the demand side. In fact, it’s this difficulty with interpreting short run productivity measures that drove, I thought, the profession’s use of SVARs to identify aggregate supply or technology shocks.
This makes sense provided one assumes that AD shocks have the ability to feed back into AS. If that is the case then identifying AS shocks obviously becomes much more problematic. Since AD (NGDP) is far easier to determine with any precision than is potential GDP (a point on the AS curve), and this would be even more so assuming AD affects AS, it seems that stabilizing AD makes a much more sensible policy goal than trying to minimize the output gap, which would then be a moving target under this assumption. And in fact, whereas UK NGDP is still over 15% below trend, the BOE’s estimate of the output gap is now only 1.0% to 1.5% of potential GDP, suggesting a policy of stabilizing AD would be the more expansionary one.
That is why, as alarming as the graph of relative US and UK RGDP per capita growth may be to those following British economic policy, the far more illuminating graph from a demand side policy perspective would be the one of NGDP.
“In fact, it’s this difficulty with interpreting short run productivity measures that drove, I thought, the profession’s use of SVARs to identify aggregate supply or technology shocks.”
Do you have a particular paper, or set of papers, in mind?
Mark A. Sadowski: On the general issue of interpreting the Solow residual as a measure of technology shocks, see Greg Mankiw, “Real Business Cycles: A New Keynesian Perspective,” Journal of Economic Perspectives, Vol. 3, No. 3, pp. 79-90, (Summer 1989).
Britmouse My understanding is that a VAT hike accounted for about half of the jump in CPI. In the context that Menzie is talking about I don’t think that exactly counts as the kind of inflation that’s understood in macro models. The VAT itself was contractionary.
You get an incomplete picture , less than half in most cases , looking only at the fiscal deficit. What about the private sector ? Have households and businesses continued to increase their leverage in some countries while reducing it in others. Private deficit spending is “stimulus” , too. Given equal levels of fiscal stimulus and equal economic growth performance , those countries that reduced private leverage get a gold star compared to those that didn’t. This shouldn’t even be a question this late in the game.
Here’s a pic showing that the U.S. has done a bit better in reducing combined public/private nonfinancial debt/gdp ratios than the UK , thru 2012:
http://ftalphaville.ft.com/files/2013/05/Citi-UK-delever-May-31-2.png
from :
http://ftalphaville.ft.com/2013/05/31/1521412/a-uk-deleveraging-disagreement/
MAS: “In my opinion the most objective way of measuring fiscal policy stance is the change in the general government cyclically adjusted balance, particularly the cyclically adjusted primary balance (CAPB). The cyclically adjusted balance takes into account any changes in the general government budget balance due to the business cycle. Thus changes in the cyclically adjusted balance are mostly due to discretionary fiscal policy, and consequently may be taken as a proxy for the degree of fiscal stimulus.”
So let me get this straight – if the country’s fiscal budget declines during recession owing to automatic unemployment benefits, it gets no credit for taking a positive fiscal policy action, but if it has no automatic unemployment benefits and decides to pay some during a contraction, it gets credit for taking positive fiscal policy action? Why discriminate against longer-term government policies when deciding whether a country is taking positive action? What, exactly, is the value in distinguishing between discretionary fiscal policy action and automatic fiscal policy action?
Fiscal deficits are endogenous to the state of the economy. Thus measuring fiscal policy stance without correcting for business cycles would tend to exagerate the contractionary effects of fiscal policy during expansions and the expansionary effects during contractions.
http://www.imf.org/external/pubs/ft/tnm/2011/tnm1102.pdf
“Measuring the fiscal policy stance.
Changes in structural balances can also indicate the impact of discretionary fiscal policy on the economy (Muller and Price, 1984). For example, a widening in the structural deficit points to an expansionary fiscal policy stance, or in other words, to an intended positive contribution of discretionary fiscal policy to aggregate demand (the actual impact depends on other factors and could result in different effects from those originally planned)…”
Incidentally, if you have concerns with this approach you should probably also address this question to Menzie Chinn since Figure 2 uses cyclically adjusted balances (CAB) and the use of cyclically adjusted primary balances (CAPB) is dicussed in this post.
“Fiscal deficits are endogenous to the state of the economy. Thus measuring fiscal policy stance without correcting for business cycles would tend to exagerate the contractionary effects of fiscal policy during expansions and the expansionary effects during contractions.”
The degree of endogeneity of the fiscal deficit is a measure of the response of the fiscal balance to business cycles. I fail to see the point of distinguishing between whether the policy actions were taken in deliberate response to business cycle changes after they are revealed, or whether they were incorporated into the structure ahead of time. Does it even matter whether a particular fiscal policy response is a deliberate reaction to a business cycle change, or is the result of some other policy goal, such as ‘equity’ in income tax burdens?
Menzie is invited to jump in if he can shed some light on this question.
The only reason that comes to mind for making such a distinction is for rather shallow political analyses on whether discetionary actions of the current governing authorities are adding to the problem or helping alleviate it. But even then, one would have to explain why their short-term discretionary actions should be weighed without taking into account the automatic responses of fiscal policy that come from longer term policies. Particularly in international comparisons, such a procedure seems peculiar.