In the IMF analysis of capital flows highlighted in yesterday’s post, the VIX is used to proxy for risk. This variable has a lot of explanatory power [1] [2], but there is more to be investigated. Jan Groen and Richard Peck at the NY Fed examine the nature of risk in international financial markets, in a Risk Aversion, Global Asset Prices, and Fed Tightening Signals :
The global sell-off last May of emerging market equities and currencies of countries with high interest rates (“carry-trade” currencies) has been attributed to changes in the outlook for U.S. monetary policy, since the sell-off took place immediately following Chairman Bernanke’s May 22 comments concerning the future of the Fed’s asset purchase programs. In this post, we look back at global asset market developments over the past summer, and measure how changes in global risk aversion affected the values of carry-trade currencies and emerging market equities between May and September of last year. We find that the initial signal of a possible change in U.S. monetary policy coincided with an increase in global risk aversion, which put downward pressure on global asset prices.
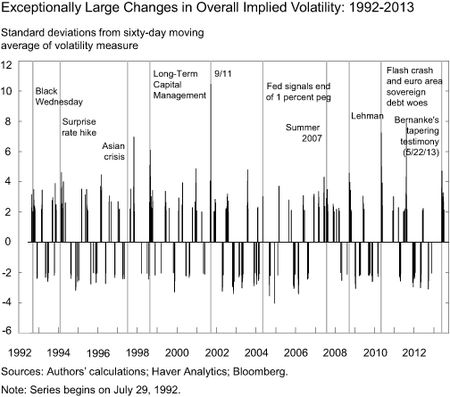
Implied volatility measures across different assets reflect, among other factors, market participants’ views on risk. Therefore, we conjecture that shifts in their risk aversion coincide with exceptionally large changes in implied volatility measures. An “exceptionally large” change in this case is defined as when overall implied volatility is at least two standard deviations above or below its mean over the previous sixty days. (“Overall implied volatility” is constructed as the average of the VIX index for U.S. equities, the Merrill Lynch Option Volatility Estimate [MOVE] Index for U.S. Treasury bonds, and the J.P. Morgan Global FX Volatility Index.) The chart below depicts changes in overall implied volatility for daily data from 1992 to September 2013, with labels for some key events that caused market turmoil. Exceptional volatility changes often occur in conjunction with these events, suggesting that these volatility changes are positively correlated with changes in (unobserved) risk aversion.
After examining the impact on the US dollar, carry trade returns and emerging market equity indices, the authors conclude:
Measuring changes to global risk aversion is a difficult exercise. The model used here suggests that substantial changes in risk aversion coincided with Chairman Bernanke’s May 22 testimony, resulting in substantial downward pressure on global asset prices in the two months after the May 22 testimony.
More in the post.
I am not sure of what value this index has…The fluctuations do not sign
an oncoming recession, which the exception of 2009…The movement are
also very extreme and difficult to interpret…
Those that have traded this vehicle have taken very large draw downs; so
as a market indicator it has proven to be a poor performer.
CDSs or Credit Default Swap, have been a much superior index in weighing
overall market risks, IMHO.
Extreme levels of leverage, including margin debt and non-financial corporate debt to wages and GDP (a record), and associated bubbly equity market capitalization to GDP is THE RESULT OF ZIRP, QEternity, and “forward guidance”, whereas there is little to no evidence of a corresponding “wealth effect” (but instead a “bubble effect”) that persists from rising asset prices:
http://www.hoisingtonmgt.com/pdf/HIM2014Q1NP.pdf
Moreover, historically, bubbly asset prices as a share of GDP and wages are a guarantee of low, no, or negative real total returns to equities thereafter, as well as slow or no real GDP per capita growth for years.
Finally, asset bubbles lead to disproportionately large net flows to the financial sector, which in the case of the US today has resulted in net flows to the financial sector exceeding growth from a year ago of nominal GDP and wages. In fact, financial profits are at or near a record high for total profits and as a share of GDP, which is 3-5 times the historical average.
Thus, central bank-induced asset bubbles and the associated record debt to GDP and wages are now a debilitating extractive constraint on post-2007 real GDP/final sales per capita hereafter.
The Wilshire 5000 index is now as overvalued as a share of GDP (adjusted for CPI and the US$) as at the dot.com bubble peak (the new Fed graphing tools are still buggy and do not consistently show chart data as selected):
http://research.stlouisfed.org/fred2/graph/fredgraph.png?g=yGs
However, small-cap stocks are 54% more overvalued to GDP than at the dot.com bubble peak, and 26% more overvalued than in 2007:
http://research.stlouisfed.org/fred2/graph/fredgraph.png?g=yGt
Whoever says that the equity market is not in a bubble, or that bubbles cannot be discerned in real time or in advance of a crash, are either lying, they do not know what to look for to identify a bubble, or they are not paid to identify bubbles and thus are paid instead to ignore bubbles, not identify bubbles, and therefore tacitly, or otherwise, promote and encourage bubbles with the inevitable result of crashes and successive bailouts.
If, or when, the stock market crashes, it will not be because of some “exogenous” event or a Fed policy error hereafter but the previous actions by the central bank that encouraged serial bubble blowing and overvaluation going back to the 1987 Crash when the Fed, acting on the direction of its Too-Big-to-Exist (TBTE) bank owners, committed to bailing out every financial bubble the TBTE banks could create and that inevitably bursts.
The stock market is now into, or slightly past in time, a classic historical cyclical log-periodic super-exponential blow-off trajectory that ALWAYS crashes and resolves in an “anti-bubble” trajectory taking the equity market indices back to no higher than the point at which the super-exponential trajectory commenced, which in the case today would be the acceleration that began after the Fed’s “Twist” and “all in”, i.e., S&P 500 1000s-1200s. Yes, the Fed was directed by the TBTE banks to encourage and sustain ANOTHER massive financial asset bubble.
Moreover, following each cyclical blow-off trajectory, the average cyclical stock market decline was ~40-45%, including the crashes of 1907-08, 1929-32, 1937-38 (and to 1942), 1987, 2000-02, and 2007-09. Of the five largest crashes following blow-off trajectories, the average decline was 54%, including the 84% decline in 1929-32, and ~50% without.
Given the equity market capitalization to GDP, Q ratio, and Shiller’s P/E, the S&P 500 is no less overvalued today that at the dot.com bubble peak. The stock market is in a HUGE leverage-induced bubble. All bubbles burst, and the largest bubbles burst spectacularly and result in the largest dislocations to the financial system and real economy. It is NOT CREDIBLE that Yellen claims that there is no bubble, or that there are no bubbles anywhere, when it is unambiguously obvious that the Fed has again been directed to create this time the largest global debt and financial asset bubble in history.
The only question that remains is when the principals of the TBTE banks pull the plug on this bubble as they did beginning with Bear Sterns in 2007 and coincident with the Lehman takedown in 2008, and in 2001 ahead of 9/11. What convenient excuse will the TBTE banks use this time to pull the plug on the bubble . . . ?
“Whoever says that the equity market is not in a bubble, or that bubbles cannot be discerned in real time or in advance of a crash, are either lying, they do not know what to look for to identify a bubble,”
BC, could you please identify the next stock market bubble. Please give me a date when it will pop;
so I can go all cash. You are right about one thing, everyone can see the bubble but few can call
the pop.
Hans, I just identified the stock market bubble, but it’s not about calling “the pop”, as I would not tell you when IF I had that kind of insider knowledge; rather, it’s about reducing point, cyclical, and tail risk of drawdown and to optimize risk-adjusted returns over the cycle. Today the 5- to 7-year risk-adjusted return prospects imply negative average real total returns for the S&P 500, Wilshire 5000, and Russell 2000, and as low as 0-2% for a 10-year return.
Moreover, the cyclical bubbly valuations at record private debt to GDP and wages, and at OBSCENE levels of wealth and income inequality, imply ~0% average real final sales per capita for another cycle, i.e., ~40-59 months, which in turn suggests little or no revenue growth and the increasing probability of trend nominal GDP and wages decelerating to the ~0-1.5% range.
If you’d like a few of many reasonably reliable indicators of at least a 7-10% seasonal correction or a 20-25% selloff (or first leg down of a cyclical bear market after a cyclical blow-off, in this case happening Sept-Oct 2013), here are a few:
http://stockcharts.com/h-sc/ui?s=IWM:TLT&p=W&yr=3&mn=0&dy=0&id=p75893291902
http://stockcharts.com/h-sc/ui?s=QQQ:TLT&p=W&yr=3&mn=0&dy=0&id=p98599234861
https://app.box.com/s/oauo9c5z7qi4ceqv0iqr
https://app.box.com/s/u7k140087xewddvn20f5
If a bear market of at least 35-40%+ occurs for the S&P 500 or the Russell 2000 in 2014-15, I’ll accept payment for calling the bubble and pop for you in the form of a case of Dead Guy Ale from Rogue Brewing:
http://www.rogue.com/roguebeers/
Cheers!
Thank you the links, BC…
If you are correct, I will robo drone your case of beer directly to
your resident per your instruction.
Hans, a true sporting gentlemen you are, indeed. 🙂
Although, I should say that my cell service is notoriously spotty, so I will be sure to buy a sturdy net in anticipation of having to make a running catch of the bear case drop. 🙂
Likewise, BC! One case of your Favor Flav if you are correct…
You have excellent taste, my dear chap..
In the event I win hear is my # 1 beer..
http://www.sierranevada.com/beer/year-round/torpedo-extra-ipa
BTW, I think your call is very good!