The abstract from the recent IMF’s World Economic Outlook chapter on investment:
Private fixed investment in advanced economies contracted sharply during the global financial crisis, and there has been little recovery since. … business investment accounts for the bulk of the slump, and the overriding factor holding it back has been the overall weakness of economic activity. In some countries, other contributing factors include financial constraints and policy uncertainty. These findings suggest that addressing the general weakness in economic activity is crucial for restoring growth in private investment.
I think this summary is interesting to the extent it relegates the policy uncertainty factor to second tier, placing at the forefront deficient aggregate demand. This conclusion was hinted at in this 2012 post. Here’s an update on US business fixed investment.
First, let’s examine net investment, as opposed to gross investment, is the variable of interest in theoretical models.
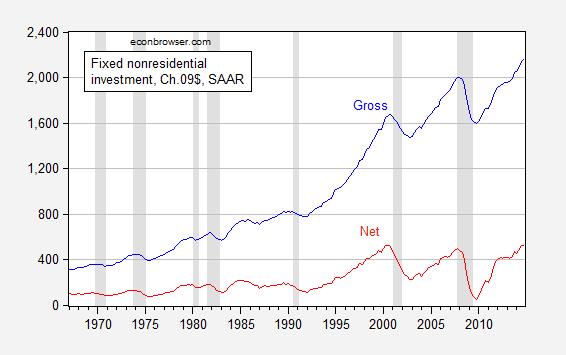
Figure 1: Nonresidential gross (blue) and net (red) fixed investment, in billions Ch.2009$, SAAR. NBER defined recession datse shaded gray. Source: BEA (2014Q4 2nd release), NBER, and author’s calculations.
Figure 1 makes clear that net investment in constant dollars is pretty much constant from peak to peak.
Now, what of the policy uncertainty? Since the last shutdown, uncertainty, as measured by the Baker, Bloom and Davis index has declined substantially. Investment has increased, but a much bigger increase occurred before the decline.
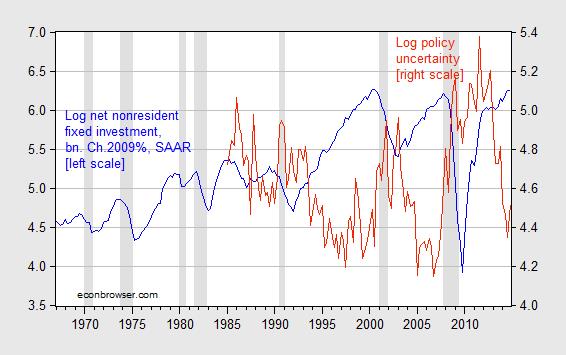
Figure 2: Log net nonresidential fixed investment (blue) and log policy uncertainty (red). NBER defined recession datse shaded gray. Source: BEA (2014Q4 2nd release), author’s calculations, NBER, and policyuncertainty.com.
Most models focus on the investment to capital ratio. I plot the gross and net investment to capital log-ratios in Figure 3 (for an explanation of why one needs to log, see this post).
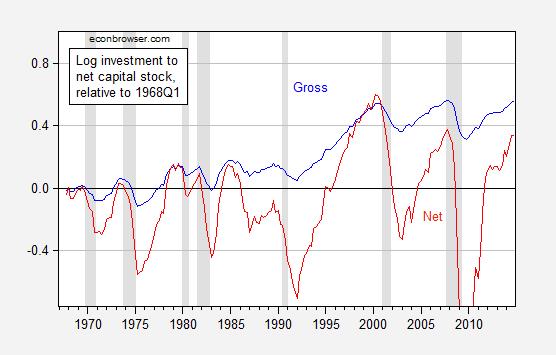
Figure 3: Gross nonresidential fixed investment (blue) and log net nonresidential fixed investment (red) as a log ratio to net nonresidential capital stock. NBER defined recession datse shaded gray. Source: BEA (2014Q4 2nd release), NBER, and author’s calculations.
What’s the impact of policy uncertainty? In order to obtain a first-cut answer, I run a regression of log investment to capital stock over the 1985Q1-2014Q4 period on the four quarter growth rate of real GDP, on log policy uncertainty, and the real S&P (a proxy for Tobin’s q), along with a linear time trend.
log(I/K) = -9.2 + 7.85Δy – 0.029U + 0.87log(S&P) -0.007time
Adj-R2 = 0.50, SER = 0.31, DW = 0.22 N = 120. Bold face denotes significance at the 5% MSL, using HAC robust standard errors.
While the DW statistic is pretty low, if one first differences this specification and omit the time trend, then the only statistically significant variable is GDP variable…
Nice.
Capital accumulation to GDP.
Wages to GDP and decelerating labor productivity (labor can’t afford what it produces in exchange for wages after regressive payroll taxes and debt service).
Employment per capita (production at labor returns plus replacement cannot compete with Fed-induced returns to financial capital).
Real per capita gov’t receipts and spending are decelerating to an historical recessionary level.
The US is no longer creating net new, full-time, private-sector employment per capita so that capital deepening and multifactor productivity can increase sufficiently to provide real, after-tax purchasing power per capita of the labor product of the bottom 80-90% to permit growth of real final sales per capita after spending by gov’t, private “health care” and “education”, debt service of households and firms, and primary energy consumption per capita to GDP.
Put another way, we can no longer afford the oil-, auto-, debt-, and suburban housing-based (un)economic system that emerged after WW II, reached its peak in the 1970s-80s, and has been financed at diminishing returns to net energy per capita since the 1980s by unsustainable growth of debt and gov’t borrowing and spending to wages and GDP.
We can no longer afford to grow real final sales per capita AND increase private investment, capital accumulation, private, full-time employment and purchasing power, and gov’t receipts to support the $200 trillion in gov’t promises to the bottom 80-90% in perpetuity.
That is to say, “capitalism” (or rentier-socialism as it has become, given total net flows to the financial sector now equal total annual GDP output, funded and reinforced by Fed/TBTE and tax and fiscal policies) is no less unsustainable hereafter than all other “isms”. We need a new “ism” (based on understanding of thermodynamics, net energy, exergy, etc.) to quickly adapt to Peak Oil, “Limits to Growth”, population overshoot, and inexorable resource depletion per capita.
Energy conservation and incentives to reduce or discourage the rebound effect. Ecological remediation, i.e., rewilding. Net energy efficiency per capita. Redistribution of income. Elimination of fractional reserve banking and debt-money. Ending taxes on productive investment, production, labor, business profits, and savings. Basic Income Guarantee for the bottom ~80% working class and phasing out all social-welfare programs, including bureaucracies to administer them.
“The enemy” of empire and the rentier Power Elite top 0.001-1% is not Radical Islam, Russia, China, or an uprising by the seething masses of poor and working-class people around the world, including in the US. “The enemy” is a lack of the rentier Power Elite’s universalist-humanist sensitivity and a vision for a viable social compact, self-interested incentives, motivation, imagination, and social, economic, financial, and political innovations to avoid collapse of Anglo-American-Zionist empire and the mass-consumer economy for the bottom 90%, and then eventually the next ~9% above.
Eventually a large enough plurality of the professional middle-class intellectuals, techno-scientific types, and warriors (even those at the University of CA and WI) of the next 5-9% below the top 0.001-1% will lose faith and patience with the rentier-parasitic Power Elite’s plunder, self-satisfaction, indifference, insensitivity, and unaccountability to the rest of society.
R-evolutions do not occur from the bottom up but rather indirectly when the buffer caste between the seething suffering peasant masses and the elites begin to fear for their own socioeconomic security, well-being, and status. We are entering the transitional progression of just such an historical epoch, not unlike the 1930s-40s, 1890s, 1830s-40s, 1780s-90s, and 1730s-40s in the West. The closest historical parallels to our time today occurred during the transition from British Empire to Anglo-American empire in the 1890s-1920s and during the period of the American and French Revolutions in the 1780s-90s. But the human ape population in the latter case was less than one-third of today’s level, and the net energy per capita level of GDP was an even smaller fraction of today’s level.
Therefore, the implied population level, even in the West, suggested by the net energy per capita equivalent of fossil fuel “energy slaves” is a grim fraction of today’s level and should keep every reader of this missive awake at night perpetually.
Anyone with 7+ figures in fiat digital debt-money credits perceived as “wealth”, i.e., a large majority of the top 1-10% to 20%, including public pensions discounted at unsustainable returns in perpetuity, should be doubly concerned that the bottom 80-90%+ can in NOW WAY produce sufficient labor product and purchasing power per capita to sustain themselves, let alone support indefinitely the complex, high-entropy, hierarchical flows of resources, income, and political power required to support our utterly unsustainable system of resource, income, and wealth (claims against Nature and labor) distribution on a finite spherical planet.
On the other hand, Shoag and Veuger in Uncertainty and the Geography of the Great Recession construct a state level version of the policy uncertainty index and show that it explains cross-sectional differences in employment during the Great Recession.
The IMF states:
“Private fixed investment in advanced economies contracted sharply during the global financial crisis, and there has been little recovery since. … business investment accounts for the bulk of the slump…”
This is a clear example of the results of no longer teaching logic. Private investment contracted because investment slumped – DUH!! This is such a foolish example of circular thinking it would be funny, except these people make policy based on such tripe.
Then the analysis is totally Keynesian, consumption-based, and so can never explain what investment actually is. To the Keynesian investment is just the opposite, consumption, but to the real world producer investment is the creation of better means of production, capital production. If you read the analysis from an asset based perspective you begin to see how confused it really is.
Ricardo: If you read closely, you would understand the distinction between overall private investment and business investment. The other category is residential investment. Hence, this is a statement about the composition of the change in overall private investment, not a tautological statement (using words in the way most normal humans discussing economic matters use them).
Menzie,
If you read carefully you will see that the analysis is based on spending not increased capital. My comment was not directed at the composition of investment but the methodology of measuring investment. In an analysis of spending it is a measure of consumption not investment. You don’t really know productive capital investment unless you measure a change in capital rather than spending. I realize you are trapped in a Keynesian paradigm and may not understand my comment.
Do you actually believe private spending, business spending, and residential spending all represent the same asset mix or even the same reason for spending?
Certainly your analysis is mainstream in modern economic circles but that does not mean it is not based on flawed assumptions. Keynes GENERAL THEORY is not even 100 years old and it has already being replaced by the new Keynesians.
Ricardo: Figure 1 depicts net investment, i.e., change in the net capital stock. The regressions results pertain to net investment as a ratio to net capital stock.