and is forecasted to continue to lag.
The Philadelphia Fed has recently revamped the formulas used to calculate the coincident indices used to track state economies [1]. Wisconsin’s lagging performance remains unaltered using these new metrics to judge. Moreover, leading indices indicate that Wisconsin will continue to lag. This is shown in Figure 1.
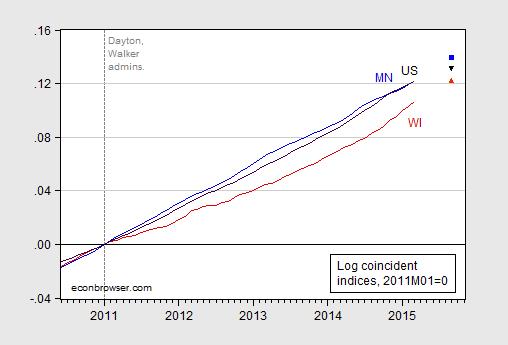
Figure 1: Log coincident indices for Minnesota (blue), Wisconsin (red) and the US (black), all normalized to 2011M01=0. Observations for 2015M09 are log-levels implied by leading indices. Source: Philadelphia Fed, and author’s calculations.
Hence, this is the answer for those people who thought newer data would vindicate the Governor’s tax cut/spending cut/deregulatory/anti-union policy framework: no catch-up to the rest of the country (or Minnesota for that matter). And what about for those who thought Minnesota’s mainstream approach to public finance would lead to disaster? Here’s one prognostication, from reader Ed Hanson, a week and a half ago:
Also as I noted in previous posts, Minnesota’s leading indicators has plunged to 0, which I believe is indicating the coincidence index should shortly begin a similar plunge. Do you expect that? I continue to speculate the lag from Minnesota’s unreasonable tax increases of 2013 is over and the consequences are now here. Do you have any better stats for the future on Minnesota?
These are the better stats. Wisconsin is forecasted to grow 1.58% over the next six months, Minnesota 1.81% (non-annualized). That means that by September 2015, Wisconsin will have lagged a cumulative 1.8% since 2011M01, despite the slight acceleration in Wisconsin growth in recent months.
As I have noted elsewhere, much of the surge in WI nonfarm payroll employment (a series used in the construction of the coincident index) occurs after September 2014, and hence after QCEW data availability. Much of the surge that was apparent starting in late 2013 was subsequently “benchmarked away” with the incorporation of QCEW data; it may again be the case this time around. If that outcome is realized, then the Wisconsin coincident index will likely be revised downward (although we won’t know until nearly a year from now). For now, we know employment fell in Wisconsin last month. [2]
Tax cut/spending cut/deregulatory/anti-union policies do not promote economic growth. Thank you for documenting this Dr. Chinn.
The mix of growth is important. The goal should be to raise living standards.
“Tax cut/spending cut/deregulatory/anti-union policies do not promote economic growth.”
So tax increase/spending increase/pro-regulatory/pro-union policies do promote economic growth?
Ricardo,
The negative of a disproved theory is not corollary. In other words, just because tax cuts/spending cuts/etc do not promote economic growth (which they don’t) it does not follow necessarily that tax increases/spending increases do promote growth.
However, there is stong evidence that tax cuts DO NOT promote growth. See Bush years, Kansas, Wisconsin, etc. I would say there is even stronger evidence that spending cuts DO NOT promote growth (see any of the European country austerity programs, etc.).
Gridlock,
Bush tax cuts did promote growth. Only after the Democrats took control of congress in 2006 did the economy begin to decline. Kansas and Wisconsin are fine even though Kansas created some problems with how they cut taxes and Wisconsin is fighting the Democrat Nazi Party. But what about Baltimore, Detroit, Chicago, New Orleans, I could go on and on. All of these followed the tax increase/spending increase/pro-regulatory/pro-union policies not to mention crony socialism killing free markets.
Ban this poster, comparing Democratic Party to the Nazis so far from sanity, that there is no need to engage in further discussion with them. They are either morally bankrupt or insane. Never forget means never forget. Ban this poster…
Mr. Ricardo,
Please take a moment to check the facts about Wisconsin: The Assembly, Senate, and Governorship is firmly in the hands of the Republican party. Every committee in the legislature is dominated by the majority party. The Democrats make a few noises and then all motions are passed by Republican majority. Whatever problems Wisconsin has have been created by the Gov. Walker and the Republican party. You are incorrect, there is no gridlock. Anyone who does not reside in Wisconsin can tally the party affiliations and committee assignments here : http://legis.wisconsin.gov/.
Which of Walker’s policies negatively affect employment in the Service Providing industries, while favoring employment in the Government, Construction and Manufacturing industries? Compared to the US, Government, Construction, and Manufacturing employment performance is strong in Wisconsin, so Walker must be better at employing government officials than other governors. This seemed odd to me given that the media paints Walker as anti-government (obviously, Education is excluded from Government, and is lagging the US by 0.02 on a logged basis).
Conversely, it appears as though the industry that is most lagging the US is the service providing industry. More specifically, Transportation, Warehousing and Utilities is performing the worst, then Leisure and Hospitality, then Professional and Business Services. A lagging Leisure and Hospitality industry may make sense if Walker’s policies decreased benefits received by the poor, and I am wondering which of Walker’s specific policies did so? Also, which of Walker’s policies would limit employment in the Transportation, Warehousing and Utilities sector?
Overall, the Private sector is lagging the US by 0.03 on a logged difference basis.
These calculations were meant to use the same methodology as the chart in this blog, and (hopefully) do so. Data used for the US comes from the St Louis Fed Fred databank and represent BLS estimates, while the Wisconsin data comes from the DWD. Calculations use logged employment differences between March 2015 and January 2011.
One can see the collateral effect of the Walker Administration’s strategy to focus political, media, and intellectual attention on the so-called “Gold Standard” QCEW numbers as part of its campaign to undermine the accuracy and policy implications of the monthly numbers (a campaign which, to my very thorough review, occurred in no other state of the union; Texas, in particular, trumpets the monthly data). As Menzie points out above, “…then the Wisconsin coincident index will likely be revised downward (although we won’t know until nearly a year from now).” The delays and lags in obtaining the QCEW numbers make for very old news–news that will receive little coverage or analysis. The effects of the periodic reassessments of others numbers by QCEW will be ancient history. In the end, Walker has achieved his cherished goal: All Numbers, Except Those of His Own Creation, Become Suspect.
Walker is not lagging in the polls though, as he has a commanding lead in the polls in Iowa.