How well has Wisconsin economically performed, as compared to its neighbor Minnesota, and to the US overall: here are six pictures of economic activity, employment, unemployment, real personal income, gross state product, and median household income, with which to make an assessment.
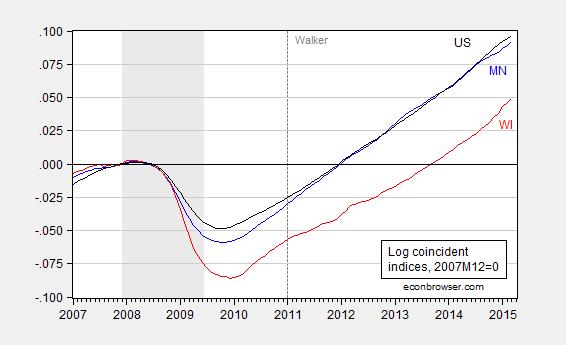
Figure 1: Log coincident indices for Minnesota (blue), Wisconsin (red), United States (black), normalized to 2007M12=0. NBER defined recession dates shaded gray. Source: Philadelphia Fed, NBER, and author’s calculations.
This is perhaps the most significant of the graphs, if one is interested in measures of overall economic activity. The Philadelphia Fed describes the index thusly:
The coincident indexes combine four state-level indicators to summarize current economic conditions in a single statistic. The four state-level variables in each coincident index are nonfarm payroll employment, average hours worked in manufacturing, the unemployment rate, and wage and salary disbursements deflated by the consumer price index (U.S. city average). The trend for each state’s index is set to the trend of its gross domestic product (GDP), so long-term growth in the state’s index matches long-term growth in its GDP.
The approach uses the Stock-Watson methodology for extracting a latent variable for each state economy. The specific method is the Kalman Filter. For additional technical details, see this working paper (published in REStat).
Hence, in order to get the most comprehensive assessment of overall economic activity at high (monthly) frequency, this seems the best indicator, subject to the caveat that this is (like GSP, employment, etc.) an estimate.
Note that Wisconsin economic activity fell more during the recession than the Nation as a whole, and Minnesota, its next door neighbor (which has conducted a much less fiscally contractionary policy). At the same time, Wisconsin has not experienced a measurably faster rate of growth than the Nation (or Minnesota). Since the US trough (2009M10), US growth has been 2.6% per annum (calculated as log differences), Wisconsin growth since Wisconsin trough (2009M12) has been 2.5%. The analogous figures since 2011M01 are 2.9% (US) and 2.6% (WI). Note that Minnesota, which did not experience as large a decline as Wisconsin, has grown 2.9% since 2011M01, and 2.7% since MN trough (2009M10).
Further note that as of 2009M12 (Wisconsin’s trough), Wisconsin was 3.8% lower than the National average (normalizing at 2007M12); that is Wisconsin fell by 3.6 percent more during the recession. As of 2015M03, it was 4.6% — that is Wisconsin has continued to fall behind the Nation. As is apparent from Figure 1, this characterization is true for Wisconsin relative to Minnesota as well.
Hence, the assertion that Wisconsin’s recession was substantially milder than the Nation’s as a whole is not validated using the coincident indicator (although there may very well be an indicator for which it is true).
Figure 2 depicts the evolution of nonfarm payroll employment.
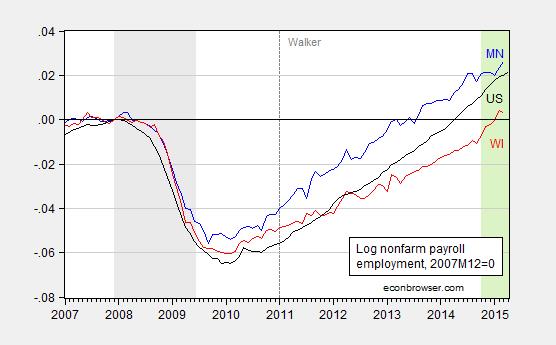
Figure 2: Log nonfarm payroll employment for Minnesota (blue), Wisconsin (red), United States (black), normalized to 2007M12=0. NBER defined recession dates shaded gray. Green shaded area pertains to CES data for which QCEW data is not available. Source: BLS, NBER, and author’s calculations.
Wisconsin employment falls a little less than the Nation’s (0.5% as of 2009M12), but grows much more slowly. Interestingly, Minnesota fell less than Wisconsin (0.8%), but Wisconsin employment has grown more slowly so that by March 2015, Wisconsin cumulative employment relative to Minnesota is 2.3% lower. In other words, in this case again, Minnesota experienced a smaller downturn and yet has faster employment growth.
One could argue that Wisconsin has experienced a slower trend employment growth for many years, predating 2011M01. In order to account for the counterfactual, I estimated a cointegrating relationship between US and WI employment over the pre-2011M01 period, and used out of sample forecasting to assess whether WI employment has been lower than that implied by historical correlations, with statistical significance (technically, an ex post historical simulation where I take the right hand side variable to be exogenous). The answer is yes; see this post.
Figure 3 depicts the evolution of unemployment rates.
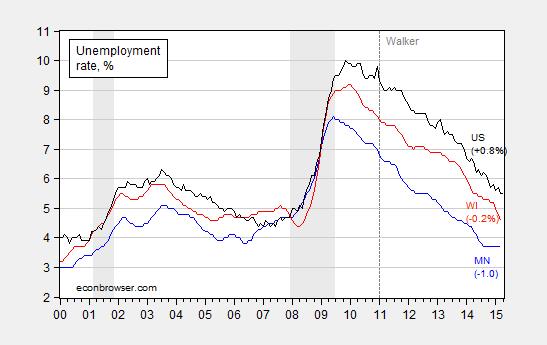
Figure 3: Unemployment rates for Minnesota (blue), Wisconsin (red), United States (black), in %. Numbers denote unemployment rates relative to 2007M12. NBER defined recession dates shaded gray. Source: BLS, NBER, and author’s calculations.
The assertion that Wisconsin’s unemployment rate has come down particularly fast is true over the past few months. However, Minnesota’s has come down more since the onset of the recession in 2007M12 (as has the Nation’s). It is also useful to recall that Wisconsin typically has a lower unemployment rate than the Nation’s by about 0.8-0.9 percentage points.
Turning to personal income (Figure 4), one sees a different pattern. Wisconsin experiences a smaller decrease in real income, and yet experiences slightly slower growth than the US and Minnesota, particularly since 2011Q1.
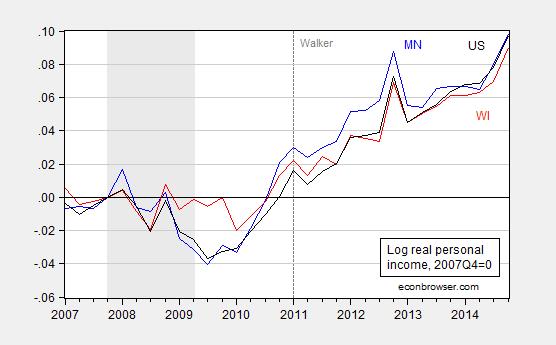
Figure 4: Log real personal income for Minnesota (blue), Wisconsin (red), United States (black), in Chained dollars, normalized to 2007Q4=0. Deflation using CPI-RS. NBER defined recession dates shaded gray. Source: BLS, NBER, and author’s calculations.
We do have a new experimental real GSP series with which to do comparisons of output at the state level. Unfortunately, these series extend only up to 2013Q4. In any case, Minnesota, Wisconsin and the US series are depicted in Figure 5 (normalized to 2007Q4).
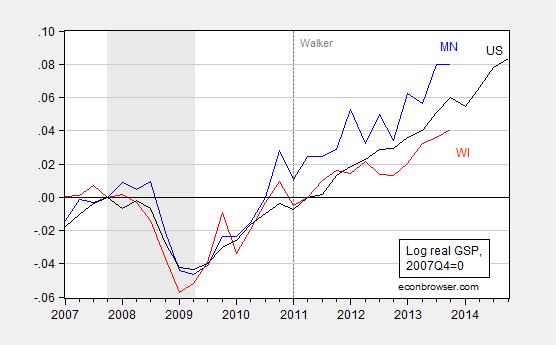
Figure 5: Log real Gross State Product (GSP) for Minnesota (blue), Wisconsin (red), United States (black), in Chained 2009 dollars, normalized to 2007Q4=0. NBER defined recession dates shaded gray. Source: BEA, NBER, and author’s calculations.
Since 2011Q1 to 2013Q4, US real output growth has exceeded that of Wisconsin by a cumulative 2% (log terms).
Finally, median household income has increased in Wisconsin, going into 2013. But before that (2011-2013), it was flat. In contrast, in Wisconsin’s neighbor Minnesota, median income jumped in 2011. While it decreased in 2013, the MN-WI gap was still +3500 2013$ larger than in 2010.
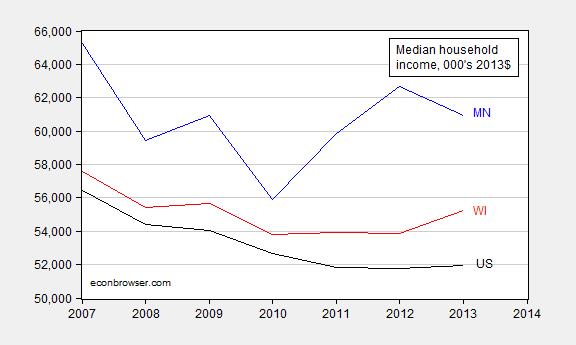
Figure 6: Log real household median income for Minnesota (blue), Wisconsin (red), United States (black), in Chained 2013 dollars. Note: data not strictly comparable over years. Source: Bureau of the Census via FRED, NBER, and author’s calculations.
Updated, 8/16:
Finally, here I plot the American Community Survey (ACS) series for Minnesota, Wisconsin and US, which are not subject to the same problem of intertemporal comparability as the BuCensus figures (cited for instance here), and are estimated with greater precision due to larger sample sizes.
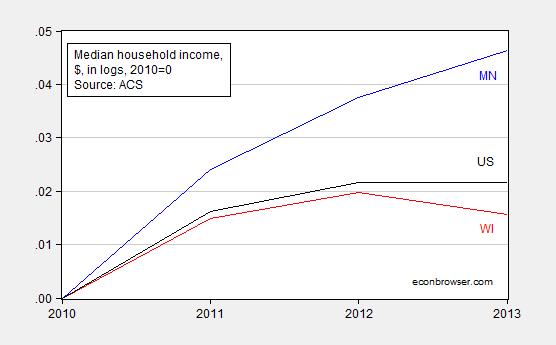
Figure 6(revised): Median household income for Minnesota (blue), Wisconsin (red), and US (black). A reading of 0.045 means that the value is 4.5% higher than it was in 2010. Source: American Community Survey/Census Bureau, and author’s calculations.
In these comparisons, I have only contrasted with Minnesota and the Nation as a whole. Comparisons with Wisconsin’s geographic neighbors can be found here.
Update, 5/14 4pm Pacific: For more on the Wisconsin-Minnesota comparison, see this excellent survey by Ann Markusen in the American Prospect, entitled “The High Road Wins”. A more extensive analysis is here.
It would be interesting to see the border communities data.
But what has happen to Minnesota and Wisconsin since 2013 when each Governor passed their signature tax policy. Minnesota increased taxes and Wisconsin reduced taxes. I refer below to FRED graphs normalized to Jan. 1, 2013 along with US statistics as reference. These graphs use the same data as the figures in Menzie’s post which I follow. I will limit my post to the first 3 figures, but I would expect Menzie to post the subsequent figures normalized to 2013-01-01
Figure 1, coincidence indices.
“Coincidence Index, normalized to 2013-01-01”
Wisconsin up 6.9%
Minnesota up 6.3%
US up 7%
Figure 2, nonfarm payroll employment
“Nonfarm payroll employment normalized to 2013-01-01”
Wisconsin up 103.6%
Minnesota up 103.1%
US up 104.3%
Figure 3, Unemployment rates
“Uemployment Rate normalized to 2013=01-01”
Wisconsin reduced 66.7% Jan. 1, 2013
Minnesota reduced 72.2% from Jan. 1, 2013
US reduced 68.8% from Jan. 1, 2013
In each of these categories, Wisconsin has outpaced Minnesota since the major tax changes.
Ed
See if these two links are better.
Figure 2, nonfarm payroll employment
“Nonfarm payroll employment normalized to 2013-01-01”
Figure 3, Unemployment rates
“Uemployment Rate normalized to 2013=01-01”
Ed
Ed Hanson: I have a feeling of deja vu. The reason to normalize on 2011M01 is that Governor Walker’s spending policies have had arguably a bigger (contractionary) impact on output and employment than tax policies (although I allow that his tax policies have had a larger [negative] impact on the budget deficit via tax revenues than spending measures).
I cannot escape the impression that you are merely moving the goalposts by trying to normalize to 2013M01, especially after I noted that previous suggestions of a Wisconsin catch-up that you saw were “benchmarked” away (by the way, I did not see a response to that comment of mine). I should also note that Act 10 was in place by 2011, and had impacts on employment, output, and confidence much earlier than 2013M01.
Anyway, keep on trying.
Menzie,
You’ll never convince us lunatic right wingers who simply do not believe (that much, if not most of) government spending adds sustainable economic value.
Menzie
I am not surprised that you consider government spending policy as supreme. It is the socialist mantra.
I believe it is supreme that those who work deserve the use of their production in the manner of their liking. When the individual is allowed more choice of how, when and where their wealth is spent, saved and invested; a greater economic outcome for everyone, the individual, the stranger, the state and and nation at large achieved.
Hayek was right when he expressed the idea millions and billions of individual decisions create economic outcomes greater than is created by a few, no matter how smart and educated they may be. The greater the choices of those who earn the resources left in the hands of the many, the better the results, including liberty.
Incentives matter. When a state like Minnesota imposes a tax burden of greater than 50% on income (state and Federal) on some, it results, over time, that economic growth suffers. Those who can will leave either physically or at least shelter their investment elsewhere. But that is not all, many on the margin will just choose not to take the risk of that next investment, it just is not worth the effort to allow some one else (the state) to reap the majority of the benefit.
I was serious when I ask you to provide graphs normalized to Jan 1, 2013 for those figures I did not. It would help to provide addition insight of whether more spending by the individual or the state produces greater outcomes. Admittedly this is a small example, but interesting that even a high tax and spending state like Wisconsin, by reducing taxes and regulation, can show moderate gains compare to nearby high tax and regulation state that choose the opposite direction. Returning the rights of the individual to direct more of earned wealth is no quick fix, but a long term proven policy.
I will now remind you of often quoted passages. President Reagan was fond of quoting Ibn Kaldur, ““In the beginning of the empire, tax rates were low AND the revenue was high” “At the end of the empire, tax rates were high AND the revenue was low.” When power of spending are placed in the hands of the few, empires collapse. Margaret Thacher put it a different way, “The problem with socialism is that you eventually run out of other people’s money.” These statements are historically true, will remain so for the future, no matter how good the intentions, how smart the leaders, how great they are educated. Centralized decision making creates disaster.
Ed
Hayek was wrong.
Everyone on the left that I know says Hayek was right! LOL!
We do? OK well maybe not literally “everyone” but who?
Ed. What is your definition of socialism?
Your response is too academic and your idea of socialism is totally false, Minnesota is in no way socialist and to keep using the examples you use is just as false.
Can you adjust these to add the expansionary effect Wisconsin would have if they cut their taxes to underfund it’s pensions like Minnesota does?
Menzie: It seems that post-recession, MN was fortunate enough to have better than average population growth coupled with better than average labor productivity growth. On the other hand, WI’s lower economic performance can be traced in part to its lower than average population growth, which was slightly offset by better than average labor productivity growth. I find it hard to attribute the lower populatuon growth to any specific fiscal policy. In short, nothing to see here. By the way, still waiting for that post on whether or not we will reach 1M new manufacturing jobs by 2016. Can we get an ETA on that?
Jeff: Well, then let’s look at real GSP per capita. Oh, gee, I did that back in August of last year, in this post. It appears MN GSP per capita was a cumulative 1.3% (log terms) higher than WI, from 2011Q1 onward. That was as of 2013Q4. I don’t think there’s any reason to believe in any substantive changes in that gap since then.
Try again.
On manufacturing, a forecast of 1 million additional jobs by 2016M02 (relative to trough in 2010M03) is consistent with an ARI(1,1) estimated on log employment over the 2010M03-2015M04 period (as of April, we are 869,000 above trough). Now, since the dollar has strengthened, I’d say a bit later is likely. But I don’t know why you think this is such a crazy goal (unlike the 250,000 new jobs promise that Governor Walker re-committed to in August 2013 — nobody thought that was likely!).
Jeff wrote: “I find it hard to attribute the lower populatuon growth to any specific fiscal policy.”
Hmm. Fiscal cuts equal job cuts equal people moving away to find jobs.
Nah, that’s just too crazy.
I will only add that Walker’s claims were for EXPANSIONARY austerity. If you cut spending, then the economy will grow faster. Some of the graphs show decline, some show Walker holding onto a trend that he inherited But no graph shows improvement. There is no “expansion” at all.
And that matters because austerity always brings social pain. There has to be a cost-benefit analysis done, and since there is no improvement there is no benefit to offset the costs. Cutting services hurts people. It can only be justified if there is a greater benefit that comes along with the pain. Since we see no improvement, we see no benefit, and therefore, this fails the cost-benefit analysis.
Unless, of course, you change the analysis to the benefit of societal sub-groups at the expense of other groups, and there you may see some group benefitting from austerity, such as the affluent. But, in a democracy you cannot win elections arguing for policies that benefit only a small elite group, so you are left with false claims like expansionary austerity to achieve your goals.
Menzie: Your hypocrisy is limitless! You want to start the clock on Walker’s promise at his inauguration but Obama’s promise at the trough instead of his (2nd) inauguration, basically giving him an 2 year head start?! If you correctly start the clock in 2013 you’ll see why I think it’s an unrealistic goal. Spoiler alert: It is because it is unrealistic. But I can’t wait to see how you contort the facts into it is “entirely possible.”
Regarding MN vs WI and your belief that “nothing “substanitive” happened since 2013, let me catch you up. WI coincidence index outpaced MN by almost 1% since then and MN population continued to outpace WI, which should bring your 1.3% per capita difference down to statistical noise. Like I said nothing to see here.
Jeff: Regarding developments in 2014: relative to 2010, MN per capita output was 1.3% larger than WI in 2013, and 0.9% larger in 2014 (coincident index divided by population).
Jeff: I cannot replicate your 1% outpacing of MN by WI. I regress the first difference of the log of the ratio COINMN/COINWI, multiplied by 12, against a constant, over the 2014M01-2015M03 period. I obtain a point estimate of -0.005, not statistically significantly different from zero. That means, over the last 15 months, WI outpaced MN by a half percentage point (annualized). How did you get 1%.
ottnot: Since 2011 WI lost about 4K gov’t jobs. If you assume that 100% of those people moved away that would account for less than 0.1% of the population. So…yeah it is crazy.
Jeff: Sorry, my mistake, I didn’t check that the timing was to accord with the second term. As of 2015M04, we are 361,000 toward 1 million. Using the same equation I used before, the point estimate is for 665,000, some 335,000 short. The forecast plus 2 standard errors encompasses +872,000, so it’s unlikely that +1 million will be achieved in the second term alone.
By the way, it’s a goal that Obama makes in his State of the Union (read the text!). It’s a promise that Governor Walker made (and recommitted to in 2013).