Economic activity stalls, and the Republicans conclude that higher taxes are necessary for higher tax revenue.
[with update 6/2 on the April forecast]
Figure 1 depicts log coincident indices for Minnesota, Wisconsin, California, Kansas, and the US, as compared to 2011M01, when Governors Walker and Brownback took office.
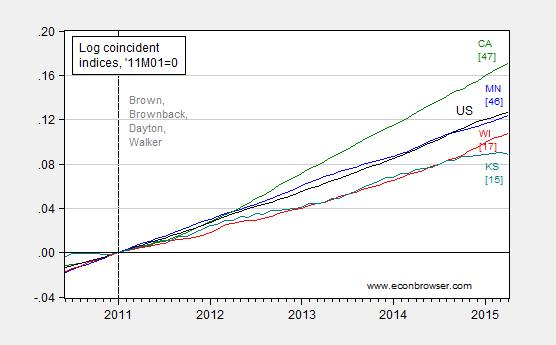
Figure 1: Log coincident indices for Minnesota (blue), Wisconsin (red), California (green), Kansas (teal), and the US (black), normalized to 2011M01=0. ALEC-Laffer Rich States, Poor States, 2014 rankings in brackets. Source: Philadelphia Fed (April release), RSPS 2014, and author’s calculations.
Three month growth in Kansas has flattened (-0.08%, annualized, in logs), and in fact the (preliminary) m/m annualized growth rate for Kansas is -2.4%. This is in sharp contrast to the other states in the graph, including Wisconsin which itself has lagged relative to the US and Minnesota, and lagged relative to what historical correlations up to 2010 would have indicated (and statistically significantly so). In other words, “wow!”.
Figure 2 depicts the March and April releases of the Kansas indices. Notice the recent downward revision. That is, more recent data is not improving the outlook.
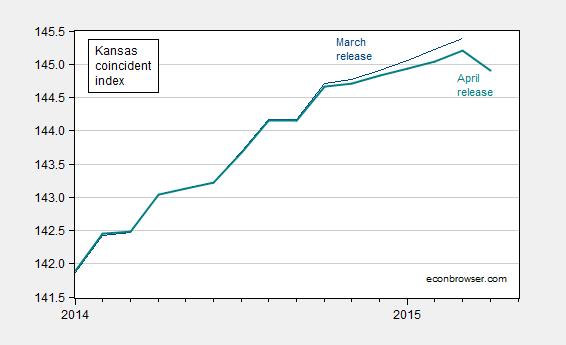
Figure 2: Coincident index for Kansas, March release (dark blue), April release (bold teal). Source: Philadelphia Fed.
The March release of the Philadelphia Fed’s leading indices projected 0.6% growth over the next six months (non-annualized). Given the fact that the leading indices are based on time series models of the coincident, my guess is for a downgrade in the April release (on June 2).
More data on Kansas, from the Kansas City Fed.
On the budget side, the situation has deteriorated as well, going from bad to worse. The $400 million gap that is widely cited in the media is actually likely an understatement. As noted by Goossen at Kansas Budget blog, the $400 million presupposes a set of short-term fixes in the form of transfers. Closing the $400 million gap by “…by increasing the state sales tax to 6.65 percent from 6.15 percent and eliminating most income tax deductions” [Foxnews] would leave only $81 million in reserve, when state law requires an end-year balance of $500 million.
For more on the budget situation, see Eligon/NYT. I think there will be a lot more “whistling” going on soon.
Update, 5/31 1:00pm: A graphic depiction of the revenue collapse is shown in Figure 3.
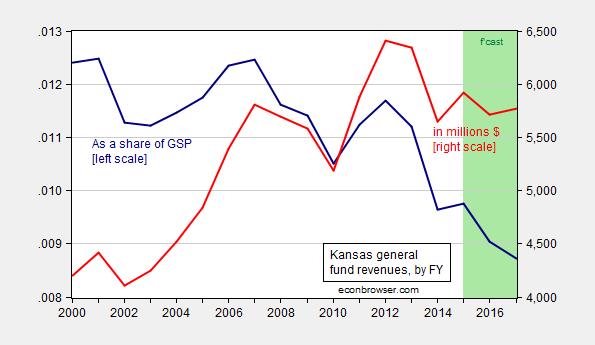
Figure 3: Kansas general fund revenues as a ratio of gross state product (GSP) (dark blue, left scale), in millions of $ (red, right scale), both by fiscal year (July-June). Note FY GSP calculated as average of calendar year GSP. 2014-2017 GSP from estimates by consensus group. Green shaded area denotes forecasts from April estimates. Source: April 2015 Consensus Revenue Estimates, BEA via FRED, and author’s calculations.
Notice the collapse in revenues as a share of GSP is on-going, according to the government, despite the (forecasted) revenue stabilization in dollar terms.
Update, 6/2: The Kansas crash apparently continues. Philadelphia Fed leading indices (released today) forecast essentially zero growth over the next six months. Figure 4 (updated Figure 2, including forecasts) presents the outlook, as of March and as of April releases.
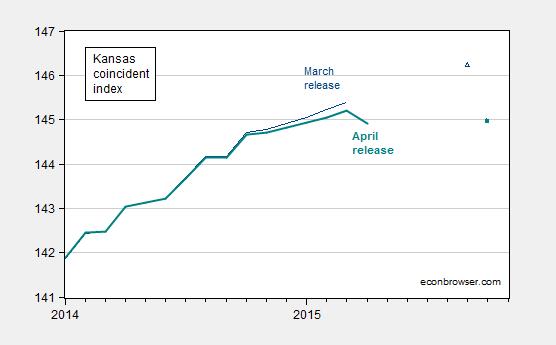
Figure 4: Coincident index for Kansas, March release (dark blue), April release (bold teal). Dark blue triangle (solid teal box) denote corresponding forecasts from March and April releases of leading indices. Source: Philadelphia Fed (coincident), Philadelphia Fed (leading), and author’s calculations.
In other words, the outlook is pretty dismal for Kansas.
Whut? No comments? I was looking forward to those that accuse Menzie of mis-labeling the top graph and substituting CA for KS.
Commenters! Help me out. I am getting bored waiting till time to feed the horses.
George H.W. Bush was correct when he labeled the panacea of tax cuts as ‘voodoo economics’. Thanks to Governors Brownback (KS)and Walker (WI), there might be more people now who believe in actual voodoo than believe that cuts produce revenue.
Given the Kansas economy is near full employment, with a 68.0% labor force participation rate and a 4.3% unemployment rate (compared to 62.8% and 5.5% for the U.S.), taxes should rise to slow the expansion.
And, a stronger U.S. economy may lift the Kansas economy.
Unemployment rate for April 2015
MINNESOTA 3.7
KANSAS 4.3
WISCONSIN 4.4
United States 5.4
CALIFORNIA 6.3
Richard A.: Did you know that on average, the Kansas unemployment rate is 1.7 percentage points below the US rate? Currently, the Kansas unemployment rate is 1.1 percentage points below the US rate. Since the HAC standard error associated with the 1.7 ppt point estimate is 0.12, the Kansas unemployment rate is actually higher than typical — and statistically significantly so.
People should really learn a little basic statistics before …citing statistics.
For more of this, applied to Wisconsin, see this post.
Kansas’ historically low unemployment is directly related to it’s stripped down social safety net, but not from a pie in the sky effect of business growth. It’s because the state lacks the social infrastructure to attract and retain the unemployed. Spend any time talking to business owners in Kansas and you’ll hear the familiar refrain that they cannot find employees to fill the job openings.
The stat leaders should be spending more time catering to the very people they despise if they really want to stimulate growth.
The point I was trying to make is that states with a lower unemployment rate don’t have the same capacity to expand as states with high unemployment do. Here is a graph of the unemployment rate of the four states and the US going back to 1990:
http://tinyurl.com/pvysurg
Richard A.: If inter-state labor mobility was low (e.g., Euro area), I would agree. But it’s not…
Anyway, as I calculated, KS unemployment is a bit higher than the norm, indicating slack in the economy.
Prior to the Great Recession, the last prolonged period of time Kansas had an unemployment rate as low as its current rate was from the period September 2006 to April 2008. During the same period the U.S. unemployment rate ranged from 4.4% to 5.1%. (These data are readily available on FRED.) This was hardly a 1.7 percentage point differential in the U.S. and Kansas unemployment rates; in all of those months from September 2006 to April 2008, the differential was far lower than the current differential of 1.1 percentage points.
You left out a key stat in those unemployment numbers, Richard.
Change in labor force last 12 months.
CALIFORNIA +210,200 (+1.12%)
MINNESOTA +57,700 (+1.94%)
WISCONSIN +10,700 (+0.35%)
KANSAS +2,700 (+0.18%)
The only reason Wisconsin and Kansas are seeing such low unemployment is that PEOPLE AREN’T COMING THERE, while California and Minnesota are seeing strong growth in both labor force and jobs. This also explains how Kansass and Wisconsin can have such low unemployment and have stagnant revenues and job growth.
People with a brain don’t give credit to someone for presiding over an empire of dirt, but that definitely seems to be part of the idea in these states run by these right-wing wackadoodles.
Unemployment rate for April 2015
MINNESOTA 3.7%
KANSAS 4.3%
WISCONSIN 4.4%
United States 5.4%
CALIFORNIA 6.3%
Kansas is in part an oil and gas state, so we would expect the oil downturn to ding the economy there. That factor should turn around in the next three months.
Otherwise, we could see the revenue / spend mismatch a long way off. So no surprise in the need to rebalance.
Maybe dumb question: Why is revenue over GSP the more significant statistic in the last graph? If revenue is stable but revenue over GSP is decreasing, that sounds on its face like an arguably good state of affairs (ignoring all other relevant info). Are state expenditures tied directly to GSP?
Pain versus gain, just keep hammering this point. Does the growth offset the losses? In WI and KS, no, absolutely not, not even close, because there is no growth.
Kansas employment numbers are meaningless without knowing : The number of people permanently departing Kansas, the number of residents receiving Social Security because they could not get a job, the percentage of Kansas college graduates receiving job offers in Kansas. In Kansas we know per capita income is now almost as high as in 2005.