Some individuals have questioned the accuracy of the Philadelphia Fed coincident indices as measures of economic activity. Recently released Gross State Product (GSP) data confirms the pattern previously identified: Wisconsin lags the Nation, and its neighbor Minnesota. Thank goodness for Kansas to make Wisconsin look good!
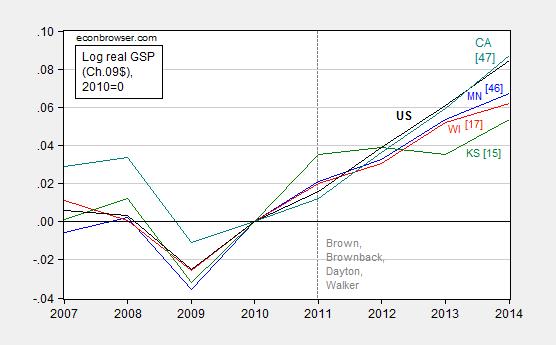
Figure 1: Log Gross State Product for Minnesota (blue), Wisconsin (red), Kansas (green), California (teal), and United States (black), all normalized to 2010=0. 2014 figures are advance. Numbers in [square brackets] are ALEC-Laffer rankings from Rich States, Poor States, 2014. Vertical dashed line at beginning of Brown, Brownback, Dayton and Walker administrations. Source: BEA, ALEC RSPS 2014, and author’s calculations.
Update, 10pm Pacific: Ironman argues I have committed two offenses: (1) using Philadelphia Fed coincident indices to compare economic activity, and (2) not incorporating weather, for Kansas. On (1), I now use GSP. On (2), I estimate an ECM(1) with the Palmer Drought Severity Index (PDSI) for Kansas in the short run dynamics, using quarterly GSP 2005-10. I then estimate out-of-sample in an ex post simulation.
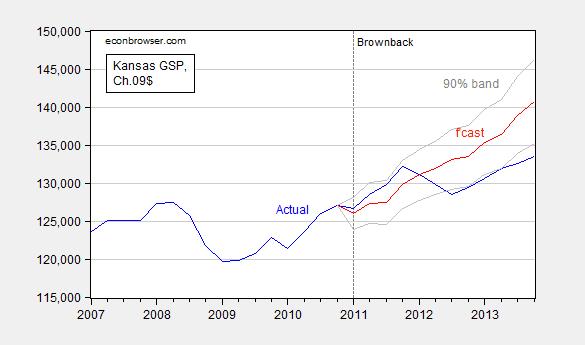
Figure 2: Real Gross State Product for Kansas (blue), out-of-sample dynamic forecast (ex post) from ECM (Kansas GSP, US GDP) with one lag of first differences and contemporaneous first difference of Kansas PDSI, over 2005-10 period (red), and 90% confidence band (gray lines). Source: BEA, NOAA.
Even taking into account the drought, Kansas is doing poorly relative to counterfactual (and statistically significantly so).
Update, 6/18 11am Pacific: Headline from print version of Wisconsin State Journal today: “2 Walker pledges fall short”. Online article here.
Wisconsin’s private-sector job growth during Gov. Scott Walker’s first term lagged all other Midwestern states and ranked 35th overall, according to figures released Wednesday by the U.S. Bureau of Labor Statistics.
The state had 131,515 more private-sector jobs in 2014 than in 2010, or 52.6 percent of the 250,000 jobs that Walker promised to create during his first term.
That represented a 5.9 percent increase, compared with 8.8 percent private-sector job growth nationwide.
The data also show Wisconsin had 9,463 more business establishments in 2014 than in 2010, or more than 500 short of Walker’s campaign pledge to create 10,000 businesses in his first term. The business growth rate of 6.4 percent ranked 10th nationally and outpaced the national average of 4.4 percent.
Ironman asserts that sequential shocks to agriculture and aircraft explain Kansas’s sub-par (I’m being generous here) economic performance. A decomposition of GSP indicates that — yet again — Ironman‘s assertions cannot be substantiated.
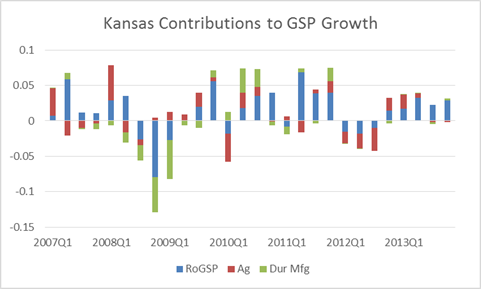
Figure 3: Contributions to annualized real GSP growth, from rest of agriculture (red), durable manufacturing (green) and rest-of-GSP (blue). Source: BEA, and author’s calculations.
Notice that while agriculture does subtract from GSP in an accounting sense in 2012, it pretty much compensates in 2013. On the other hand, durable manufacturing (where aircraft production would be) doesn’t show up as an important contributor to changes in the growth rate of GSP.
Talk about specious analysis! As someone who has previously duplicated your kind of analysis, I’ll be happy to point out its principal flaw. What you’re effectively doing with the comparisons is creating a ranking between different states with very different economies – the kind that folks at the Philly Fed have flat out stated is not valid. Apples do not equal oranges, even if both are kind of round! If you want to create a more effective analysis using the Philly Fed’s data, you need to track the individual state’s performance over time – where it might be used to support an event analysis. But then, you would have to present a lot more information regarding the political and economic context of the state’s environment, which is something else your series of analysis has lacked to date.
Separately, looking at the situation of Kansas, back in 2013, the Philly Fed issued a report that reveals that there’s actually a negative correlation between a state’s GDP and its coincident indices if they have a high proportion of agriculture or mining industry within their economies. There’s nothing specious about it – it is a known factor that limits the effectiveness of the state coincident indices and analyses that disregard it do so at great risk of being quickly discredited as junk science.
If you were to do a proper event analysis, you’ll find that that odd trajectory you see for Kansas has a lot more to due with the severe drought the state had in 2012, which was followed by an especially bad year for aircraft manufacturing and also oil and coal product manufacturing in 2013, than anything done in its statehouse. These are things that very clearly show up in the state-level GDP data that the BEA publishes.
Really, the main issue with Kansas’ tax cuts is that they were overly ambitious and not matched by spending growth restraint – the strategy that North Carolina has been using with a considerably greater measure of success. Governor Brownback’s tax cuts combined with a lack of spending restraint in Kansas to create a rather large fiscal problem for the state government, but one that’s mostly limited to the state government and the state’s local governments, but you would never know it from looking at how that spending has been increasing in recent years in the state level GDP data.
That’s simply poor and irresponsible management, which caused problems very similar to the kind of problems that a lot of public universities have developed, where the unchecked bloating of administrative staffs in recent years requires similar adjustments. I think you’ll agree that cutting the ranks of the bloated administrate staffs at universities is far preferable to hiking student tuition bills – both of which can be easily avoided with spending growth restraint and responsible management.
Ironman: Thank you for your amusing dance. First, the Philadelphia Fed says not to rank, but does not say — as you assert — that their reasoning is that it’s like comparing apples and oranges. In fact, they don’t say why you shouldn’t compare them.
Second, as I noted in our previous exchange, your argument that lots of agriculture and mining invalidates the use of the coincident indices for Kansas is — just plain wrong!!!. To quote:
Since you did not respond to this last time, I assumed you accepted your mistake. But perhaps you have a counter-argument. In that case, I look forward with bated breath for my next laugh (or you could demand I report everything in nominal terms — that would be fun).
Also, this: “Wisconsin ranks 35th in U.S. for job creation over Walker’s first term.” http://www.jsonline.com/business/wisconsin-ranks-35th-in-us-for-job-creation-over-walkers-first-term-b99520739z1-307884841.html
I have to agree with your critics that you have selectively omitted important information in your vain attempt to prove that Walker, by starving grannies and school kids, has not produced an economic sonic boom with a shockwave he can ride right into the White House.
It is well known that two of the important characters in the mega-blockbuster movie, Jurassic World, live in the Madison area. You can imagine the depressing effect on economic activity in the state when hundreds of thousands of Badger State residents huddle around weak cups of tea (with thrice-used teabags) to share excited speculation about the film and the roles to be played by fellow Badgers. A fourth Jurassic Park movie had been in various stages of rumor and development for about 10 years, but it was only a few months after Walker took office in 2011 that Spielberg told attendees of the 2011 Comic-Con that the movie would be out in 2-3 years. Obviously, the delays in development have led to an extended period of this exogenous negative factor in Wisconsin’s economic growth, and you, sir, have the gall to treat your readers like idiots who would believe you when you blame the negative effects on Walker. Dream on.
I don’t need to mention what you have left out of the Kansas analysis, do I? Okay, just one little hint : it rhymes with “fluten-free”, and it is an obvious conspiracy by coastal liberals (liberals think everything should be free) to punish the hard-working, sensible conservatives of the midwestern states. Brownback survived the political assassination attempt and has taken his Kansas economic boom underground, where liberals can’t find it and wreck it.
Wow, Wisconsin is doing badly, but what happened to Minnesota? Or maybe I’m reading the labels incorrectly which seem to show Minnesota on a similiar (if slightly higher) trajectory as Wisconsin. What is the blue line versus the black line?
Never mind. Just found the legend. But that still raises the question on why Minnesota is so far below the U.S. line when so many other data indicate it is doing so well.
Professor Chinn,
Would you provide a bit more on your ECM model and related equations? I can find a monthly PDSI, but not a quarterly index. Did you average the months by quarter? What is the ECM in reference to, a cointegration model between Kansas SDI and the PDSI? A little help is appreciated here to lower the ignorance index.
AS: I did the estimation quickly, so documentation not as thorough as usual. Under deadline, so I’ll post over the weekend details.
ECM is Kansas GSP and US GDP; Kansas PDSI is included in short run dynamics as first difference (contemporaneous). The quarterly PDSI is the average of the monthly PDSI.
Professsor Chinn,
Thank you. I appreciate learning from you.
Professor Chinn,
I notice that if I use the do a unit root test on the residuals of the regression of Kansas SGP and the US GDP for 2005 q1 to 2011 q1, the results point to a unit root for all three choices(given the critical value table I have), although, I thought I should use the choice with an intercept & no trend, since the original regression equation has an intercept. As I say the ignorance index is high and in need of lowering this weekend.