Re-visiting Mitt Romney’s “We should be seeing numbers in the 500,000 jobs created per month.” [1]
Well, it’s clear 500,000/month is not the norm. Figure 1 presents employment growth (in logs) relative to trough in the last four recoveries. I have included a trend line implied by the 500,000/mo normalized by nonfarm payroll employment in May 2012 (when Governor Romney made the comment).
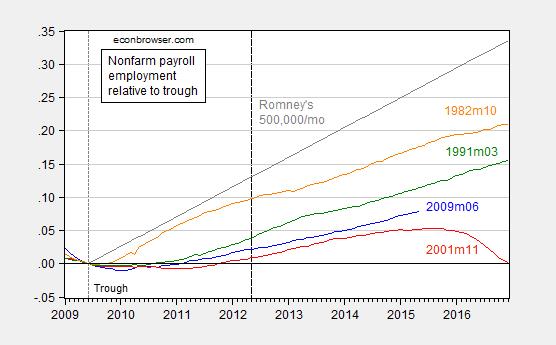
Figure 1: Log nonfarm payroll employment relative to 2009M06 trough (blue), to 2001M11 trough (red), to 1991M03 trough (green), 1982M10 trough (orange). Long dashed line at 2012M05 at the time of Governor Romney’s remarks. Source: BLS, May 2015 release, and author’s calculations.
The interesting point is that one has to go back three decades, and three recoveries, to get any numbers that are close to 500,000.
This leaves open the question of what is the expected pace of job creation. That in turn depends upon at the very minimum on (1) the pace economic activity generally, e.g., GDP growth, and (2) the labor intensity of GDP. Since GDP growth lower in the 1991 and 2001 recoveries than the in the preceding, slower employment growth seems a given, even if the employment/GDP ratio were constant (which it isn’t).
Some people will object that the preceding graph does not condition on the depth of the recession. This point is correct, but not a critique per se. The graph also does not condition on the labor intensity of output, nor any of the other determinants of GDP growth, such as financial crisis, or deleveraging. These points have been highlighted by Reinhart and Rogoff (discussed here).
We could have had a stronger recovery after the 2007-09 recession, i.e. a U-shaped recovery rather than an L-shaped recovery.
However, in the Reagan V-shaped recovery, there was pent-up demand, a wall of private saving (from high interest rates and inflation), little government debt, along with a more balanced budget (Carter was a fiscal conservative), and 80 million Baby-Boomers (born between 1946-64) entering “prime-age” (35-54).
In the Obama recovery, we had diminished marginal utility, high household debt, high government debt, along with budget deficits, and the Baby-Boomers leaving prime-age.
Menzie, may I suggest a more accurate way to look at labor recoveries is by measuring aggregate hours rather than aggregate payrolls. For example, our current recovery is much stronger in terms of aggregate hours worked vs. number of jobs created.
Going even further, perhaps the most accurate measure of a labor market recovery is to use a “lump of labor” approach, I.e., aggregate real wages: ( average hourly earnings x average hours worked x payrolls ) / cpi or pce. All of a sudden the 1980s recovery and the current recovery look close to equal.
I have now created the “lump of labor” graphs at FRED. This is increase in aggregate real wages (average hours wages x average hours worked x payrolls) / inflation) paid from the bottom of each of the last 4 recessions, out 5 years 11 months into the recovery:
1982: +21.0%
https://research.stlouisfed.org/fred2/graph/?g=1eEk
1991: +16.4%
https://research.stlouisfed.org/fred2/graph/?g=1eEz
2001: +10.1%
https://research.stlouisfed.org/fred2/graph/?g=1eEY
2009: +18.8%
https://research.stlouisfed.org/fred2/graph/?g=1eDV
Quite a different, and I believe more complete, measure than simply comparing payrolls. After all, people don’t work for the mere sake of having a job, or having hours, but rather the cold hard cash they are bringing home. By that measure, this recovery is pretty good.
Actually, a pretty interesting way to think about the labor market.
The post was written in a dismissive style. I think a more honest and informative post would have been Romney claimed that job growth should have been 500,000 jobs. This view is not far from the truth once you condition on the size of the recession and the size of the labor market. However, he was missing one important thing that this was not an ordinary recession, but a financial crisis. You could then have spent some time explaining Rogoff and why financial crises are different.
That being said I only view Rogoff’s work as suggestive. I never completely bought his ex post identification. Probably the slow growth is both Rogoff’s reason and less effective monetary policy because of the ZLB. There is the policy uncertainty angle, but personally that argument seems more akin to story telling than science.
Chuck: If your interpretation is correct, then why did he subsequently change the figure to 250,000/mo?
As I noted in the post, you have to go back some 40 years from the time he made the statement to get the rate of change be the norm even adjusting by level of employment. Using that criterion, I guess I could tell you my time for the 100 yard dash is pretty good!
The claim was just wrong, Chuck.
A target of 500,000 new hires per month is ambitious, but supportable. You can see it in the historical JOLTS data.
A target of maybe 325,000 net new jobs per month is the maximum one might float, and there’s nothing shy about that. It’s not common for the US to gain more than 3 million jobs in a year, which is 250k / month. We’ve been running a bit hotter than that lately.
On the other hand, that a politician should over-promise, well, I am shocked, shocked that such a thing could happen! Well, at least we’ve closed Guantanamo, created government transparency and bipartisanship, and gotten out of Iraq!
chuck, i would disagree with your categorizing the post as dismissive. romney made a claim, a rather strong statement that was meant to be derogatory towards obama. but the statement was wrong, very clearly wrong. either romney was intentionally providing an incorrect assessment of the economy, or ignorant of the economic conditions at the time. neither choice paints him as a desirable president. the real question is, in real time, the comments by romney were known to be incorrect. why was he not held accountable for this statement? the bigger problem is when incorrect statements from leading political candidates become accepted as truth by the electorate. it becomes hard to root out those falsehoods once they are embedded in popular culture (or news culture). and you will find those statements repeated as fact years later by blog commentators.
Employment-Population Ratio
http://data.bls.gov/timeseries/LNS12300000
Labor Force Participation Rate
http://data.bls.gov/timeseries/LNS11300000
Both had reached their all-time record highs in 2000 — and both have been in decline ever since:
Number of jobs created and lost that year (2000)
Jan … 231,000
Feb … 130,000
Mar … 467,000
Apr … 287,000
May … 226,000
June … -47,000
July … 179,000
Aug … -15,000
Sept … 135,000
Oct … -15,000
Nov … 225,000
Dec … 142,000
http://data.bls.gov/timeseries/CES0000000001
They have been declining because the total labor force stopped growing. In the 1980’s it was growing 3%. You ought to look at them between 1948-64. It has made some people get a bit uncomfy about their biases. These data sets have gone through several changes and demographic periods over the years. I think one year NFP averaged 152,000 during the height of the Korean War boom………lol.
Put it this way, what if the Boomers had the same cohort births in numbers they themselves had as a cohort? My guess the LFPR and EPR would be close to the 2000 “peak”. In terms of recovery, this has been a 1990’s redux from a deeper contraction. It is just over the last couple quarters we have moved to the mirky area between bust and boom.