Given worries regarding an imminent slowdown in the wake of the stock market decline, it’s of interest to see what the term premium is signalling.
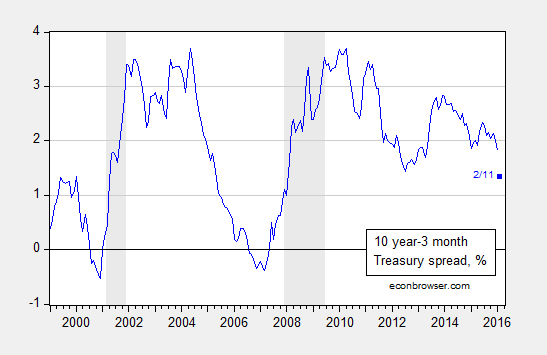
Figure 1: Ten year minus three month Treasury yield spread, % (blue). February observation is for 11 February. NBER defined recession dates shaded gray. Source: FRB via FRED, NBER, and author’s calculations.
Estimating a standard probit model for recessions based on one year lagged term spread over the 1986-2015 period (encompassing the “Great Moderation”) yields:
Prob(recession=1)t = -0.142 – 0.871×spreadt-12 + ut
McFadden-R2 = 0.30. NObs = 360.
[figures edited 2/13 12:45am, to add 2015M02-2015M12 observations]
Where bold denotes significance at 1% msl, using Huber-White standard errors. Using a 20% threshold, the model predicts recession dates correctly 78% of the time, and no recession dates 85% of the time.
The spread on 11 February was 1.35 percentage points. Putting this into the estimated equation yields a value of -1.32, implying a 9.3% probability of a recession within the next year. This is a slightly different probability than that reported in this post due to the flattening of the yield curve since January 11th, and a slightly different sample period (the previous used 1970-2013).
Professor Chinn,
Are you using zeros or NA for the NBER recession index past the June 2014 last entry by NBER of June 2014? I am trying to match your data am having trouble getting the same results as you did. My coefficient on the spread is close at -0.84, but my constant is different at 0-.26, using data from 1986m01 to 2015m12 and a T10Y3m(-12) entry.
AS: I realize now that I had “NA” entries for 2015M03-2015M12. I have set those entries to zero, and re-run the regressions. The new results (only very slightly altered) are now reported. Thanks for catching that.
Also note that when the sample is 1986M01-2015M12, then this includes yield spread from 1985M12.
Professor Chinn,
Using T10Y3M from 1985m12 to 2015m12 shows an output of 361 observations. Also, using the Probit model of: “Recession c T10Y3m(-12)” gives me an output of Prob(recession=1)t = -0.262 – 0.850 x T10Y3M . Evaluating the equation at the February spread of 1.35 percentage points, with recession equal to USRECM and using Norm S Dist I calculate a probability of recession of 7.9%. Thus, I seem to have gone astray.
AS: In EViews set smpl to 1986M01-2015M12. Since the spread is lagged 12 months, then you should end up with 360 observations. In addition, I’m using a manually generated spread, subtracting TB3MS from GS10. Not sure if you are using the same. Then we should get to similar results.
Professor Chinn,
When I switched to using the secondary market 3 month TB data series, my calculations came close to yours at a forecast of 9.5%. Hopefully, I am not making a simple mistake. Perhaps different machines can have slightly different results for non linear calculations?
A learning question about the use of the secondary market data series, rather than using the FRED series of “T10Y3M”: Why use the secondary market data instead of the FRED series?
Thanks
AS: At this short of a horizon, I think the actually reported figures are better than (an estimated) constant maturity. At the ten year horizon, the difference between the on-the-run 10 year and 10 year constant maturity can be more substantial.
Professor Chinn, thank you for an interesting post – in using the yield curve to predict recessions, my rusty recollection was that some years ago Jonathan Wright estimated a yield curve model where he found that adding in the level of the funds rate improved the fit – as an aside, with the funds rate at zero over recent years, do you think it would be worthwhile/valid to use the Wu-Xia shadow policy rate instead in extending the yield curve model? Thanks very much
Kdavies: My recollection agrees with yours — that Wright found the level of the short rate to be important. In my sample which has a much bigger weight on data from the zero lower bound (first, I think I start later than Wright, in 1986, second I have additional data up to 2015M12), the short rate level does not enter with statistical significance. Hence, I didn’t use that specification.
I would be wary of adding in the shadow rate as a level variable and to calculate the spread w/o thinking hard, since the Wu-Xia version of the shadow rate is inferred from the term structure.
Thanks very much