Since we’re talking recession [0], it’s of interest to see what market indicators are saying, for the US and for the world. First, the term spread for the US:
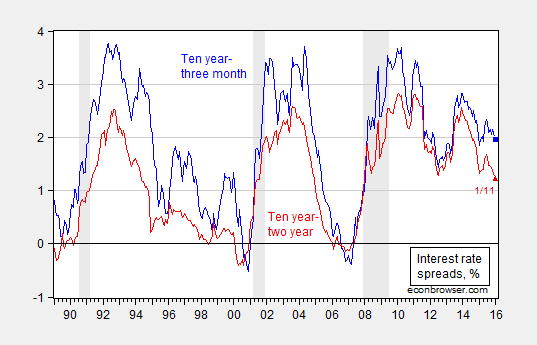
Figure 1: Ten year-three month spread (blue), and ten year-two year spread (red). January observation is for 1/11. NBER defined recession dates shaded gray. Source: Federal Reserve Board via FRED, NBER, and author’s calculations.
The inversion of the yield curve which typically precedes a recession (at least over the post-War era) has not appeared. We can assess the likelihood more formally.
Using the probit regression estimate (equation 3, Table 5) in Chinn-Kucko (2015), one can obtain an estimate of the probability of a recession in the next twelve months.
Prob(Recession=1) = -0.27 -0.69 × spread
Pseudo-R2 = 0.38, NObs = 519, Sample = 1970-2013.
Using the spread value of 1.96 ppts for January 11, the implied probability of recession is 5%.
Some discussion has focused on credit spreads. The Moody’s BAA-Treasury spread and TED spread (for measuring liquidity) is shown in Figure 2.
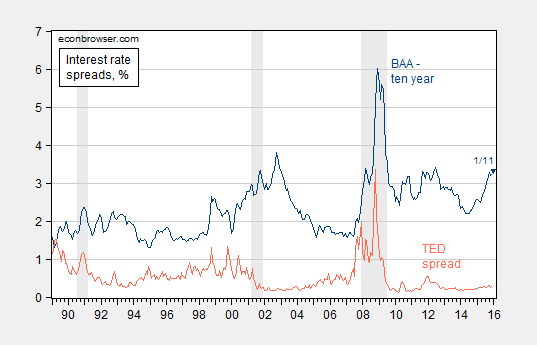
Figure 2: Moody’s BAA corporate bond-ten year Treasury spread (dark blue), and LIBOR-3 month Treasury (TED) spread (orange). January observation is for 1/11. NBER defined recession dates shaded gray. Source: Federal Reserve Board via FRED, NBER, and author’s calculations.
While the BAA-Treasury credit spread is elevated, especially relative to the 1990’s and 2000’s, the spread has been trending upward over time (2.7 bps/year from 1953-2007). In any case, credit spreads are typically considered contemporaneous, rather than leading, indicators of recession.
Finally, what about term spreads around the globe?
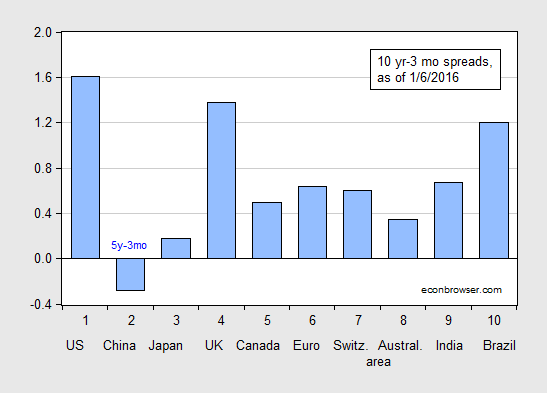
Figure 3: Ten year-three month term spreads, as of 1/6/2016 (blue bar). China observation is Five year-three month term spread. Euro ten year rate is for Germany. Source: Economist January 9th edition, and author’s calculations.
While the predictive power of the term spread is less studied for several of the countries examined, it’s interesting that back in April 2015, several yield curves were near inversion.
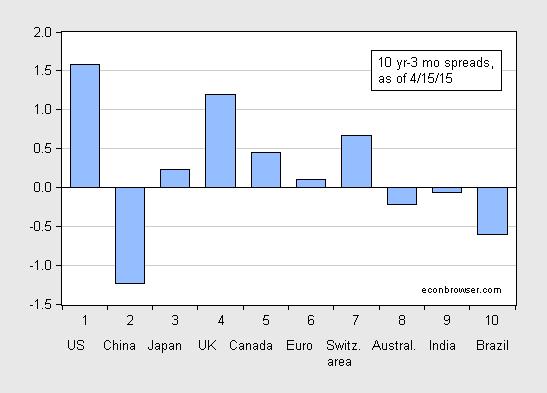
Figure 4: Ten year-three month term spreads, as of 4/15/2015 (blue bar). China observation is Five year-three month term spread. Euro ten year rate is for Germany. Source: Economist April 18th edition, and author’s calculations.
Brazil and Switzerland (which has a positive term spread) are as of latest reported GDP figures experiencing negative growth, while Australia and India appears to have dodged recession thus far. Further note that the yield curve in China was inverted in April, as it is now; but I still am not aware of any literature linking Chinese yield curve inversions to recessions.
Broken record alert: The yield curve does not invert prior to recessions during Schumpeterian depressions and debt-deflationary regimes of the Long Wave Trough as we have been experiencing since 2008 and that which occurred during the 1930s to the early to mid-1950s, 1890s, and 1830s-40s, and in Japan since 1992.
The US is likely in recession, which was not (and will not be) preceded by a yield curve inversion.
The broad equity market is in a bear market and US net wealth is contracting YoY.
Nominal final sales less the deficit has decelerated below 3% in Q4, which historically has ALWAYS been recessionary going back to the 1930s.
The Fed is WAAAAAAY too late to raise the reserve rate, and the Fed will likely be compelled to return to ZIRP, perhaps NIRP, and resume QEternity in 2016 to fund the increasing deficit/GDP in order to prevent further deceleration below 2% for nominal GDP per capita.
Sorry, but your post makes no sense. Broader equity is overrated. Most of its moves came earlier in the expansion much like in the 80’s. Nominal final sales are irrelevant because of the nature of oil prices putting downward pressure on prices. In otherwards, go back to before 1930’s and your head will nod. Not the best effort or post.
The oil bubble’s end is clouding the view and giving poor posts that turn into BC’s error. Deflator says economic boom is nearing.
I think of it as Irving Fisher’s debt deflation Revenge.
Sometime in the next 20 years, some young academic will make a name for themself showing how Modigliani And Miller got it quite wrong and their misbegotten theories contributed to the second great depression by encouraging the world to embrace debt . . . . . . .
Again, oil was a price bubble that had economic consequences. For one, it sapped the US’s ability to recover from the financial crisis much like it made our ability to boom big time in the mid-00’s like we should of. For every bit of extra investment that occurred, the price bubble in oil ate up other investment. That is finally ending. My business is doing its biggest service since 2006 and this time without a ton of debt.
The US economy looks OK to me. Job growth is solid, quits are increasing as a share of separations. Construction is good. We have no immediate bubbles requiring popping. Energy is cheap. Inflation is low.
On paper, we have a recession in 2017, but not this year.
Professor Chinn,
The earliest presentation of the 10 Year, 3 month spread that I could find at FRED starts January 1982. I could not find earlier data for the 3 month constant yield data either at FRED or at the Fed. Using the 1982 data the probability seems of a recession seems to rise to 11% if my calculations are correct. I notice that the spread coefficient however, does not seem to be statistically significant for my data. Any additional education is appreciated. This is the first time I tried a Probit model.
AS: Suggest you download GS10 and TB3MS separately, calculate the spread manually. Using Jan 1982 value of 0.95, I get -0.93 using equation 3, which on a standard Normal table implies 0.176 probability.
I seem to have three technical difficulties. 1) Using data from 1982 to 2015, I get an equation of Prob(Recession =1) = -1.37 + .076 x spread. Using the spread value of 1.96, I get -1.22. which I thought implied an 11% probability of recession. 2) I can’t seem to find 3 month TB constant yield prior to 1982 in order to manually compute the spread. It also seems there is a third difficulty, I see a spread of 1.67 for January of 1982 rather than 0.95. But, I see that a value of -0.93 translates into an implied probability of 0.176 using the Norm. S. Dist Excel function. Thanks for your patience.
AS: I use three month seasoned T-bill yields, see https://research.stlouisfed.org/fred2/series/TB3MS .
Thanks, I meant to ask if it was ok to use the secondary market data.
Wouldn’t it be best to adjust the spreads for term premium or something like that? The problem is with short yields near zero, the curve can’t flatten as much as it can with higher inflation and thus higher short rates. So the signal gets lost using raw spreads.
Exactly. Yield curve meaningless ad a business cycle predictor in a liquidity trap.
Professor Chinn,
After reading your paper more carefully, and handling the NBER factor I think more properly, my equation now seems to agree with yours. Prob(Recession =1) = – 0.31 – 0.69 x Spread, using data from 1970 and n – 519. Thanks. Rather fun.
Professor Chinn,
On page C1 of the 1/19/2016 edition of the WSJ, the spread between investment-grade corporate bonds and government bonds is mentioned as a warning sign of recession. The article uses Barclays’ fixed-income aggregates. Have you done a Probit model for the Barclay’s index spread (based upon a quick-look, I could not find the Barclays’s data)? I notice that FRED has a Moody’s series (FRED series AAA10YM) that may be similar to Barclays. Using the FRED series from 1953 to 2014, the results seem similar to your conclusion on this post, but the McFadden R squared is not very high.
AS: Conventional wisdom (e.g., I believe Mishkin’s textbook) is that credit spreads are a concurrent measure of recession, rather than leading. I ran a probit regression of Moody BAA-Treasury spread. At 12 and 6 month horizons, it’s not a significant empirical predictor of recessions. It is a contemporaneous one, though. See the Economist article.
Thanks! I will try the proper timeframe model.