Now that the dust has (kind of) settled on exactly what is and is not in Gerald Friedman’s interpretation of the Sanders economic plan, I thought it useful to contrast the textbook (at least the one I use, Olivier Blanchard/David Johnson‘s) view of how a fiscal stimulus works, versus that in which a one-time spending increase yields a permanent increase in output, in a graphical format.
Textbook
In Figure 1, I depict steady state with output at the natural level/potential GDP, and price level at P16 (to denote price level in FY2016). I assume for simplicity that the output gap is zero; I myself believe it’s somewhat smaller, maybe around -2 to -3 percentage points of potential GDP.
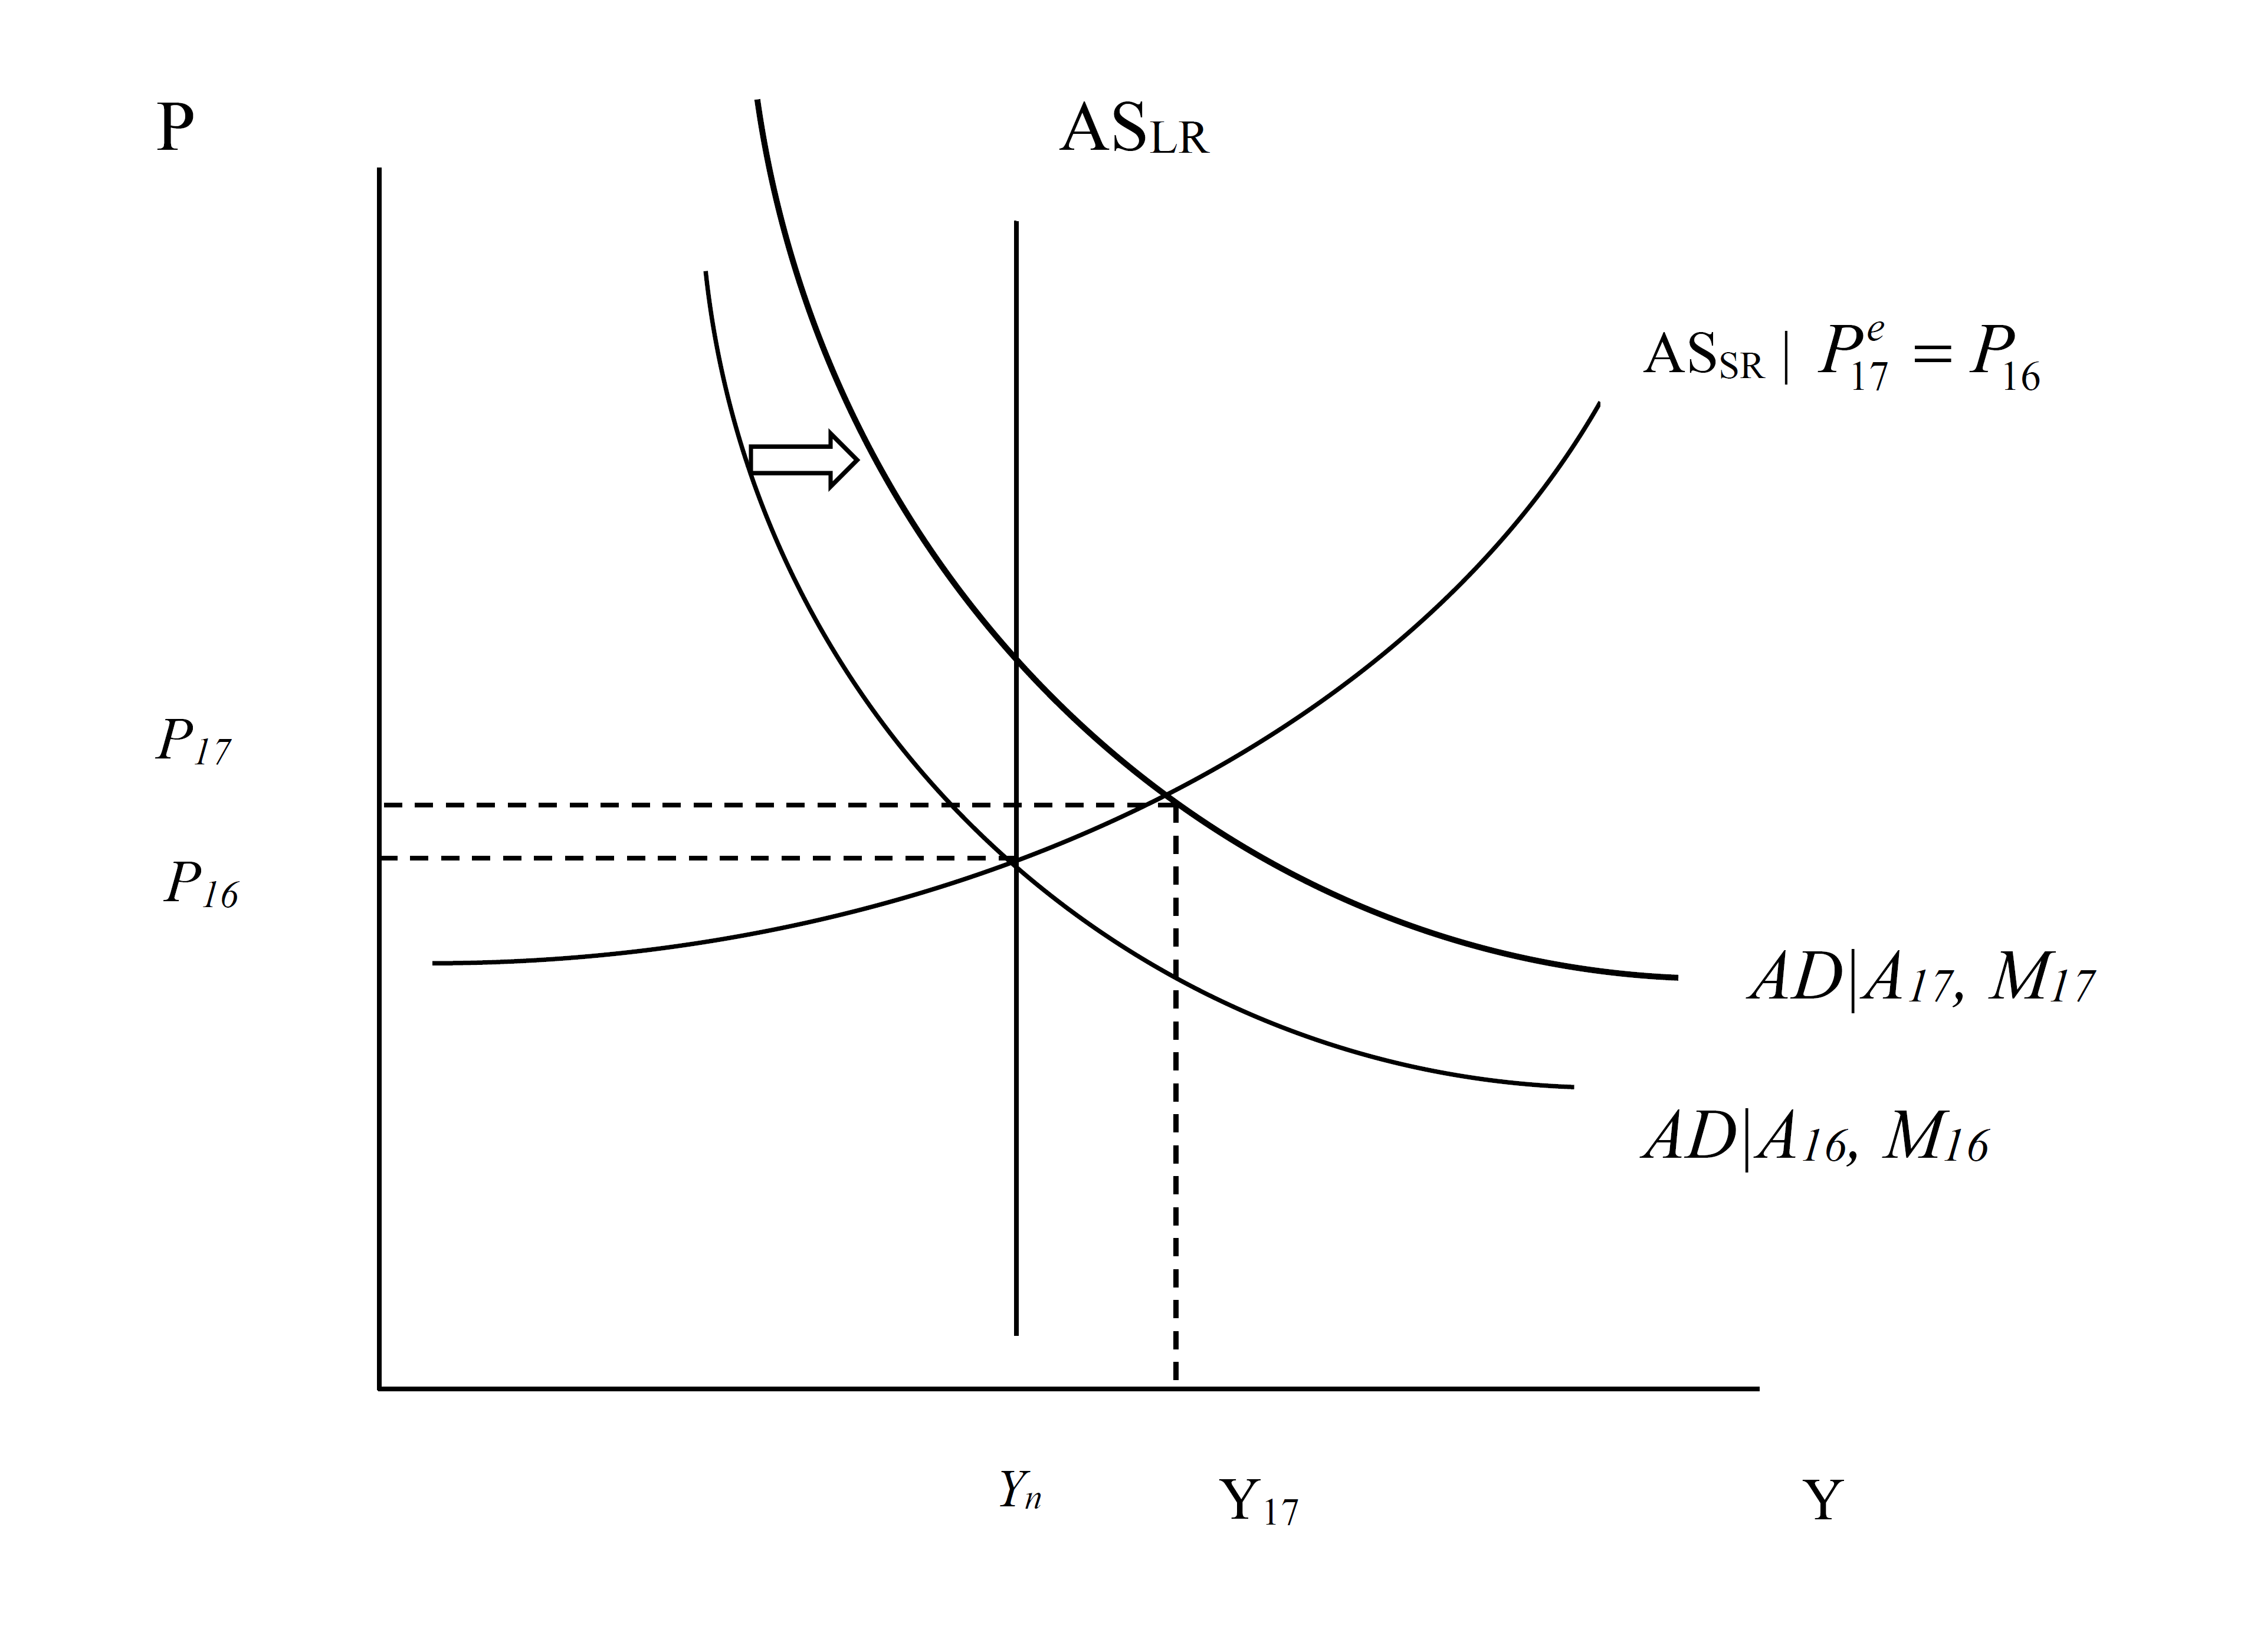
In FY2017, the AD curve is assumed to shift out due to an increase of government consumption and investment equal to about 0.8 percentage points of GDP; I assume this is a constant shift over the subsequent years, relative to where government spending was. The Fed accommodates somewhat, so part of the shift is due to increased money supply. The white arrow denotes the shift.
Notice that in the short run output rises to FY18. Ignoring lags due to the spending multiplier taking time (the outside lag, in macro parlance), the AD curve stays where it is for the subsequent periods through FY2022.
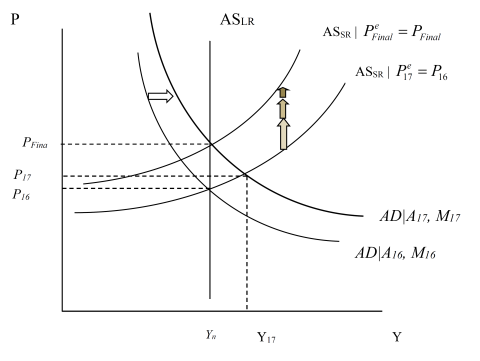
Over time, note that the aggregate supply curve adjusts upward. That’s because price expectations are adaptive (either because the underlying expectations process is adaptive, or because of nominal rigidities and nominal contracts that prevent instantaneous price adjustment), so the expected price level ratchets upward. As this happens, the real money supply shrinks, pushing up interest rates, so that investment falls. There’s a movement along the AD curve, and finally the AS curve stops shifting when the natural level of output is restored. In this sense, the model is one where the economy is self correcting.
In this textbook model, a fiscal stimulus delivers a temporary — and not necessarily persistent — increase in output above potential. This pattern matches the outcome discussed in this post.
Now, Jamie Galbraith has a plea to take seriously alternative models, and I am glad to do so. Doing so allows one to highlight what has to be assumed in order to “make it work”.
An Alternative View
It has been hard to glean exactly what assumptions were built into Gerald Friedman’s assessment, although I believe Romer and Romer have identified some of the key issues. It has been yet harder to understand what is involved in the various defenses of the Friedman assumption that multipliers apply to the growth of government spending, and not the level. As I interpret it, Friedman’s defense invokes (strong) hysteresis effects. How can permanent output effects, with minor impacts on inflation, be derived from such a view? Once again a graph can be helpful (it strikes me odd that nobody’s done this in the blogosphere — this is what I do for my macro class…).
First, assume we have a large negative output gap. Assume the aggregate supply curve is fairly flat (perfectly flat would do even better, but it’s not absolutely necessary). Or at least to begin with the AS curve is flat a position of a large negative output gap (Friedman cites -11%).
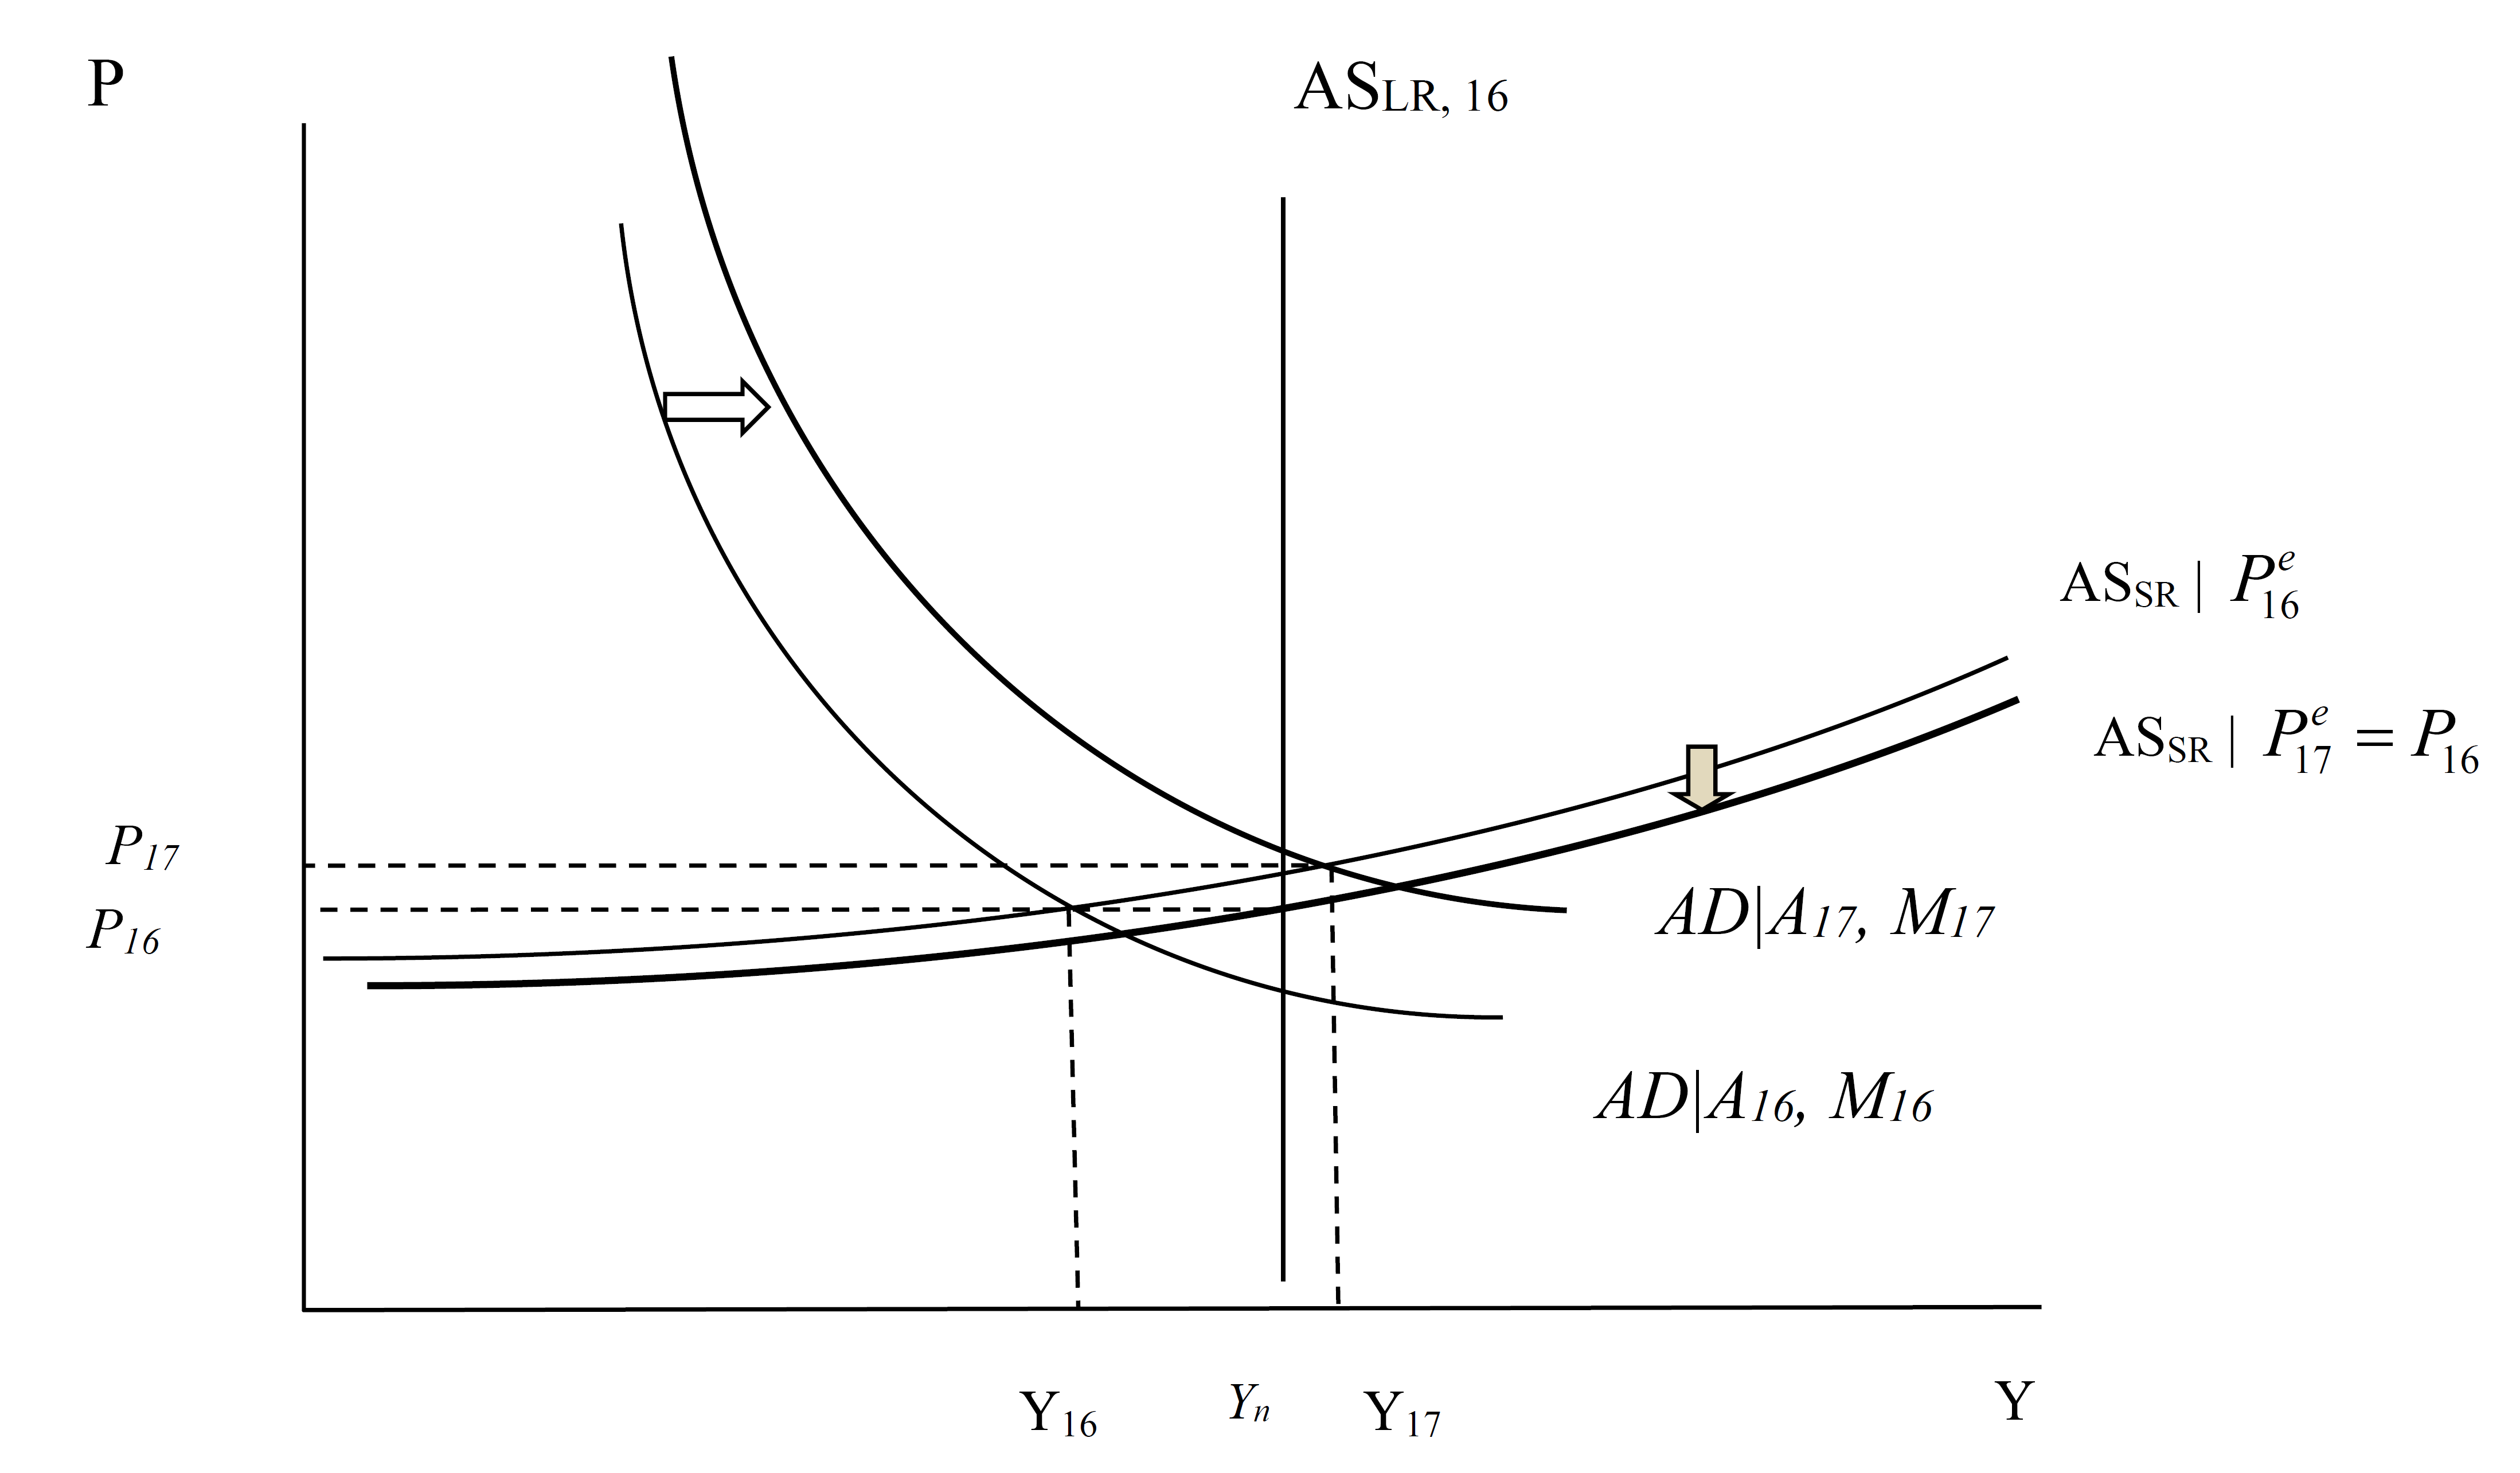
Then the increase in government spending that shifts out the AD curve in FY2017 results in a large increase in output with minimal added inflation. Now, what happens over time? In Figure 4, with the decline in the price level in FY2017 relative to FY2016, the short run AS curve shifts in.
More importantly, and critically, the increase in output in FY2017 (and the concurrent decrease in unemployment) results in a shift outward in the long run AS curve. This is shown in Figure 4.
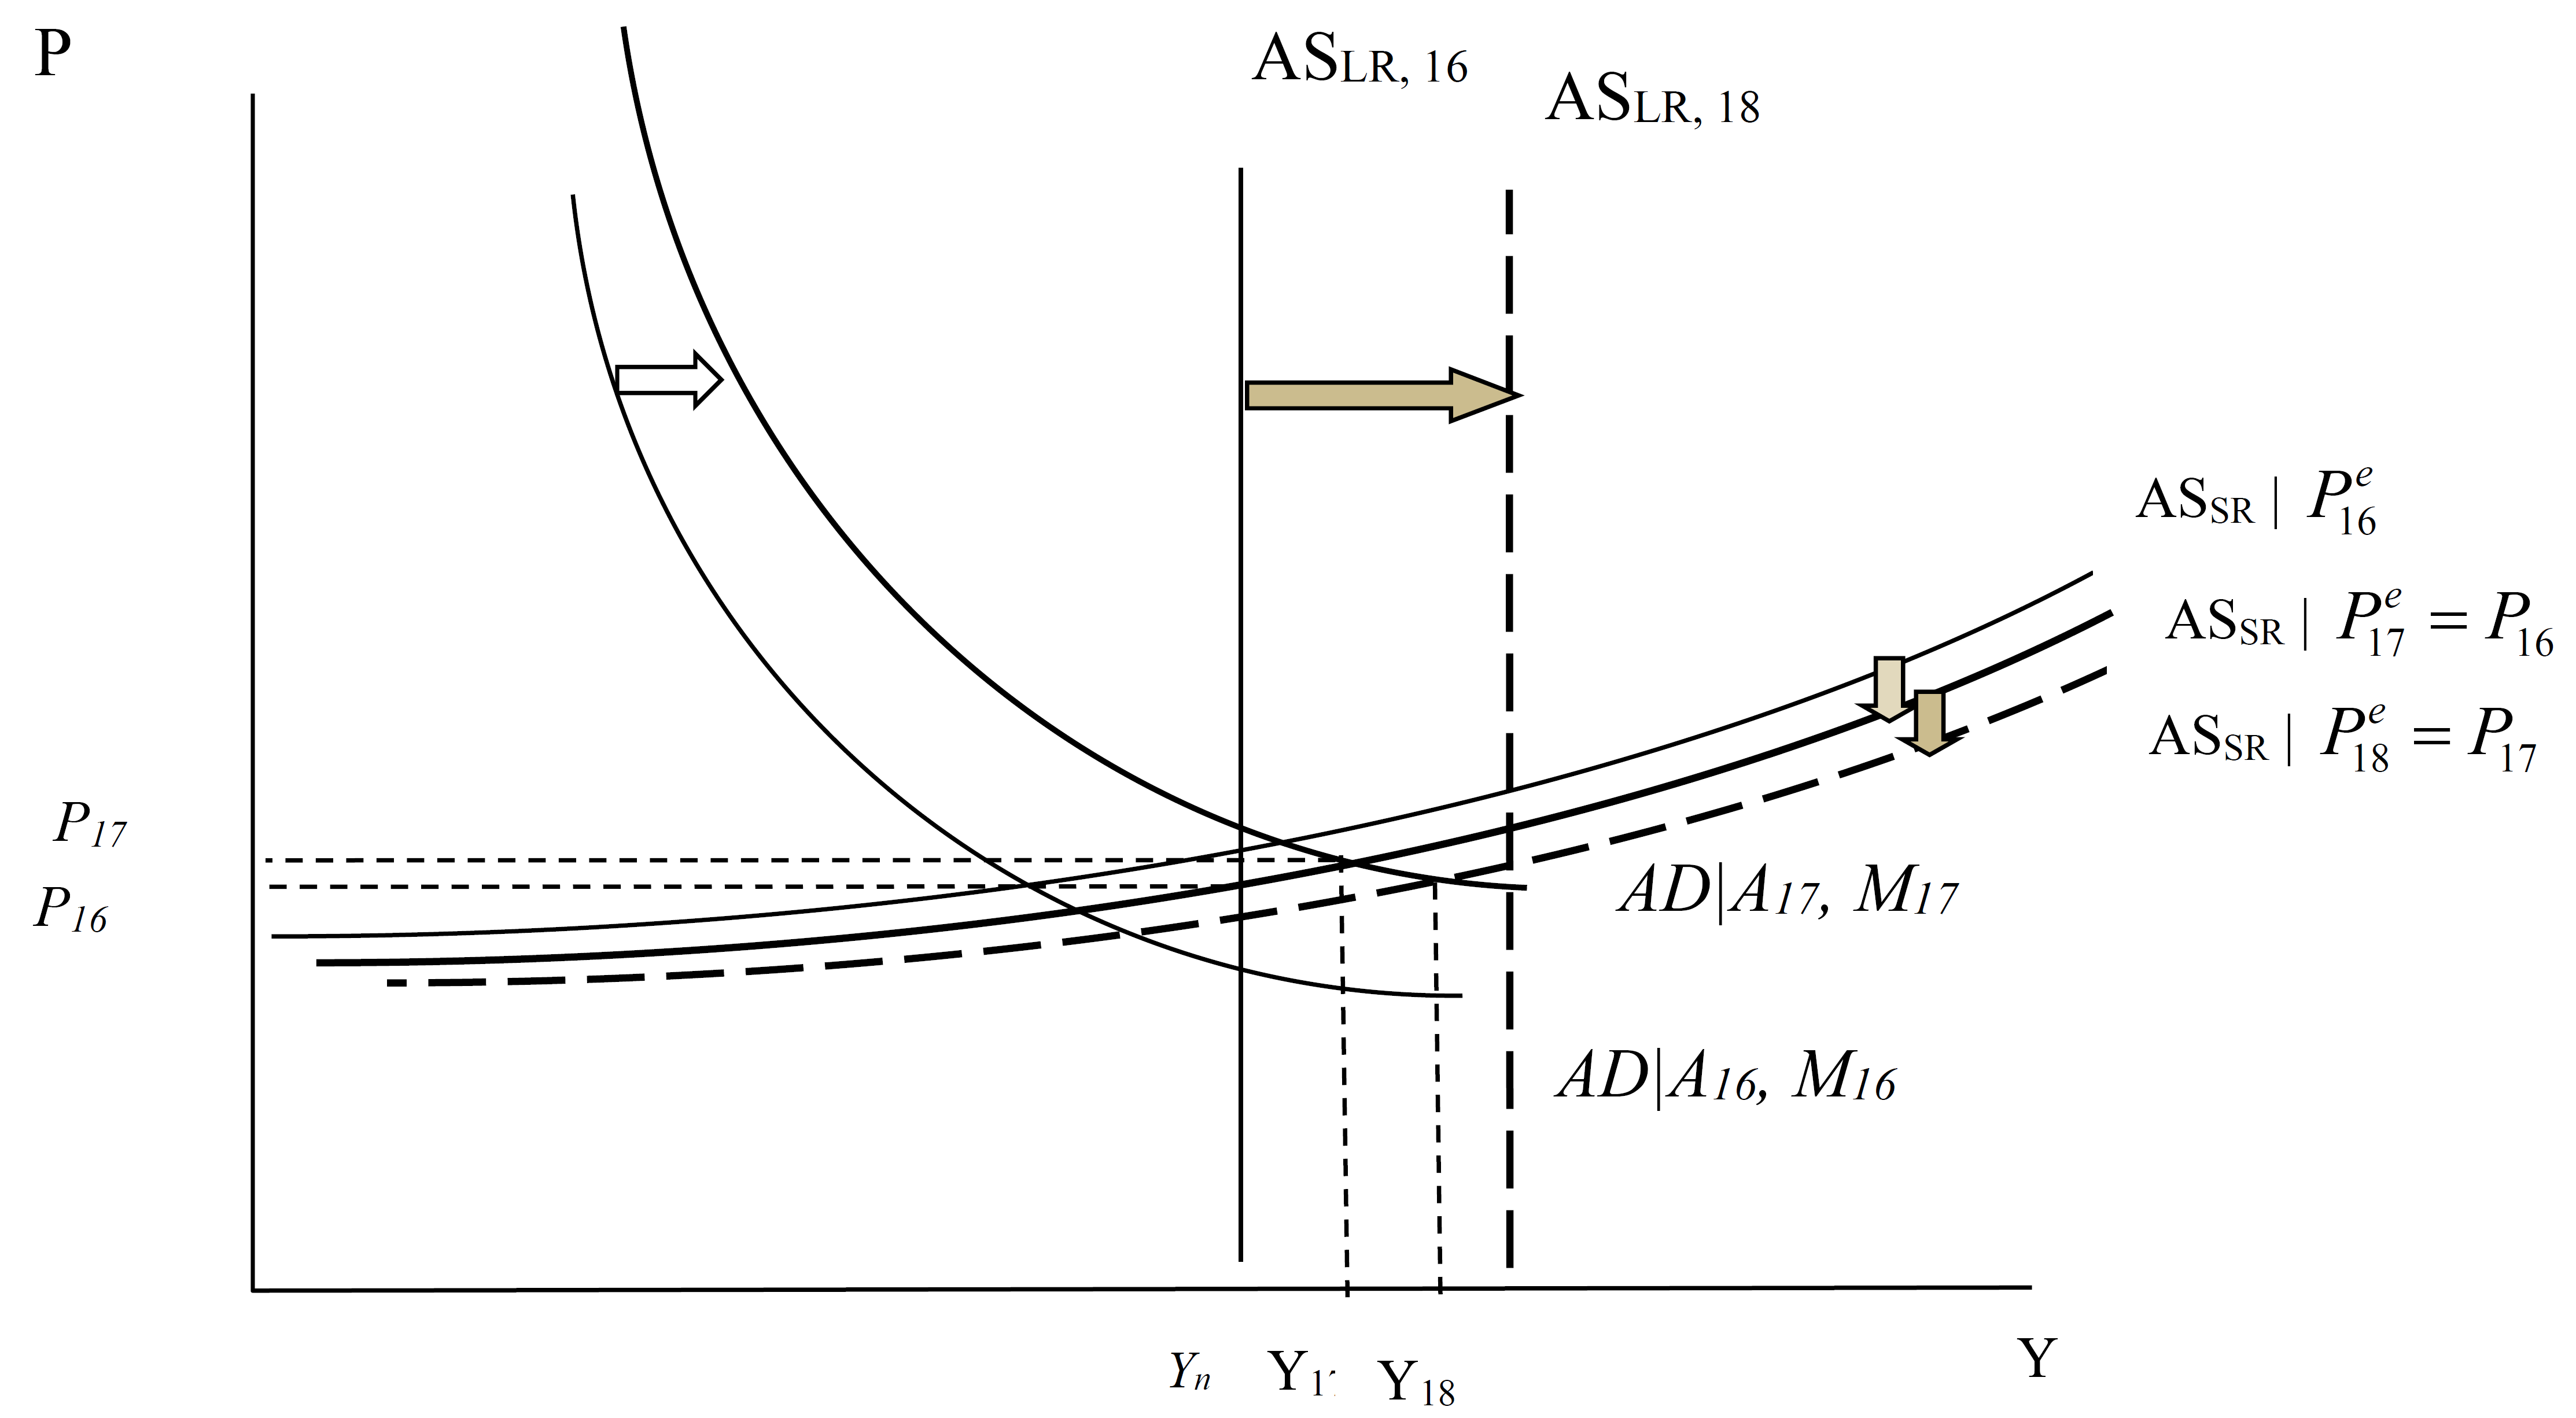
Note the short run AS curve shifts down in FY2017, so the resulting output is Y17. In FY2018, the long run AS curve shifts out so that the short run AS curve shifts out again in FY2018. The level of output again rises in FY2018. The process repeats itself in subsequent periods because higher output in a given period (recursively) results in a higher level of potential GDP.
This argument rationalizes the otherwise odd treatment of multipliers in the Friedman tabulation. To be fair, Friedman argues that potential GDP will also rise because of universal health care; however, the defense of the Friedman treatment of multipliers has hinged on hysteresis effects, so I’ve taken that literally.
Parting Thoughts
Obviously, each of these views grossly simplifies. In the textbook version, potential GDP is unaffected by recessions and slow growth. But it’s easily conceivable that the capital stock is lower than it would have been had economic conditions been buoyant and investment been higher (after all, net investment is the first derivative of the net capital stock…). Human capital too. The question is, how much.
So, in the Friedman worldview, how much does potential GDP respond to higher output due to a running a “high pressure” economy; how much institutional changes like universal health care, or infrastructure spending? And over what time frame do such effects take place?
Brad DeLong ponders some of these questions and provides some thoughts. I would like to think the AS curve is really, really flat, even past the level of potential GDP (i.e., no kinks in the AS curve), and I do believe to a certain extent (see this post). I believe that the payoff to infrastructure investment is quite high, and a no-brainer given current financing costs. But whether one could increase government consumption by nearly 8 percentage points of GDP and achieve highly persistent output increases, with only a one percentage point acceleration in inflation seems to me a question with an answer that is likely to be “no”. (For more on the plausibility of some of the implied elasticities, see Romer and Romer (2016).)
This is really quite helpful. Your students will have an opportunity to consider the arguments on both sides: hysteresis versus the accelerationist hypothesis. I’m going to reproduce this for my own classes.
There is another issue that Galbraith does not address that deserves mention. Heterodox economists do not typically believe in a natural rate of growth of potential output. Growth is endogenous in most post-Keynesian or structuralist macro theory. For examples, see Lance Taylor’s Reconstructing Macroeconomics or Maynard’s Revenge, or the textbook by Duncan Foley and Thomas Michl, Growth and Distribution. CBO now seems to think the natural rate has declined rather abruptly after the GFC based on their potential GDP numbers. I’d be inclined to say that this is an illustration of growth endogeneity.
Sanders plan would never work in a global system like today. You need isolationism and nationalism to make it work.
The key element of Bernie Sanders’ plan is a rather hefty tax increase with concomitant government spending increases which is heartily endorsed by “liberals”. The opposite would be Ted Cruz’ simple flat tax plan and reduced spending targeting a balanced budget. I have the following proposal which has cleared a brief Facebook survey of my friends on both the liberal and conservative side of the aisle (received “likes”). It is really a “market based” tax plan which relies on those who both receive and pay for government spending to draw the red line in the sand rather than leave it up to politicians. To wit:
“I agree with Hillary Clinton and Bernie Sanders that taxes have to be raised. However, I would do it in a very simple and understandable way: Each year the Congressional Budget Office determines the revenue shortfall from the prior year and the budget for the current year plus a debt reduction of 1/20th of the total outstanding debt. The total shortfall is then stated as a percent of tax revenues and added as a surtax to all individual and corporate taxes. So, if the shortfall was calculated to be 12%, then after the individual and corporate taxes were calculated (bottom line), those taxes would be increased by 12%.
Why do I propose that? Because I think every individual and business should be able to see what is the effect of government spending immediately, not 25 years down the road. If they like what they are paying for, they will continue to support those who are directing the spending. If they don’t, they will vote in someone else.
[In response to name redacted] What you say (Every American wants to keep the federal programs that benefit him and to repeal all of the federal programs that do not benefit him.) is true. What I am saying is that everyone will pay for everyone else until everyone concludes that they are paying too much. Right now, there is no downside for spending your grandchildrens’ money. Actions should have consequences; presently, they do not.
[In response to name redacted] I neither support nor reject higher taxes. Higher taxes that are not sufficiently high to offset higher spending and reduce debt are ineffective in the long run. Until Americans conclude that, the problem will persist and America will go deeper into debt. Once interest rates increase, the situation worsens. By forcing real time coverage of current spending, people can decide when the tax burden is too high.
[In response to name redacted] it is true that some corporations in some years do not pay federal taxes because of legitimate write-offs or actual losses. Others, like Exxon Mobil paid [in 2014] $31 billion in taxes with a net income of $45 billion. With our current tax system, not all form of wealth creation comes in the form of income. That’s another tax issue. Regardless of the exceptions, for the most part, the scheme I have described would work the same way for lower incomes as it does for corporations with lower profits. The percentage surcharge would only apply to a taxable amount [which is progressive]. Because there is a pretty good track history of how revenue relates to spending, the CBO could estimate what the surcharge percentage should be. When there is a recession, revenues will be smaller so if government spending continues to increase on an absolute basis, you would expect the surcharge rate to increase. This would bring about a reaction by taxpayers to bring spending back in line.
Some economists would argue that during recessions the government should have more latitude on spending and that could be worked out if the government established a moving 3-year average rate to smooth things out. It would keep revenues higher during a recovery period to offset the recession shortfall.
Without this device, our tax/spend system is and will remain broken.
[In response to name redacted] People have to become uncomfortable before they are willing to change. As long as tax revenues are significantly less than spending, then the spending is a “bargain”. If people want the programs badly enough, then they will be willing to pay the taxes for them. Now, you can argue that is fine for those who pay little or no taxes, but the “surtax” I propose would not allow the non-payers to escape. Anyone who receives federal payouts and does not pay taxes would contribute toward the surtax by a reduction in their federal benefits equal in percentage to the surtax percentage that others are paying. It’s a simply process of shared benefits and shared contribution.
There would have to be a cutoff point so that the safety net is not totally removed, but this is not a scheme where only the 1% support everyone else.
And remember, if revenues are sufficient to cover spending, there is no surtax”
This would be called the Sanders-Cruz plan.
I think, what would actually happen if there was a quick ramp-up in government spending of 0.8% of GDP on health care and infrastructure is , in the short-run, federal debt to GDP would spike higher, both AD and AS would shift out, and output would increase more than prices.
Much of the quality of growth will be low. There will be some endogenous growth. However, federal debt to GDP may end-up higher than before. So, there will be crowding-out, in the long-run, to shift both AD and AS In. The economy today is less accommodating to growth than in the 1960s or 1990s.