Last December the Fed began what it thought at the time was a new cycle of tightening. Fed Chair Janet Yellen’s statements last week suggest the Fed still sees this plan as underway. A comparison with historical tightening cycles sheds some light on why so far the Fed hasn’t followed through.
The graph below plots the fed funds rate over the last 30 years and highlights 4 historical tightening episodes in 1988, 1994, 1999, and 2005. The fed funds rate went up by 300 basis points on average in these episodes within the space of one or two years.
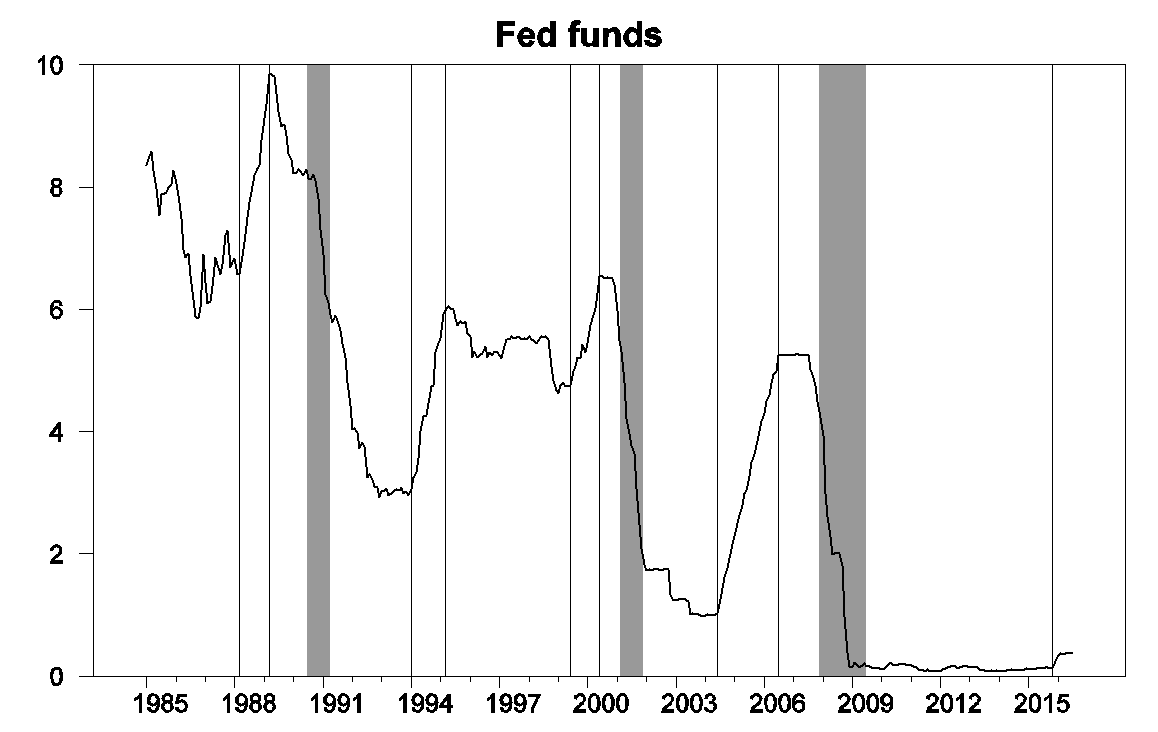
Monthly average of effective fed funds rate, Jan 1985 to July 2016. Shaded regions denote NBER recessions and vertical lines drawn at 1988:3, 1989:3, 1994:1, 1995:3, 1999:6, 2000:6, 2004:6, 2006:7, and 2015:11.
These 4 episodes have several things in common. First the inflation rate rose during each of these episodes and was on average above the Fed’s 2% target, a key reason the Fed moved as it did. Second, the unemployment rate declined during each of these episodes and ended below the Congressional Budget Office estimate of the natural rate of unemployment, again consistent with an economy that was starting to overheat. Third, the nominal interest rate on a 10-year Treasury security rose during each of these episodes, consistent with an expanding economy and rising aggregate demand.
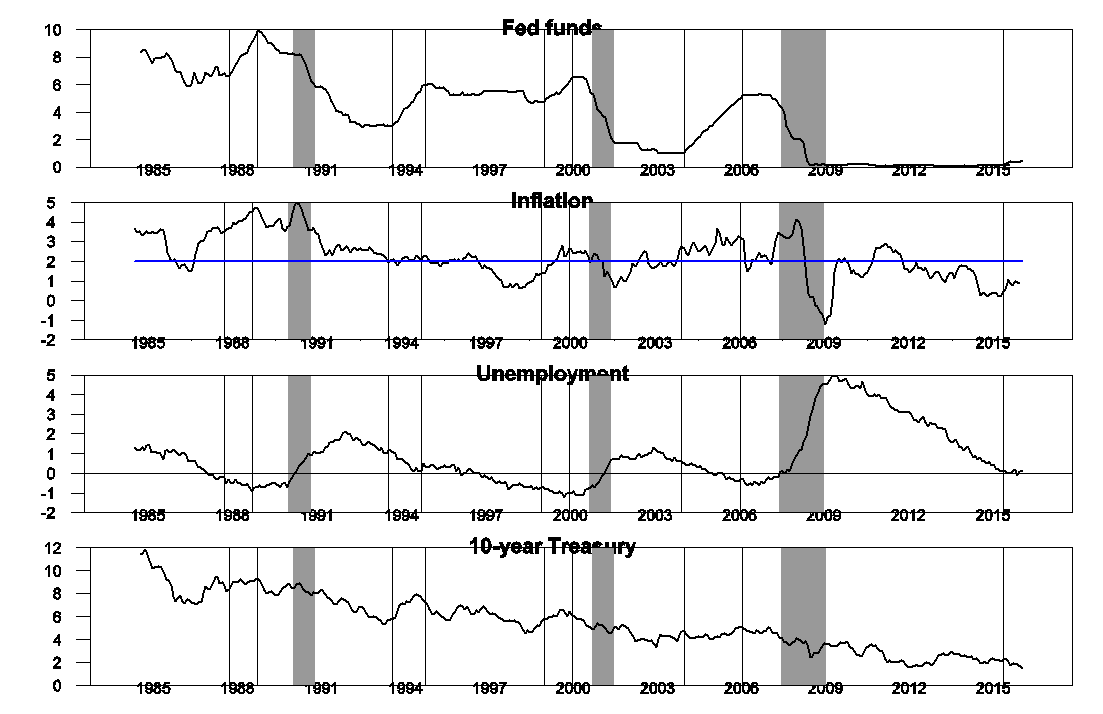
Top panel: effective fed funds rate, Jan 1985 to July 2016. Second panel: Annual inflation rate as measured by the 12-month change in the natural logarithm of the monthly PCE price deflator, with blue line indicating 2%. Third panel: difference between unemployment rate and CBO estimate of natural unemployment rate. Fourth panel: Interest rate on 10-year Treasury bond.
The FOMC anticipated in December that it would implement 4 more rate hikes in 2016 and another 4 in 2017, a bit slower than the typical tightening cycle highlighted above, but a clear tightening cycle nonetheless. So far they have implemented zero increases beyond the first modest move in December.
But in several other respects this isn’t shaping up like the earlier cycles. Inflation is a little higher than it was last year, but is still a full percentage point below the level that the Fed says it would like to see. The unemployment rate has barely budged, and has not yet moved below the CBO estimate of the natural rate. And most revealing of all, the long-term interest rate has fallen dramatically, completely unlike the behavior in a typical Fed tightening cycle.
The Fed may be anticipating solid growth, but so far the bond market doesn’t seem to be. There’s really no evidence yet that inflation needs to be contained or that we should slow down the labor market. If all three of those indicators– inflation, unemployment, and long-term rates– were sending a positive signal, then I’d be all on board for going ahead. But when none of the three are, it makes more sense to keep the plan on hold for now.
Yet, the Fed Funds Rate is very low, given strong job gains, potentially rising wages, and a potential turnaround in commodity prices.
Of course, if the Fed falls behind the curve, more or greater hikes will be needed. The Fed is following a very slow tightening path from a highly accommodative level – much slower than it expected last year. It’ll likely hike a quarter point in December and then wait and see.
We also need to take into account the lag effect.
It may take around a year for a quarter point hike to have its greatest influence.
Great post.
So, here’s a creepy but important analysis for you.
What are the parallels between the pre-WWII period and today? How might we interpret them?
Here are a few on my list:
– very low interest rates
– low productivity growth (Alvin Hansen coined ‘secular stagnation’ in 1938)
– historically low rig count, now the lowest since just before WWII
– decline in mobility, an American was more likely to own a car in 1929 that 1941. The average American is still driving the equivalent of 18 days less than they did in 2005
– low population growth in the US
– policy failure of democratic governments in Europe
These in turn led to a sharp turn left and right in the electorate. The US turned sharply left towards the modern welfare state. Italy, Germany and much of Europe turned right towards fascism.
World War I started ten years after the Great Depression. The Great Recession will have started ten years ago in late 2017.
Coincident, or are the pressures running parallel to the pre-WWII period?
Interesting thought on this! I’m with you here!
Perhaps it is worth revisiting your post from 3 years ago:
https://econbrowser.com/archives/2013/06/the_more_you_bo
Public debt is up and growth has not materialized. If the Fed behaves normally and only increases rates when “all three of those indicators– inflation, unemployment, and long-term rates– were sending a positive signal” then what do you think will happen in this new regime?
Also, this post on CBO projections from 2014.
https://econbrowser.com/archives/2014/02/cbo-deficit-projections
And your posts discussing your paper with Greenlaw, Hooper, and Mishkin:
https://econbrowser.com/archives/2013/03/fiscal_tipping
https://econbrowser.com/archives/2013/03/does_the_us_ris
These posts have various forecasts from both you, your coauthors, and the CBO. They look optimistic in hindsight. You also discuss the political dimension (which Steve Kopits also alludes to) in the “does_the_us_ris” post. With the “Fed Up” meeting at Jackson Hole, do you have any view on the current political pressure on the Fed (and how it compares historically) and whether a return to normalcy will put unprecedented pressure on the Fed?
Tom: Yes, I definitely expected interest rates to move up sooner and farther than they have, and that gave the U.S. considerably more breathing room with managing the service costs on the debt. In addition there’s a good chance we’ll see a continuation of split control of White House and Congress, which is another factor that helps keep deficits in check. So I am much less worried about this at the present time than I was 3 years ago.
Dr. Hamilton:
It is possible that the interest rate market is more noise than signal. In contrast to previous tightening cycles, the Treasury market is now about 2/3 owned by global official sector participants, who manage for non-wealth-maximizing reasons. In other words, the ratio of non-economic flows (central banks, reserve managers, passive managers) to speculative capital (actively managed mutual and hedge funds and trading individuals) is nearing all-time lows, which should mean low interest rates signify less than they would have in a previous era.
In other words: if you were unable to observe interest rates, and had to make a forecast and policy decision based purely on the economic data (such as we measure it), would your conclusion change?
formereconomist: You’re right, if we had no data at all on interest rates it would be a less obvious call. But I don’t agree that those numbers represent pure noise.
Thank you for the response. However, I do have to point out that US rates have been rallying essentially since the end of the “tantrum” without any real trend change in real final demand.
Take a good look at your fed funds chart. What was the last directional move in the fed funds rate prior to each of the last three recessions? Raising the fed funds too high for too long leads to recessions. Why is the Federal Reserve even thinking about raising the fed funds rate with inflation so low? The fed needs to wait until inflation reaches four percent before raising interest rates. The fed knows how to fight inflation if it starts to get out of hand. Higher interest rates will stop inflation in its tracks, just ask former chair Paul Volker about that. We live in a mostly services producing economy. Rapid advances in technology have made it easy for consumers to down-load apps to compare prices on virtually all goods and services. This new technology is putting pressure on prices that consumers pay for all manor of goods and services. A low inflation environment seems here to stay for the next few years at least. The fed needs to undo last December’s rate hike and try to persuade congress to spend more money on infrastructure projects to spur economic growth.
Nominal GDP growth is now about 2.4%. If you are in the school that believes the Fed should target nominal GDP growth wouldn’t this imply that the Fed should be easing?
Over the past year, nominal GDP increased by about $450 billion, roughly equal to the budget deficit. Federal spending is about 50% higher than 2007 (roughly $2.7 trillion to $4 trillion). We had small and slow tax cuts initially and then tax hikes. We’ve imposed more costly regulations on top of an overregulated economy. The tax code needs a massive overhaul. The minimum wage is too low. Wage increases are being absorbed by government (including in health care and education). We need entitlement reform, create incentives to work, destroy disincentives to work, etc.. The Fed can only do so much (and it’s already done a lot). We need to correct the structural problems in the economy that’s causing very weak real growth. Disinflationary strong growth should be the objective.
James Hamilton: “In addition there’s a good chance we’ll see a continuation of split control of White House and Congress, which is another factor that helps keep deficits in check.”
I think you have it exactly backwards. Split control and gridlock has hampered the necessary fiscal stimulus going all the way back to 2009 through the present. This has slowed the recovery, slowed growth and worsened the long run trend of the national debt.
As trends in the UK and EU have made abundantly clear, austerity measures make debts worse, not better. Austerity is the obvious result of the gridlock you seem to like.
Nice try blaming Republicans for the dismal economic performance under Obama. More of the same failed spending, or anti-growth with pro-growth policies, like 2009-11 when Democrats were in total control, would’ve worsened budget deficits (fortunately, TARP was paid back and we’re not spending a lot on global warming). Obama should’ve made economic growth the top priority and worked with the other side rather than giving up or not give in.
and you would have implemented policies which would have produced how much growth?
Interesting, if you look at the deficit as a share of GDP since WW II every Republican administration left office with a larger deficit than they inherited from the prior president. But every Democratic administration left office with a smaller deficit than they inherited.
P.S. I will ignore the comment that Obama should have worked with Republicans since that is about what it is worth.
It is interesting that nominal wage growth has accelerated even as the unemployment rate has been broadly flat since last November. So far this year, average hourly earnings are up 2.9% at an annual rate about 0.3ppt than the growth in 2015. Considering how weak productivity has been, the signal from the labor market appears to be somewhat more inflationary than it was last year.
I also find this interesting. What is the end game here in regards to low productivity growth, low inflation, yet decent nominal wage growth (especially looking at ATL Fed instead of AHE).
Do companies let their margins decrease?
Do they stop hiring?
Does higher nominal wage growth feed into increased aggregate demand and higher CPI?
Am I missing possible scenarios? Would love to hear thoughts.
Unit labor cost ( y/y) has been rising faster than the nonfarm business deflator for 6 of the last 7 quarters
This is an important determinate of profits (EPS) and is very hard to see how this negative spread will turn positive> But Wall Street keeps insisting that profits growth is bottoming and will rebound strongly over the next year. Interestingly, bottoms up estimates of 2nd and 3rd Q EPS are still being revised down and it now looks like the third quarter trailing 4 quarters EPS growth will be negative, as it has been for a year and a half.
PeakTrader asserts: “We need entitlement reform, create incentives to work, destroy disincentives to work, etc..”
So in other words, we need to eliminate massive government subsidies and tax breaks for giant highly profitable industries like the fossil fuel industry (20 billion in government subsidies last year), Apple Computer (massive tax dodging), agribusiness (more tens of billions per annum in government subsidies), etc.
We also need to create incentives to work, so that means 90% plus marginal tax rates on the rich. If the rich want lots of money, they’ll have to work much harder for it with Eisenhower-era marginal tax rates.
We also need to destroy disincentives to work. The single biggest disincentive to work is of course the absurd practice of tying CEO pay to stock price, since the CEO can increase hi/r pay merely by manipulating the stock price with buybacks rather than actually working to increase sales.
Excellent ideas! And fortunately we have someone in U.S. politics who has proposed these policies — Bernie Sanders.
I look forward to seeing PeakTrader cut large checks to Bernie Sanders’ campaign.
How does taxing workers 90% increase work?
I’ve known workers, who’ve refused overtime to avoid paying a greater marginal tax.
Maybe, you want top football players to play one quarter, top singers to sell albums with two songs, etc..
We need to stop crony-capitalism, including with ethanol and solar panels, and get back to capitalism.
And, stop the massive fraud in the earned income tax credit, disability payments, and other social programs.
So, I guess, you won’t be voting for Hillary.
He’d probably like to do that, but too late, Bernie’s now trying to elect obama’s 3rd term thru the massively corrupt warmonger.
Fed probably worried they have lost all power on account their only lever, lower interest rates… Which, when they are working, persuade the private sector to borrow and spend… But private sector debt has been climbing much faster than gdp, which is the same as gross domestic income, and therefore was never sustainable… I.e. More private sector debt is at this point a bad thing and should be discouraged… Meanwhile, lower interest rates reduce income and spending to both retirees and those nearing it, explaining why it is counter productive…
Need massive infrastructure and green spending, the bigger us deficits the better, less military spending/fossil fuel subsidies…
Not gonna happen, so bet on more of the same… 30-year with 1 handle, 10-year with 0, low growth, falling Corp income income eventually leads to market crash and us recession, pushing eu into recession and breakup, Chinese recession and instability or worse, Middle East tensions exacerbated by crashed oil income, worldwide deflation, meanwhile Clinton anyway wants to confront Putin who will himself be seeing opportunities as eu splinters…
Evan asks what the end game here is. The end game is: “Everything is free and no one has a job. — Bruce Sterling.”
https://www.theguardian.com/books/2015/jul/17/postcapitalism-end-of-capitalism-begun
“Do companies let their margins decrease?
“Do they stop hiring?
“Does higher nominal wage growth feed into increased aggregate demand and higher CPI?
“Am I missing possible scenarios? Would love to hear thoughts.”
Most companies have no margins. Every smartphone company but Apple is currently losing money, desperately hoping to make back their losses with billable phone minutes on smartphone contracts…but contracts are also going going away, and the billing per minute keeps dropping in sync with Moore’s Law. Meanwhile, Skye makes phone calls free, and it gets increasing hard to compete with free.
http://www.businessinsider.com/apple-is-taking-93-of-the-profits-in-the-smartphone-industry-now-2015-2
We see this pattern of one company making essentially all the profit in an industry (Apple makes 93% of the profits in the cellphone industry) replicated over and over again throughout the economy. Amazon makes most of the profits in the online sales space and accounted for 60% of online sales growth in 2015 alone, all computer sellers other than Dell make essentially no profit in the computer industry, Comcast + TimeWarner + Adelphia make 90% + of the profits in the internet service business, six media companies make 90% + of the profits in the movie/book/record industries, and so on.
https://www.internetretailer.com/2016/05/02/amazon-accounts-60-us-online-sales-growth-2015
http://bgr.com/2014/01/10/pc-profits-analysis-margins/
http://arstechnica.com/business/2015/11/comcast-time-warner-cable-get-71-of-new-internet-subscribers/
http://www.businessinsider.com/these-6-corporations-control-90-of-the-media-in-america-2012-6
Citing bulk statistics (“average corporate profits up,” “average GDP rising,” “median wages up”) in such a distorted highly monopolized economy gives bizarre and laughably faulty results.
Check your homework, folks. Wages for the bottom 60% of U.S. workers dropped 4% in the first quarter of 2016. Median wages are only rising because CEOs’ income is skyrocketing thanks to an exploding stock market (CEO pay is tied to stock prices). When the top 20% sees their income double while the bottom 80% watch their income drop by 4%, obviously you’re going to see an increase in “median wages.” But that increase is a statistical illusion. For most people, wages are dropping after you include inflation. Wages are only going up for lobbyists, lawyers, doctors, CEOs, and other rich people.
http://www.theatlantic.com/business/archive/2015/09/low-income-worker-wage-decline/403840/
“In more than a third of counties, median income dropped 10% or more since 2000.”
http://www.pewtrusts.org/en/research-and-analysis/blogs/stateline/2016/01/22/fewer-manufacturing-jobs-housing-bust-haunt-many-us-counties
The rosy economic scenario we’re being handed here doesn’t add up. These numbers don’t parse. People over 50 and under 25 can’t find jobs…yet we’re being told the economy is at full employment.
http://www.pbs.org/newshour/making-sense/women-over-50-face-cant-find-jobs/
http://www.newsweek.com/2015/06/05/millennial-college-graduates-young-educated-jobless-335821.html
http://money.cnn.com/2016/05/23/news/economy/us-full-employment-williams/
The labor force participation rate dropped to record 62.8% this year even while U.S. corporations report all-time unheard-of record profits, yet we’re told that productivity is down. We’re told that unemployment is down, yet a record number of people who used to be looking for work have dropped out of the labor force because they can’t find jobs.
https://www.washingtonpost.com/news/wonk/wp/2016/03/30/larry-summers-corporate-profits-are-near-record-highs-heres-why-thats-a-problem/
http://www.pewresearch.org/fact-tank/2014/11/14/more-and-more-americans-are-outside-the-labor-force-entirely-who-are-they/ households
http://www.forbes.com/forbes/welcome/?toURL=http://www.forbes.com/sites/bobmcteer/2015/05/11/productivity-is-down-are-u-s-workers-slacking-off/&refURL=https://www.google.com&referrer=https://www.google.com
We’re told that the economy is booming but 75% of people making less than $50,000 a year would have difficulty coming up with $1,000 to cover an unexpected bill.
http://www.commondreams.org/news/2016/05/19/age-precarious-6-10-americans-living-financial-edge
We’re told big cities in the U.S. are creating vast numbers of jobs, yet most of the jobs created since the 2008 global economic crash are low-wage jobs and there is not a single city in the United States where a person can afford to pay the rent for one-bedroom apartment while working full-time at minimum wage.
http://www.huffingtonpost.com/2013/05/13/low-paying-jobs_n_3266737.html
http://www.huffingtonpost.com/entry/how-much-income-you-need-to-afford-rent-by-state_us_574880cae4b0dacf7ad4c828
We’re told that a larger percentage of students than ever is now graduating with advanced degrees, but 60% of all college graduates since 2000 have taken jobs that do not require a college degree.
http://www.chronicle.com/blogs/innovations/the-great-college-degree-scam/28067
We’re told that U.S. corporations are wildly profitable, yet only 6% of U.S. companies account for 50% of all corporate profits.
http://www.usatoday.com/story/money/markets/2016/03/02/6-companies-make-50-us-profit/81175914/
We’re told that record numbers of jobs now require postgraduate degrees, yet 58% of the jobs created since the 2008 recession are low-wage jobs requiring no college degree.
“The data on necessary educational levels are based on variant definitions. The Current Population Survey administered by the U.S. Census Bureau classifies more than 60 percent of all jobs as postsecondary, but the Bureau of Labor Statistics reports half as many: 31 percent. This wide discrepancy is because the CPS tallies the education levels of people who are currently working in various jobs, whereas the BLS statistics reflect the entry-level education requirements for those jobs (a classification that seems to change from year to year). Thus, the job held by a college-educated barista would be classified as postsecondary by the CPS but not by the BLS. Obviously, jobs data that trace the degrees held by current employees are subject to distorted interpretation.”
http://www.chronicle.com/article/The-Economy-Does-Not-Depend-on/142641