With update 8/23 showing application of same methodology to Doyle administrations.
DWD released data today. Wisconsin private employment in July is estimated to equal what we earlier thought it was in June…
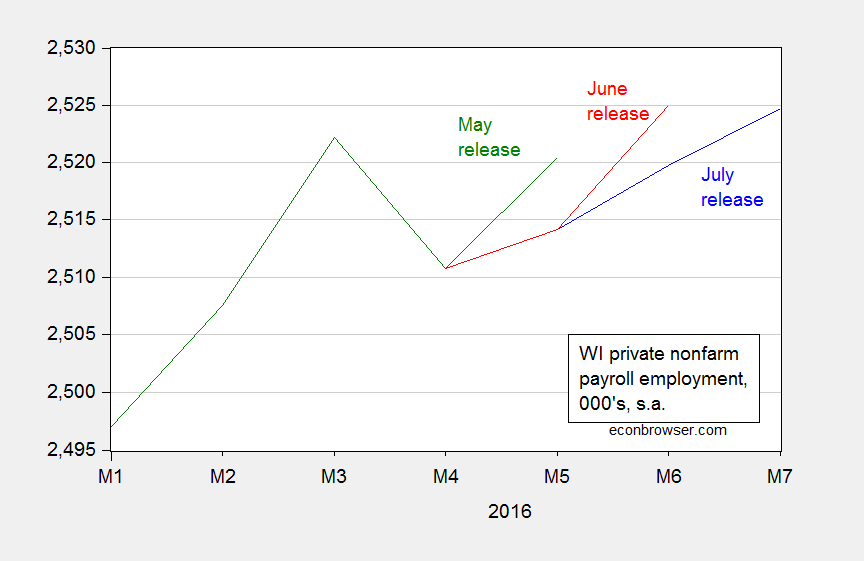
Figure 1: Wisconsin private nonfarm payroll employment from July release (blue), June release (red), and May release (green). Source: BLS, and DWD.
Notice that the past two preliminary estimates have been revised down.
Wisconsin private employment continues to increase at a lackluster pace; employment stands 47.9 thousand below the level Governor Walker stated in August 2013 was the goal for January 20156. This is shown in Figure 2.
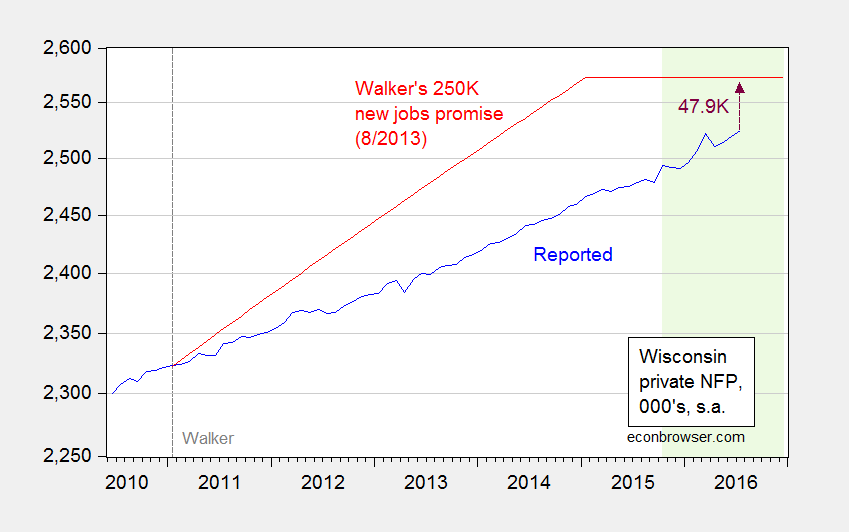
Figure 2: Wisconsin private nonfarm payroll employment (blue), and Governor Walker’s August 2013 commitment to create 250,000 new private sector jobs (red). Light green shading denotes data that has not been benchmark-revised. Source: BLS, Milwaukee Journal Sentinel, author’s calculations.
Note that the data in the green shaded area will be benchmark revised using Quarterly Census of Employment and Wage. The spikes in 2015M10 and 2016M03 will likely be benchmarked away (at least as suggested by data from QCEW through March 2016, also reported in the DWD release).
It’s of interest to see whether Wisconsin has gained on Minnesota, and the Nation. Since the beginning of the year, the gap has widened with respect to Minnesota.
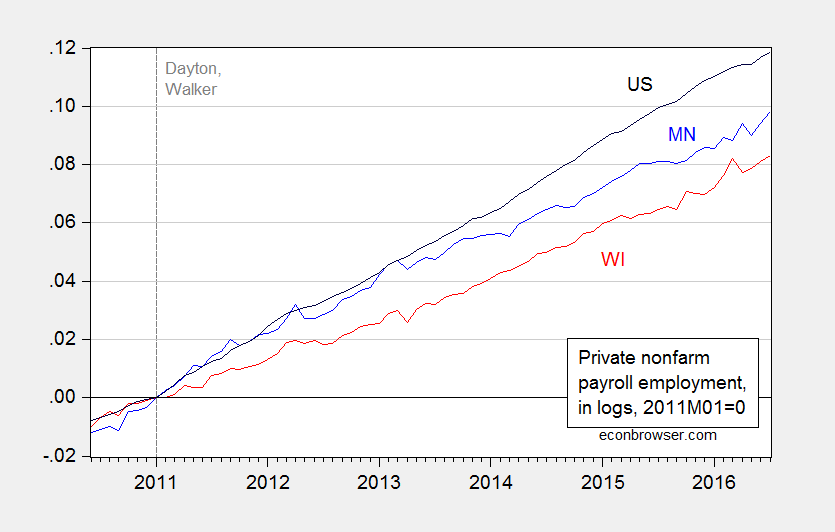
Figure 3: Log private nonfarm payroll employment in Minnesota (blue), Wisconsin (red), and US (black), seasonally adjusted, 2011M01=0. Source: BLS, DWD, DEED, and author’s calculations.
The correct comparison is what Wisconsin is doing relative to what it should be expected to do, based upon historical correlations. Using an error correction model (1 lag) estimated over the 1994-2010 period, with national private employment as the key exogenous variable, I find that current employment levels are below expected, by a statistically significant amount.
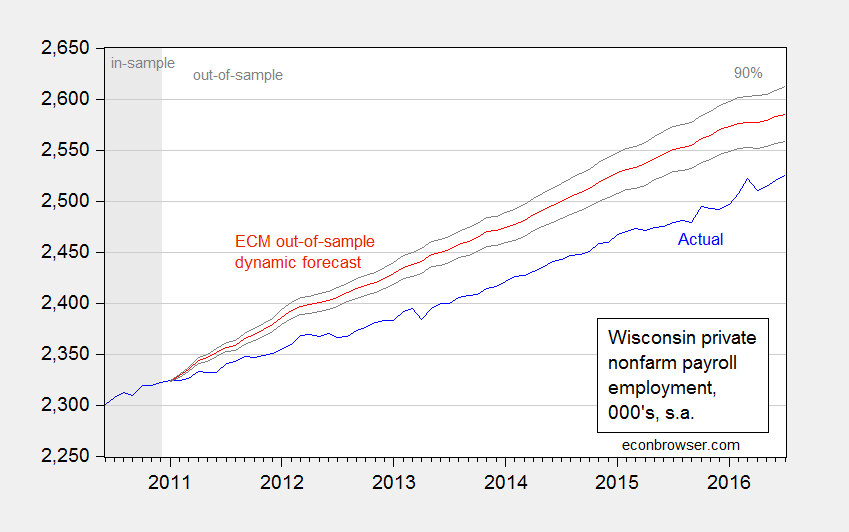
Figure 4: Wisconsin private nonfarm payroll employment (blue), and dynamic historical simulation (red), and 90% prediction interval (gray lines). Source: BLS, DWD, and author’s calculations.
The current evaluation of the efficacy of the Governor’s economic policies can be seen in this Marquette Law School Poll (taken August 4-7) result:
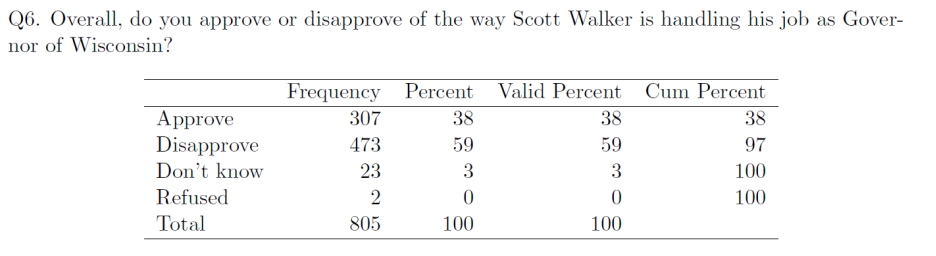
Source: Marquette Law School Poll – August 4-7, 2016.
Update, 8/23, 11:40am Pacific: For those curious what a similar methodology says for the Doyle governorship, here is the analogous graphic.
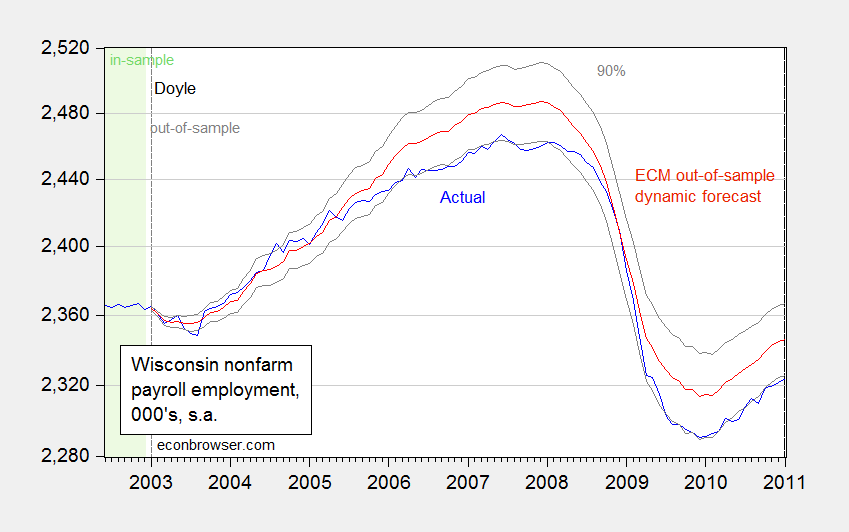
Figure 5: Wisconsin private nonfarm payroll employment (blue), and dynamic historical simulation (red) based on ECM (1 lag) 1976M01-2002M12, and 90% prediction interval (gray lines). Source: BLS, and author’s calculations.
Prof. Chinn,
Your series of posts about employment in Wisconsin are clear and informative (despite what some of the commenters say). The way you present the data and the specific comparisons are good illustrations of how economic professionals examine their data and draw conclusions in the midst of uncertainty and confounding factors.
While I know that you focus on Gov. Walker and Wisconsin because you are a Wisconsin professor and citizen, I enjoy your comparisons with other states, such as Minnesota, as a comparable state with different government policies, Kansas, as a state with similar “supply side” tax policies, California and others.
As a resident of Tampa, I’d like to see Florida included in your comparisons sometimes. Our governor Scott boasts of his business and job friendly policies and of the decline in unemployment under his leadership. A key part of his plan appears to be to take jobs and businesses from other states by promising businesses that they will be able to treat their workers poorly if they relocate. Not considered in your comparison data is the quality of new jobs created, or the balance of the job market. Here many of the new jobs seem to be low-paying service industry jobs. Would you be able to include this type of factor in your analysis?
http://www.bls.gov/lau/stalt.htm
Different measures tell different stories. Kansas is much closer to “full employment” than most states; Wisconsin isn’t doing badly either. It’s nice to see the rest of the story.
Given that Kansas and Minnesota share the same U-6 value and that Kansas has a relatively stagnant and aging population, the employment record doesn’t seem all that bad. If economic assessment is based on what politicians promise, then let’s look at Hillary Clinton’s promise to upstate New York and what happened there. Otherwise, just the data, please.
Bruce Hall: Suggest you run a regression of each state’s unemployment rate on the National, perhaps in a panel regression, and then see whether the unemployment rate is statistically different from what is expected. You could add in demographic variables to test your hypothesis. All the data are available on line, and you can do the regressions in Stata or R, a free-access statistical package.
At some point, a simple statistical relationship will reach an illogical point. Because a regression shows decent correlation during a time period or range of values doesn’t make the relationship immutable. The population growth rate for the entire U.S. is twice that of Kansas, so for an unemployment relationship to hold, it seems reasonable to accept that employment growth has to be faster for the U.S. than Kansas to accommodate the faster population growth.
Given the U-6 rate for 7.8% for both Kansas and Minnesota, what is Minnesota doing wrong?
When a politician like Brownback or Hillary Clinton or Barack Obama promises that pigs will fly, you have to understand that he is only promising to make footballs. Looking for pigs with wings is a waste of time.
Thank you Dr. Chinn.
Besides employment, I would note that one of major functions of state governments is to fund public education.
In regards to pubic education, I would point out this recent non-partisan Legislative Fiscal Bureau on general school aid changes for school districts from 2010-11 to 2015-16 in Wisconsin.
http://www.thewheelerreport.com/wheeler_docs/files/0815bewleymemo.pdf
Many districts saw reductions of 30-50%.