New data came out on industrial production and monthly GDP over the last couple days. That allows us to update the picture of key indicators that the NBER Business Cycle Dating Committee focuses on continues to paint an ambiguous picture.
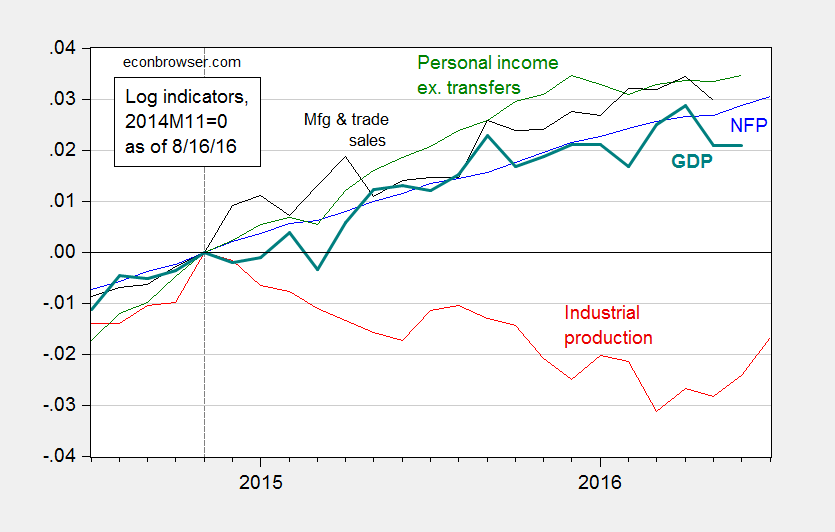
Figure 1: Log nonfarm payroll employment (blue), industrial production (red), personal income excluding transfers, in Ch.2009$ (green), manufacturing and trade sales, in Ch.2009$ (black), and Macroeconomic Advisers monthly GDP series (bold teal), all normalized to 2014M11=0, all as of August 16. Source: BLS (July release), Federal Reserve (June release), Macroeconomic Advisers (August 16), and author’s calculations.
Industrial production is now detectably trending upward. In terms of the tradables sector, manufacturing is also recovering, mitigating some of the concern of external drag.
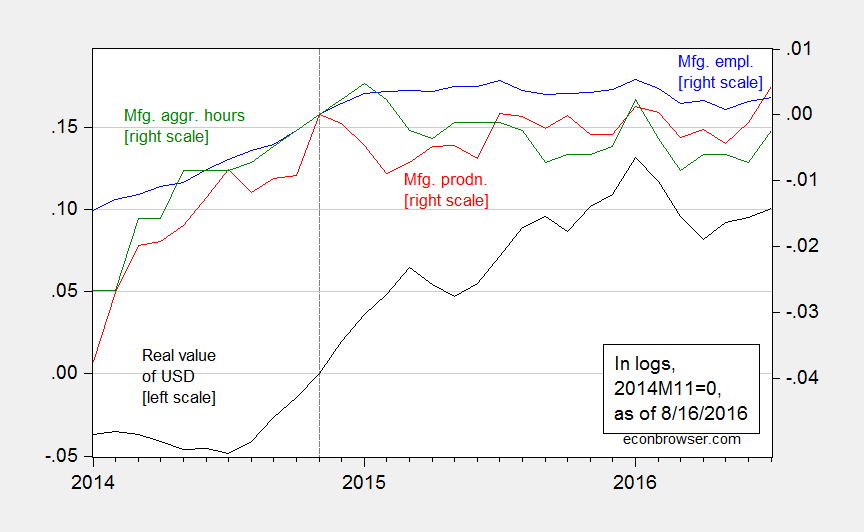
Figure 2: Real value of the US dollar against broad basket (black, left scale), manufacturing production (red, right scale), manufacturing employment (blue, right scale), aggregate hours index for manufacturing production and nonsupervisory workers, all in logs, 2014M11=0. Source: Federal Reserve Board, BLS, and author’s calculations.
The following graph is interesting. It points in the opposite direction.
https://fred.stlouisfed.org/graph/?g=6F0O
But your indicator has given almost as many false signals as true signals.
It just is not reliable.
In this “recovery,” growth in services is weak, while growth in durable and non-durable goods are weaker.
There are some positives. The labor market continues to strengthen with faster wage growth; energy prices and interest rates are low; stock and bond prices are high; the Fed is highly accommodative; the dollar has declined over the past month.
Some are predicting inflation will accelerate, from about 1.5% to about 2.5%, next year, because of rising energy prices, rising medical prices and premiums, and higher rents and housing prices.
The stock market (investor sentiment?) has traditionally been regarded as a leading indicator of economic activity. Perhaps that’s too simplistic, but the U.S. market indices have been pretty bullish for quite a few years with some temporary “corrections”. http://finance.yahoo.com/quote/%5EGSPC?p=^GSPC (10-year)
The last recession was pretty obvious with a drop beginning in October, 2007. The last recession officially started in December, 2007. That’s not much of a lead and it’s difficult to identify versus temporary corrections such as the July, 2015 and November, 2015. But if you take the trend beginning in February, 2009, it’s pretty much a straight line up.
So, maybe millions of investors are a good source of economic intelligence.
I wonder if it’ll continue for several more years?
Although, financial market technical analysis is generally voodoo, if enough people believe in it, I guess, they’ll make it true.
https://raymondjames.bluematrix.com/sellside/EmailDocViewer?encrypt=adab480c-d021-43e0-a7c8-f2b093f2d9a5&mime=pdf&co=RaymondJames&id=Jeffrey.Saut@RaymondJames.com&source=mail
“Industrial production is now detectably trending upward. In terms of the tradables sector, manufacturing is also recovering, mitigating some of the concern of external drag.” -MC
The big question: Will the US central bank raise overnight rates in September?
Taking Bruce Hall’s comments into account while ignoring the wise popular saying that the markets predicted the last 12 out 6 recessions, and ignoring the record low fixed income yields, I believe there is a greater than 60% probability that the US central bank raises rates in September.
The other big question is how would a US central bank rate increase influence the presidential elections outcome? (The dual mandate opens the door to endless politics.) I believe it would work to Clinton’s favour and I strongly suspect that all US central bank governors and their support staff are horrified at the prospects of Trump becoming the next president.
Hmmm wondering how many more years this is going to go on for! Surely something must change.