Yet more cautionary notes for my students.
Don’t Reason from identities
One of the best known identities in economics is the definition of GDP:
Y ≡ C + I + G + X – IM
From this, a writer at the Heritage Foundation deduces the following:
Congress cannot create new purchasing power out of thin air. If it funds new spending with taxes, it is simply redistributing existing purchasing power (while decreasing incentives to produce income and output). If Congress instead borrows the money from domestic investors, those investors will have that much less to invest or to spend in the private economy. If they borrow the money from foreigners, the balance of payments will adjust by equally raising net imports, leaving total demand and output unchanged. Every dollar Congress spends must first come from somewhere else.
In other words, G rising by one dollar necessarily reduces either C or I by one dollar. Of course, this is true holding Y fixed. There is no reason why this should necessarily be true. One can’t say what happens without a model.
The author adds in another identity, the balance of payments, for good measure:
BP ≡ CA + FA + ORT
Where CA is the current account (approximately the trade balance, X-IM), FA the private financial account, and ORT official reserve transactions. FA going up by one dollar results necessarily in CA declining by one dollar in the author’s preferred interpretation. Of course, his holds ORT constant (no changes in foreign exchange reserves). And it rules out repercussion effects, such that offsetting lending occurs…
In other words, there is no way to avoid using some sort of model when one wants to impute cause and effect. It doesn’t have to be model with equations, but if one tries to avoid using a model, one ends up implicitly using a model, that more often than not, has internal inconsistencies, or implausible assumptions.
Don’t Forget to Check for Data Breaks
In this era of easily downloadable data, the analyst is tempted to skip to the calculations before reading the footnotes. This is problematic, because, as government and international statistical agencies collect data, the mode of the data collection or the means of calculation sometimes change. Those changes are usually noted, but if one does not read the documentation, one can make serious mistakes. For instance, examining civilian employment (FRED series CE16OV), one would think there was a tremendous boom in employment in January 2000.
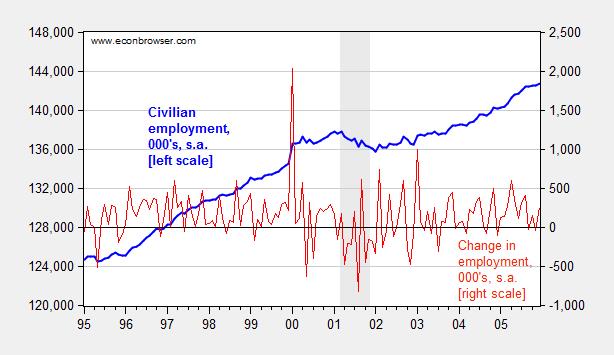
Figure 1: Civilian employment (blue, left scale) and change in civilian employment (red, right scale), both in 000’s, seasonally adjusted. Source: FRED series CE16OV.
If one inspects other series, say nonfarm payroll employment, one sees no corresponding jump. This suggests the boom interpretation is wrong. Further evidence of a “break” is found by inspecting the first difference of the series (in red). The spike in January 2000 is a 1.5% change (m/m), while the the standard deviation of changes is 0.3% (calculations in log terms).
In fact, the jump is due to the introduction of new population controls associated with the Census. New controls are applied every decade, so this is a recurring (and known — to those who are careful) problem. Nonetheless, here’s an example of the mistake regarding the participation figure. Other breaks are less obvious. This is a cautionary note to all who download data without consulting the documentation.
Don’t Make Absolute Predictions When Revisions Abound
Consider Professor Casey Mulligan on October 26, 2008:
According to the BLS, national nonfarm employment was 136,783,000 (SA) at the end of 2006, as the housing price crash was getting underway. Real GDP was $11.4 trillion (chained 2000 $). Barring a nuclear war or other violent national disaster, employment will not drop below 134,000,000 and real GDP will not drop below $11 trillion. The many economists who predict a severe recession clearly disagree with me, because 134 million is only 2.4% below September’s employment and only 2.0% below employment during the housing crash. Time will tell.
Time has told. Here is what actually happened.
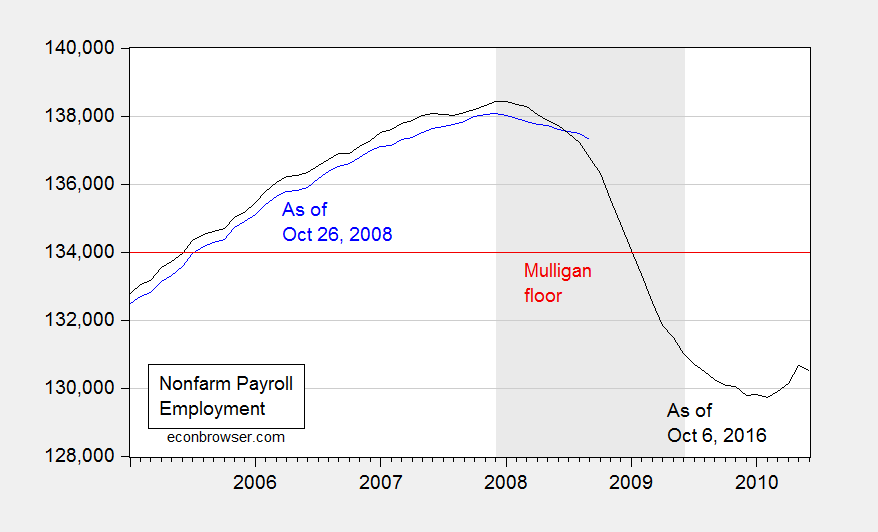
Figure 2: Nonfarm payroll employment, September 2008 release (blue), and September 2016 release (black), and 134,000,000 employment floor cited by Casey Mulligan (red). NBER defined recession dates shaded gray. Source: BLS via FRED and ALFRED.
Here is where knowing about revisions is important. Not only was finally revised employment 537,000 below what was estimated as of end-October; employment was falling much faster than estimated at the time. For the three months ending in August 2008, employment was falling 309,000/month, rather than 99,700/month.
Thinking about the data as settled numbers, rather than estimates, can lead to embarrassingly erroneous conclusions, to be long immortalized on the internet.
Don’t Do Simple Subtraction of Chain Weighted Measures
At Political Calculations, Ironman has focused on drought and manufacturing (particularly aircraft) as an explanation for Kansas’s lagging economic fortunes. Specifically, he asserts that real Kansas GDP stripped of agriculture and manufacturing looks much better. Unfortunately, his graph in his post plots a series where he calculated Kansas GDP ex-agriculture and manufacturing by simply subtracting real agriculture and real manufacturing — both measured in Chain weighted dollars — from real GDP measured in Chain weighted dollars (the red line in Figure 3 below). This is, quite plainly, the wrong procedure, as I explained in this post.
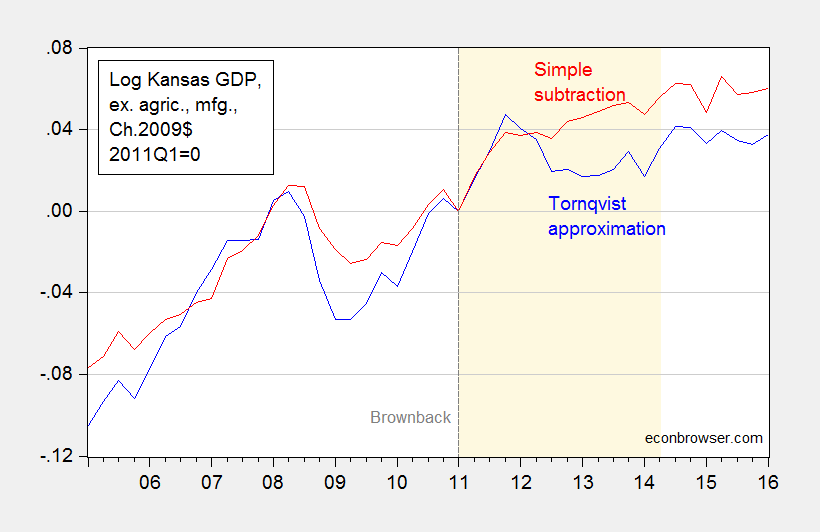
Figure 3: Log Kansas real GDP ex. agriculture and manufacturing, calculated using Törnqvist approximation (blue), and calculated using simple subtraction (red), 2011Q1=0. Dashed line at 2011Q1, Brownback takes office. Light tan shading denotes period during which Ironman identifies as drought. Source: BEA and author’s calculations.
Using durable manufacturing instead of total manufacturing does not change the results. In other words, Ironman’s conclusion is completely overturned when using the right calculation. So, beware making conclusions when you don’t understand the data!
Don’t Defend Factoids as Facts
In this era of the internet, it’s important to remember that the barriers to circulating misinformation are very low. Here is Governor Romney making a factual assertion, as quoted in Salon (see also WSJ):.
“We should be seeing numbers in the 500,000 jobs created per month. This is way, way, way off from what should happen in a normal recovery.
This is patently, wrong, as discussed in this post. But here is frequent commenter Rick Stryker trying to change the terms of debate:
Counting the number of times that monthly employment increases were greater than 500K since 1939 is just an attempt to lower the bar for what administration supporters know in their hearts is a failed presidency.
In 1939, the size of the labor force was 30 million; today it is 133 million. A 500K monthly increase on 30 milion [sic] would be truly gigantic and not at all what Romney was advocating. To put Romney’s remark in context, we need to adjust for the current size of the labor market, which we can simply do by dividing 500K into 133 million, yielding 0.38%. Going back to 1939, there are 172 cases in which monthly employment gains were at least 0.38% of the current labor market size. Admittedly, the last time we saw sustained increases of 0.38% of current labor market levels was during the recovery from the 1982 recession. But that just implies that Romney is setting an ambitious but not historically unreasonable employment goal. Given the size of the current employment hole, it is also necessary goal if we are to return to full employment anytime soon.
…
Note how Mr. Stryker tries to re-state Governor Romney’s assertion to make it seem more reasonable, in proportional terms. As I demonstrate in this post, the 500,000 number still remains clearly wrong, even after adjusting for labor force size. This is shown in the figure I generated at the time:
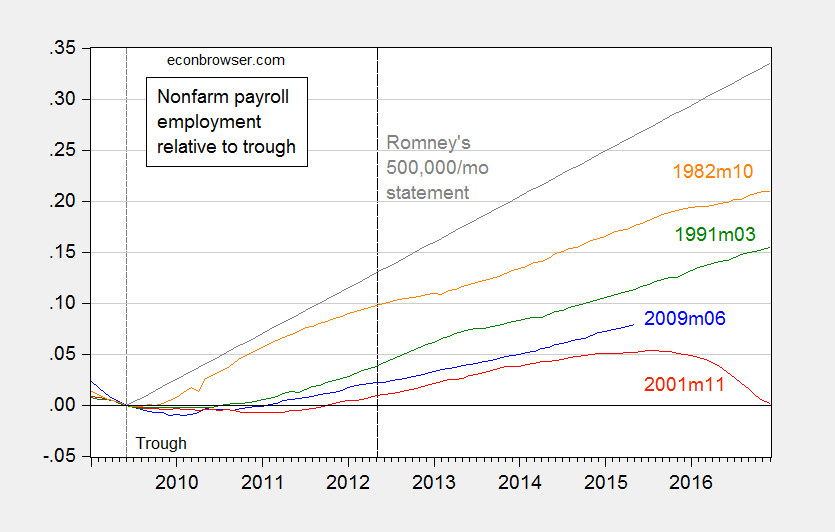
Figure 3: Log nonfarm payroll employment relative to 2009M06 trough (blue), to 2001M11 trough (red), to 1991M03 trough (green), 1982M10 trough (orange). Long dashed line at 2012M05 at the time of Governor Romney’s remarks. Source: BLS, May 2015 release, and author’s calculations.
Then the claim becomes aspirational, rather than factual. Quoting Mr. Stryker again:
…
Setting ambitious but reasonable goals is just what a future President should be doing. Supporters of the current administration understand that they need to lower expectations however. It was amusing to read erstwhile ecstatic now lukewarm Robert Deniro’s remarks to NBC’s David Gregory, which probably sums it up well for administration defenders: “..it’s not easy to be President of the United States.” And: “I know he’ll do better in the next four years…”
This process of changing the goalposts is the surest sign of someone knowing they have lost the argument, but refusing to admit error. Even Governor Romney subsequently changed his claim to 250,000 new jobs/month as being standard.
So kids, don’t be a “Rick Stryker”. Admit when you’ve made a mistake.
For other mistakes to avoid, see Rookie Economist Errors
Update, 10/13 4:45pm Pacific: The pseudonymous Rick Stryker keeps on digging. Below are two graphs — the first of month-on-month employment growth, and the 0.38% threshold that Stryker mentions as equivalent to Governor Romney’s 500,000/month employment growth, and the second as trailing 12 monthly average. The second highlights just how rare it is for the 500,000/mo figure to be realized over anything like a continuous time frame in recent decades, even when expressing in proportional terms as Rick Stryker suggests.
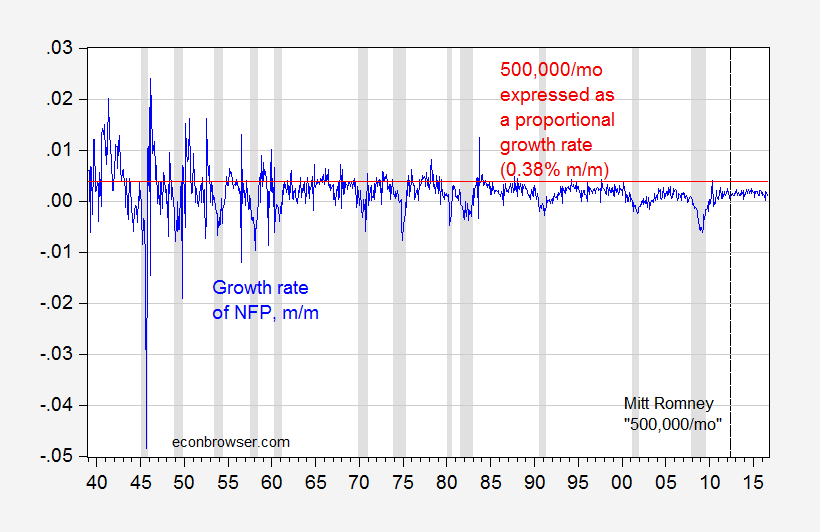
Figure 4: Month-on-month growth rate of nonfarm payroll employment (blue), and 0.38% threshold (red line). NBER defined recession dates shaded gray. Source: BLS, NBER, and author’s calculations.
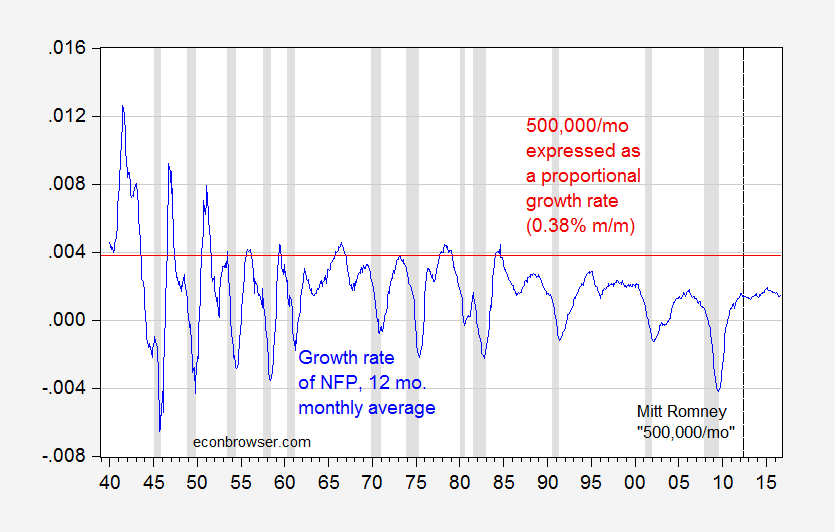
Figure 5: Trailing twelve month monthly average growth rate of nonfarm payroll employment (blue), and 0.38% threshold (red line). NBER defined recession dates shaded gray. Source: BLS, NBER, and author’s calculations.
Looks like one has to go way back to get the 500,000 norm to be reasonable…
Update, 10/17 4:15pm Pacific: In the interest of comprehensiveness, let me note an error I made, involving Rounding Errors (first noted in this post).
In principle, real quantity = total value/price deflator. For instance GDP09 = GDP/PGDP09, where GDP is measured in $, PGDP09 is the GDP deflator taking on a value of 1 in 2009, and GDP09 is GDP measured on 2009$. In practice, there is a slight rounding error, which typically does not make a difference, but can if (1) growth rates are very high (or very negative), and (2) one is annualizing quarterly growth rates.
I used the manually deflated series for the 2008Q4 q/q calculation, when in this case it would have been better to use the real series reported by BEA to do the calculation.
Figures 6 and 7 show the rounding errors.
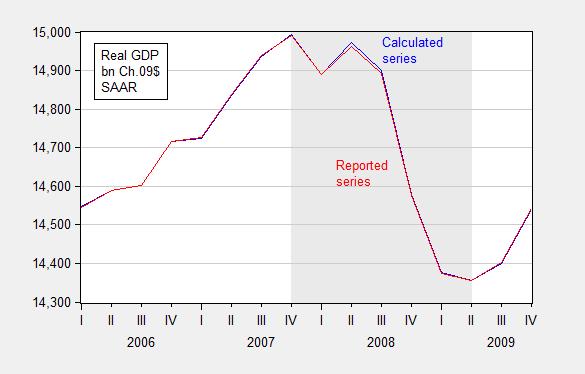
Figure 6: GDP in bn. Ch.2009$ SAAR, calculated by deflating nominal GDP with the GDP deflator (blue) and as reported by BEA (red), FRED series GDPC1. Source: BEA 2014Q2 2nd release and author’s calculations.
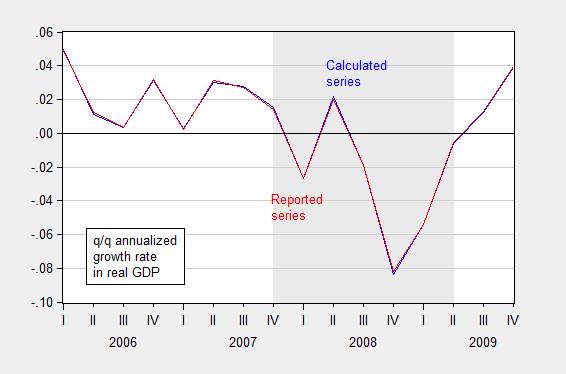
Figure 7: Quarter-on-quarter annualized growth rate in GDP in bn. Ch.2009$ SAAR, calculated by deflating nominal GDP with the GDP deflator (blue) and as reported by BEA (red), FRED series GDPC1. Source: BEA 2014Q2 2nd release and author’s calculations.
Did Romney state a time frame for 500,000 jobs per month? He did say in a normal recovery (from a severe recession). At full employment, it’s estimated 100,000 to 125,000 jobs per month are needed to keep up with population growth.
In the 13 months from June ’83 through June ’84, 372,000 jobs per month on average were created. In the 10 months from September ’83 through June ’84, an average of 435,000 jobs per month were created.
Peak Trader: No.
See this clip.
Menzie,
I haven’t admitted a mistake because I have made no mistake. I merely corrected your rookie economist error. I haven’t bothered to respond to this in the past since it’s so ridiculous.
You started all of this way back in 2012 in your post, saying
“Governor Romney has stated that employment growth should average about 500,000 after such a recession [1] This job growth has occurred exactly 16 times since 1939 (the sample available); the last time it occurred was May 2010. It never occurred during the administrations of the G.W. Bush. September 1997 (during the Clinton administrations) was the previous episode. (see also [2]).”
You misquoted Romney when you claimed that he said employment growth should average 500K per month after a recession. He didn’t say that. But let’s leave that aside. My focus was on your silly statement that 500K job growth in a month has only happened 16 times since 1939. The rookie economist mistake you made was to compare changes of levels of a series at different points in time when that series is growing. What you should have done is to translate Romney’s claim on a change today into percent terms and then compare percents across time. I did that and the job growth that Romney was talking about happened 172 times since 1939.
In your followup post, you did express Romney’s point in percentage terms as you should have in the first place, but then you “moved the goal post” by truncating your sample to just include the last 21 years. But I never made any statement about what happened over the last 21 years. I made a statement about the period covered by your original statement, from 1939 on.
You followed up 3 years later with the chart you have reproduced above. In that case, you moved the window back from 21 years to the early 1980s. But that’s still moving the goal post. Your initial claim was about the period 1939 on and I did my calculations over that period as well. I said nothing about shorter periods. I can understand why you want to move the goal post. Your original point over the period 1939 to the present is false when you do a proper comparison.
I merely pointed out your rookie economist mistake and therefore have no mistake to acknowledge. You, on the other hand, have never acknowledged your basic error.
Rick Stryker: If all this is true, why did you then say “Admittedly, the last time we saw sustained increases of 0.38% of current labor market levels was during the recovery from the 1982 recession. But that just implies that Romney is setting an ambitious but not historically unreasonable employment goal.”
That seems to be a “normative” statement rather than a “positive” statement.
Now let me go back to what “one should expect”, numerically. Sure, go back to 1939, you get 171 times you broach the 0.38% m/m growth. What about since 1967? 56. What about since the great moderation (1986+)? 5.
What is the longest consecutive run of m/m growth > 0.38% during the Reagan recovery? 4 months, 1983M11-1984M2. And that’s during a period of drastically different demographics (women participation rates are still rising, for instance, the labor force is younger, etc., etc.).
You still haven’t answered why Mitt Romney subsequently dropped his number (be it positive or aspirational) to 250K/month.
Menzie,
Let’s just stick to the point. You accused me of making a mistake. But the mistake you allege is, as you put it the current post,
“As I demonstrate in this post, the 500,000 number still remains clearly wrong, even after adjusting for labor force size. This is shown in the figure I generated at the time:”
That figure you produced looks at the data from 1982 on. But I did not making any assertions about 1982. I made an assertion about 1939 on. I did not make the mistake that you allege.
Rick Stryker: Your mistake is here:
So you are saying that we should to the 30’s, 40’s and 50’s for guidance on what growth rate we should expect? Then we should use the 1945M10-1948M11 expansion as a guide. Governor Romney should’ve said 565,000/mo was the norm (using your 133 million labor force number).
I shudder at what “analysis” you do at your company. I add two figures to the post to demonstrate the frequency at — and period during which — the 0.38% threshold has been breached.
Hmmm. Is it just a coincidence that all the examples are conservatives?
Rick Stryker: No, it’s not a coincidence at all. Between the Heritage Foundation, the Pacific Institute, and people like you, conservative commentary these days constitute a particularly “target rich environment”.
And thanks again!!!! — I need more examples for my students.
I did not think it was a coincidence either. Conservatives are a gold mine of rookie mistakes you can teach to your students.
I think your students are learning something important about how to conduct themselves in class and during office hours. They are also getting some good hints on what are and are not acceptable paper topics.
Rick Stryker: Why speculate? Here are paper topics from last year’s versions of my current courses, for open economy macro, and for the financial system. If you can find an ideological thrust to the paper topics, then please tell me and I will expunge the offending components.
rick, in previous conversations you said you were still supporting trump. in your defense, it was prior to this recent string of incidents occurred. are you still supporting trump, in light of recent allegations and evidence?
Menzie, in contrast to the implications of this post, it is not Rookie Mistakes that are damaging the efficacy of economists. It is actually economists like you that show very advanced economics but in a very biased way. You, like most economists on both sides of the aisle, ignore data and stats that oppose your political party while honing in on things that support your political position.
Anonymous: If you think what was in this post constitutes “advanced economics”, you are sorely misinformed regarding economics.
***slow clap***
Menzie,
I find your last comment telling, as it reveals how uninformed you are on this question. As you put it,
“So you are saying that we should to the 30’s, 40’s and 50’s for guidance on what growth rate we should expect?”
Yes, I am saying that we should use more rather than less data as a general rule. And yes, I am saying that we should be looking at data beyond the early 1980s to the present in the US. If you think that’s a “mistake,” then you really need to acquaint yourself with some recent research on this question.
For example, Bordo and Haurbich in “Deep Recessions, Fast Recoveries, and Financial Crises: Evidence From the American Record,” NBER WP 18194, (2012), ask whether robust recoveries follow relatively deeper recessions. In their analysis, they go back farther than 1939, examining 27 US cycles, starting in 1882. In a related series of papers, Barro and Ursua in “Macroeconomic Crises since 1870,” NBER WP 13940, (2008) and Barro and Jin in “Rare Events and Long-Run Risks,” NBER WP 21871, (2016) extend the empirical analysis to as many as 42 countries over long horizons, going as far back as 1868 for a couple of countries.
We can argue about the reasons the current recovery has been slower than what we’ve seen or would have expected historically. We can debate whether stronger recoveries follow harsher contractions. We can argue about whether the stimulus mattered or if it did, whether it was big enough. But you cannot claim that I have made a “rookie mistake” because I would look at data that prominent researchers who examine this question have also used.
You really show your bias when you propose to throw away data that does not agree with your preconceived view. You have not established that I have made any mistake. You should retract this post and apologize. Otherwise, you should include Barro, Ursua, Bordo, Haurbich, and Jin in your list of rookie economist mistakes.
Of course, given your obvious bias, you will not retract and apologize. I am sure you will find a new “mistake” to charge me with instead.
Rick Stryker: Thank you. You are right, you have inspired me. I think the next post will be on using data from the 1800’s to predict employment growth in the 2010’s. That seems to be the logical implication of your point.
One question: who is Haurbrich?
Those papers are about the characteristics of contractions and subsequent expansions as measured by output changes (and consumption) using long time series and across many countries. Of course, output changes and employment changes are related. You might consult an undergraduate macro textbook for more explanation before you do the post you contemplate. See, for example, Okun’s law.
Rick Stryker: Thanks for the pointer; I know what Okun’s law is — see here. I’m all for using additional data, cross-country/historical, but in order to get 500K/mo to be a norm, are you saying Romney was asserting GDP growth under counterfactual was really high at same time as productivity growth would be substantially lower than prior to his statement? (You do notice that consumption is a summary statistic in the Barro papers…?)
Menzie,
Well I’m glad you don’t think using more data is a mistake.
You are now asking me to read Romney’s mind with your current question. As I’ve said a number of times, I don’t think this issue is worth debating, but I do object if you allege I’ve made some kind of mistake. You interpreted Romney’s words one way–that he was saying that 500k/month is what you should expect on average in a normal recovery as matter of fact–even though he never said that. If he actually said what you claim he said, you’d be right and get no argument from me. I interpreted his words another way–as an ambitious goal offered in a middle of a political campaign.
You’ve made your worldview clear once again in this post: you believe all conservatives make mistakes and only conservatives make mistakes. You are therefore eager to put the worst interpretation on Romney’s words. I believe all people make mistakes, and since conservatives are people, conservatives make mistakes. But I don’t believe only conservatives make mistakes. Romney is a highly effective, intelligent person and so I do not believe that Romney meant what you claim. You think that because Romney is a conservative, he can’t be a highly effective, intelligent person. Therein lies the real difference between us.
Rick Stryker: OK, so you’re right — 500,000 is to be expected in a normal recovery as long as the “normal recovery” takes place in a period excluding the previous 21 years before Governor Romney’s remark (to be charitable — that rate occurs only a few months in the Reagan recovery, and not 3 years post-trough — it’s more like one needs to go back Kennedy-Johnson recover to see this rate). Look at Figure 5, for goodness’ sake.
rick,
“Romney is a highly effective, intelligent person…”
according to your man donald trump, romney is a loser, as quoted in washington times:
“The guy is a stone-cold loser,” Mr. Trump said told supporters during a rally in Tampa early Saturday.
apparently, not all republicans view romney with the same level of adulation as rick stryker. that includes your candidate for president.
Rick Stryker:
To Menzie’s defense, he has admitted to some of his own rookie economists errors. Strangely enough however, he doesn’t reproduce his very own extremely elementary mistakes in these “tutorials” for his students. Let’s be honest though, these posts aren’t “cautionary notes for [his] students”. He could very easily provide such teachings via powerpoint as supplemental class notes. No, this is yet another effort (akin to habitually calling out his commentators as he has done here (again) with you) for Menzie to boost his ego. It’s sad…. but fun!!!!
rtd: I don’t know how one is “calling out” anybody when both you and and Rick Stryker are anonymous. I’m not sure what rookie mistake of mine you are mentioning; the one you cited, involving rounding error was discussed in this post.
What? Seriously? You purposely call out commenters all the time. Anonymity
Yes, that was a rookie mistake (rookie being overly generous). Funny how both links are…… the same. And, moreover, you conveniently don’t reference it to assist your students in avoiding such elementary (egregiously embarrassing) mistakes. Moreover, elementary being true in its simplest form. If a phd with decades of experience is subject to making such egregious grade school-level errors, it would be worth noting for undergrads and grad students alike. Again and again.
rtd,
It’s pretty ironic that in a post on rookie economist mistakes Menzie selects another post to highlight in which he himself made one. I asked Menzie to acknowledge the rookie economist mistake of comparing changes in levels across time in a series that is growing. But he won’t do it.
Very interesting for rookie economists and experienced ones :
http://www.zerohedge.com/news/2016-10-15/here-are-hillary-clintons-three-speeches-goldman-sachs-which-she-was-paid-675000
These connections are not mentioned even in Menzies book.
John, there is no talk about crooked Dems on this the oh-so-partisan side of Econobrowser. Even when the Dem running for President is an unindicted criminal…we just pretend she doesn’t exit and focus on conservatives. She even has an economic plan too — typical dem plan of more taxes, more regulations (well, if you ignore her speeches to GS) and more spending–that will likely lead to more Obama-like growth…….of 1+%. So, let’s talk about Romney…..even as Strker makes Menzie look like a complete economic idiot. And let’s ignore what Dems do best — crush the middle class with Obamacare (higher premiums, higher co-pays and deductibles, and less access to health care), crush inner-city minorities by supporting teacher unions over students so most graduate with no skills…and then support a higher minimum wage making it even more difficult to find a job, crush high paying jobs by opposing fossil fuels, crush lower-paying jobs by supporting illegal immigration, and ensure more terrorism by not sealing the borders. What a party!
can you say right wing echo chamber!
Alongside your rounding goof, please be sure to mention (for the sake of future economists) the rookie error of callousness & extreme sloppiness with data:
“rtd: Sorry, the minus sign was omitted originally; it’s –2.77%.”
Also, the rookie error of callousness & extreme sloppiness with formulas (x2):
1) “spencer: Yes, I was lazy and using the operator precedence of exponentiation and multiplication before addition/subtraction.”
2) “and the 2009Q4 2008Q4 q/q annualized growth rate was -8.35 -8.19%” (strikeouts didn’t paste)
All this from a single post authored by a (non-rookie) economist! Since that day, I shudder on every Menzie Chinn Econbrowser post with graphs accompanied by the ominous phrase “and author’s calculations.”