Gavin Davies in the FT has an interesting article about how survey/sentiment based information and hard data have diverged. Here is a picture of US GDP, from the official BEA series (3rd release), Macroeconomic Advisers, and e-forecasting, as well as the Atlanta Fed nowcast.
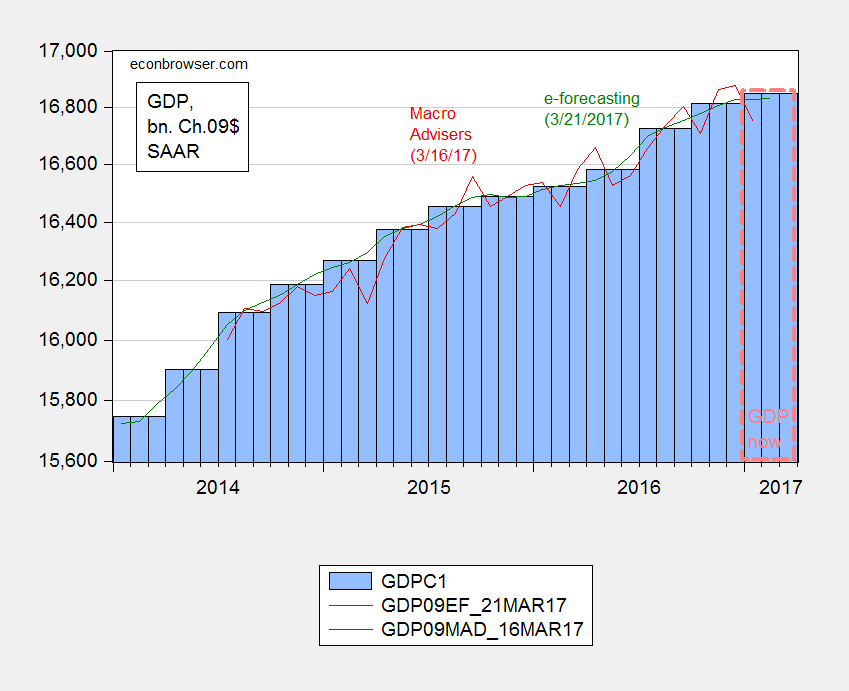
Figure 1: GDP from BEA (blue bars), Atlanta Fed nowcast of 31 March (blue bars/orange dashed box), Macroeconomic Adviser (red line), e-forecasting (green line), on log scale. Source: BEA 2016Q4 3rd release, Atlanta Fed via FRED (3/31), Macroeconomic Advisers, e-forecasting.
There is a distinct flattening out — although it’s important to recognize the Atlanta Fed nowcast at 0.9% growth SAAR is considerably below, for instance, the 2.72% from the St. Louis Fed. Macroeconomic Advisers forecasts 1.0% for 2017Q1.
On the other hand, the indicators that the NBER Business Cycle Dating Committee looks at suggest continued growth (although all these variables are subject to revision, so I won’t “pull an Ed Lazear” and say “no recession”).
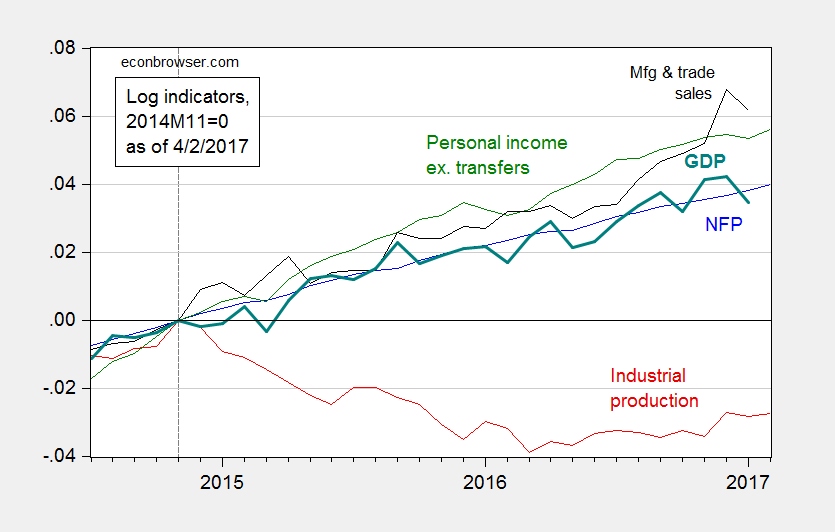
Figure 2: Log nonfarm payroll employment (blue), industrial production (red), personal income excluding transfers, in Ch.2009$ (green), manufacturing and trade sales, in Ch.2009$ (black), and Macroeconomic Advisers monthly GDP series (bold teal), all normalized to 2014M11=0, all as of April 2nd. Source: BLS (March release), Federal Reserve (February release), Macroeconomic Advisers (March 16), and author’s calculations.
it’s a widespread phenomena…the soft PMIs and Fed surveys vs the hard factory data, the record high consumer confidence vs flat real PCE, etc.
Credit seems to be collapsing.
This was from the WSJ’s Daily Shot.
To receive it (highly recommended for graph junkies), sign up here: https://www.wsj.com/newsletters
I don’t believe you have to be a subscriber.
The industrial production data understates the improvement over the last few months. Manufacturing and mining production have been robust. Most of the IP weakness is in utilities. I consider the manufacturing and mining industries to be more cyclically sensitive.