Kansas employment nosedived in June, and has bounced back since the Brownback tax cut was rolled back. Kansas employment is catching up with Missouri after lagging. The Philadelphia Fed’s coincident and leading indices also point to a recovery in Kansas.
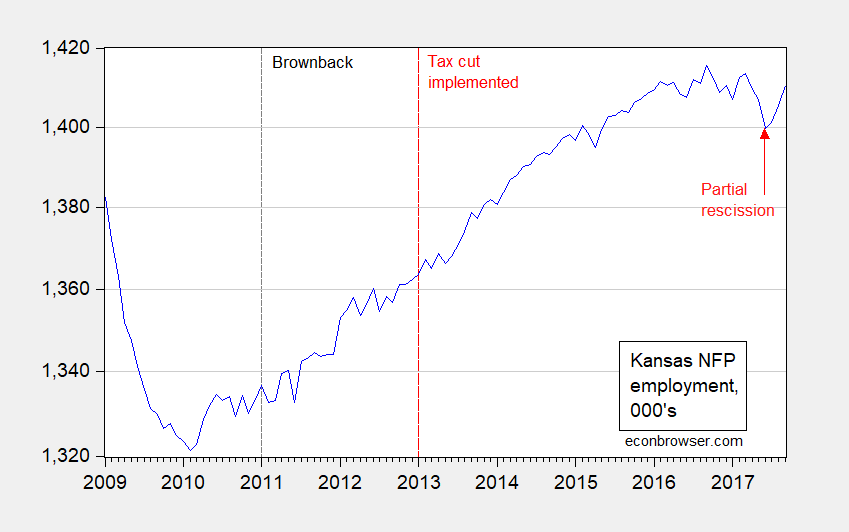
Figure 1: Nonfarm payroll employment in Kansas (blue), on log scale. Source: BLS.
Notice that NFP employment dives, then rebounds with rescission. One might think that this is a function of government employment declining with budget troubles, but a similar pattern obtains when examining private NFP.
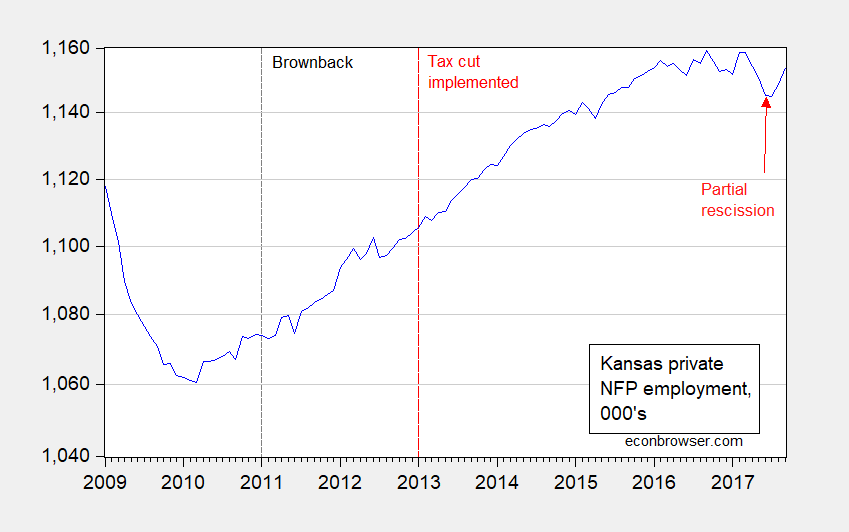
Figure 2: Private nonfarm payroll employment in Kansas (blue), on log scale. Source: BLS.
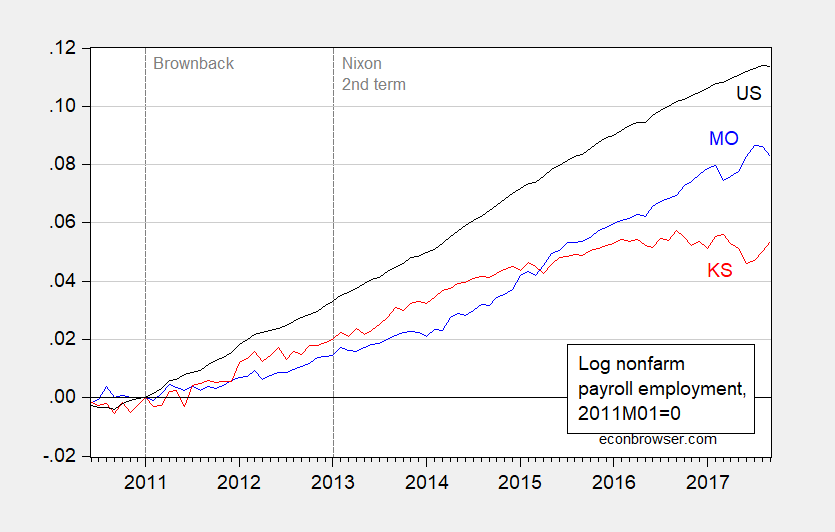
The fact that Kansas employment has recovered means that Kansas is no longer losing ground relative to Missouri employment.
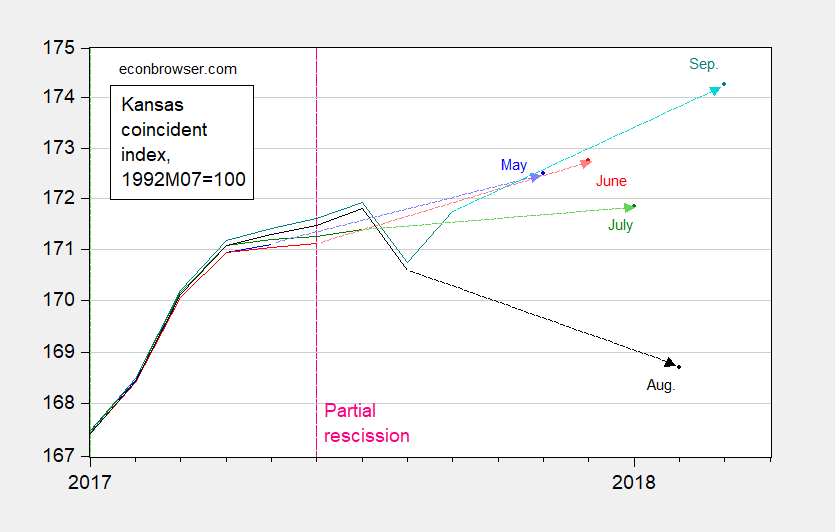
Coincident indicators dove in August, but has recovered as of September. This is shown in Figure 3.
We don’t know the impact on GDP, since data has only been released up to 2017Q1. However, it’s clear that Kansas GDP has been lagging. One study suggested a Kansas recession began in mid-2016.
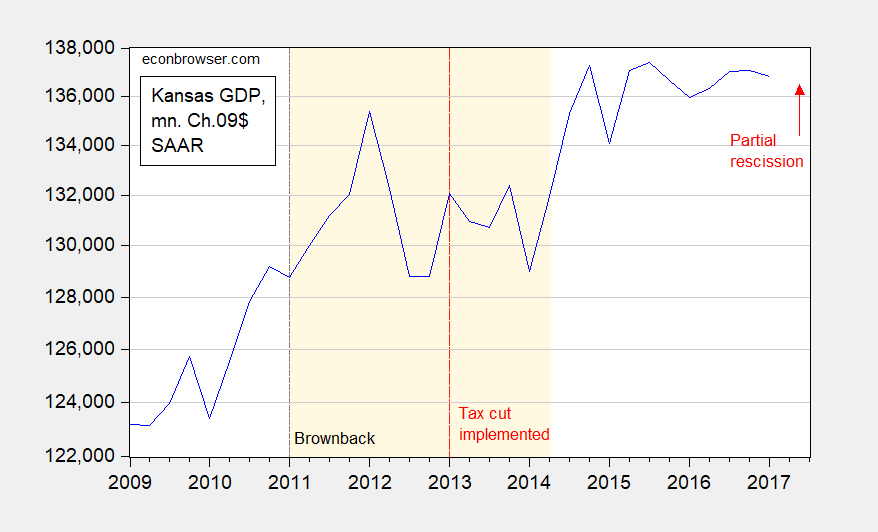
Figure 4: Kansas GDP (blue), mn Ch.09$, SAAR, on log scale. Light brown shading denotes drought. Source: BEA.
We’ll have to wait and see whether GDP recovers as suggested by the Philadelphia Fed’s leading indices. But for now, the experiment is over. We can now see, depending on whether the Republican tax cut currently proposed, passes and we see a similar outcome (thinking about the pass-through provisions, increases on tax burden on middle-income households, and accompanying spending cuts).