And we are less than one-third of the way through November.
Cumulative casualties seem to be rising at a faster and faster pace.
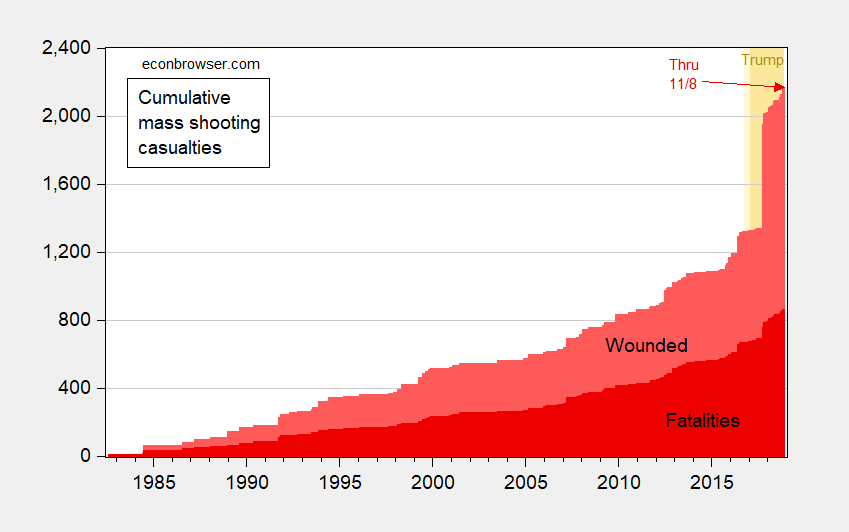
Figure 1: Cumulative mass shooting fatalities (dark red), non-fatal injured (pink), from 1982M08, through November 8, 2018.. Orange denotes 2017M01-2018M11, light orange 2016M11-2017M01. Source: Mother Jones, accessed 11/8/2018, and author’s calculations.
The frequency of mass shooting events seems to be increasing. A negative binomial count regression (estimated using QML) indicates 1.6 more events per month under Trump (estimate statistically significant a 1% msl).
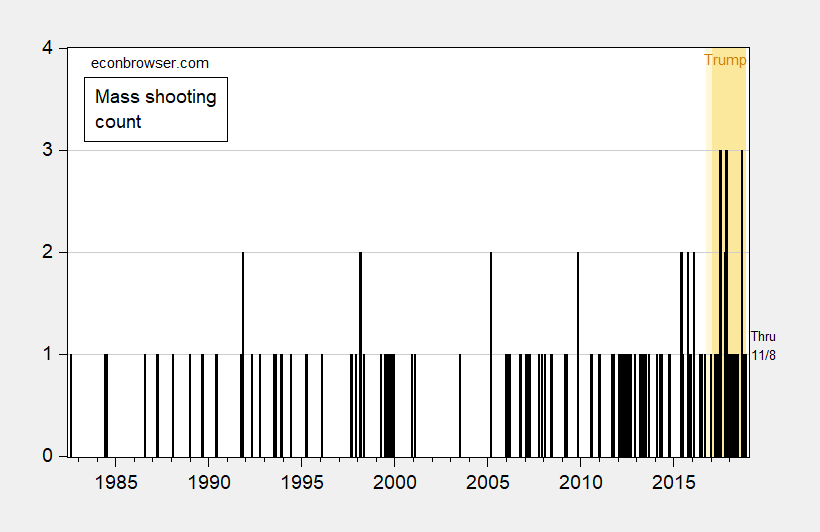
Figure 2: Mass shooting event count, from 1982M08, through November 8, 2018.. Orange denotes 2017M01-2018M11, light orange 2016M11-2017M01. Source: Mother Jones, accessed 11/8/2018, and author’s calculations.
Fatalities are increasing over the Trump era.
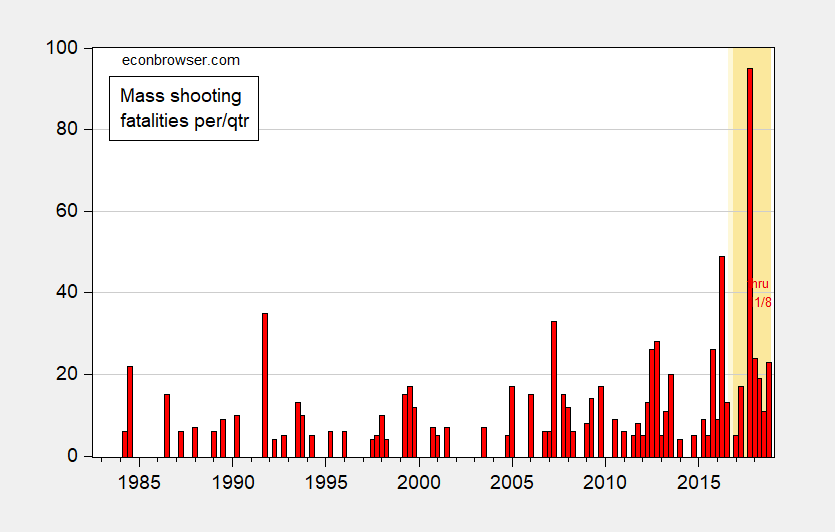
Figure 3: Mass shooting fatalities per quarter, from 1982Q4, through November 8, 2018. Orange denotes 2017Q1-2018Q4, light orange 2016Q4-2017Q1. Source: Mother Jones, accessed 11/8/2018, and author’s calculations. [graph modified 11/9 to put into quarterly frequency]
Regression 1982q4-2018q4:
f = -6.19 + 0.028pop + 5.590trump
Adj.R2 = 0.21, N = 145, DW = 2.09, bold denotes significance at 10% msl using HAC robust standard errors.
Where f denotes mass shooting fatalities, pop is population in millions, trump is a dummy variable for Trump administration (all on monthly basis, estimated using quarterly frequency data)
On a quarterly basis, the regression is:
f = -18.51 + 0.084pop + 15.344trump
Adj.R2 = 0.19, N = 145, DW = 2.08, bold denotes significance at 10% msl using HAC robust standard errors.
[edits in italics 11/9, noon Pacific]
One can interpret this as follows: a Trump administration quarter month is associated with 5.6 greater fatalities from mass shootings, or 22.4 67.2 on an annualized basis. (Over 1982q4-16q4, the average fatalities per quarter is 4.876 14.6). Inclusion of a deterministic time trend yields a negative coefficient on population, and a trump coefficient (12.03) significant at 1% msl.
Data: [xlsx] as of 11/8/2018.
Update, 11/10/2018, 1:30PM Pacific: Reader Sam thinks I should conduct some out of sample validation. He also conjectures I am misleading readers by reporting only 10% significance levels. I address his argument that I don’t understand out of sample cross validation in this post.
Here is a bar chart of Trump dummy coefficients, with HAC robust standard errors. I show *** for 1% msl, ** for 5% msl.
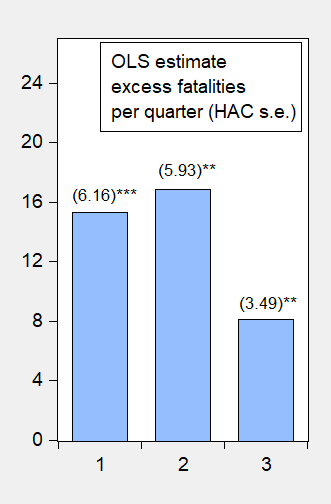
Figure 4:OLS regression coefficients with all fatalities from mass shootings (bar 1), excluding shootings by Muslims (bar 2), excluding Las Vegas shooting fatalities (bar 3).
WOW. I consider myself “well read” (at least on major news events certainly) and looking at that Mother Jones Google Doc is borderline shocking. Hard to fathom. I believe all of it—but still hard to fathom and digest. The parents, the children, the Uncles, the nieces. the best friends, the soon-to-be marrieds, “Lifetime partners” with no plan to marry but plans to share life. The mentors to children and mentors to college age. On and on and on. Gone. Well, we still have the NRA. No chance of ever losing THAT. The NRA will always be there to smear candidates for office who say “Can’t we do just a little better??”
This man, Drew Edmondson, strongly advocates for 2nd Amendment gun rights.
https://youtu.be/3EBq2C42l8U?t=447
But that wasn’t “good enough” for the NRA, which worked doubletime at smearing the man, and basically did so much as to imply Edmondson wanted young women to be violated.
https://www.youtube.com/watch?v=VYgS9MisBg4
Apparently, Trump can incite people to mass murder. Okay, that’s out of the way. No, really, I’m not laughing that hard.
“About half of the attackers, around 54%, had a history of drug or substances abuse, and 20 of them — about 71% — had histories of criminal charges beyond minor traffic violations. Nearly two-thirds of suspects experienced some sort of mental symptoms ahead of their attacks, though only 25% had been hospitalized or prescribed medication.”
http://www.nydailynews.com/news/national/america-mass-killers-2017-common-article-1.3903504
But I do appreciate Menzie’s attempt at humor… trump is a dummy variable. Cute; subtle. And the “light orange” shading on the graph. Oh, that’s precious. Subliminal.
i think you’re putting too much weight into too few observations.
Some things to make your analysis more convincing 1) show the if predictive accuracy increased with a trump dummy OUT OF SAMPLE or 2) try placing the ‘trump dummy’ variable a few months before or a few months after and see if that changes the coefs. i doubt you’ll see much of an effect.
sam: Interesting points. On both, you are incorrect. See here.
I’m concerned you don’t know what oos validation is. Here is the Wikipedia page https://en.m.wikipedia.org/wiki/Cross-validation_(statistics). Basically you split data into parts; train on one part and get error statistic for other part.
So you should run two regressions (with and without dummy) and compare the mean squared error out of sample of each model.
Also be sure to run regression on rates not cumulative fatalities… your chart is cumulative.
Share the results of 1) if you did.
Finally you use .10 level for statistical significance. I’m assuming you use that and not .05 is because it’s not stat sig at .05. Please report t stats
Sam: Thanks for your edifying comment. Gee. I never knew these things! And they’re all on Wikipedia! Wow.
If you had bothered to click through to the linked post, you could’ve seen that the regressions are in levels. The data is online, so you can download it yourself to check things. I use 10% so I don’t have to do italics, bold, and underline in the regression equations to denote various levels of significance. But thanks for ascribing such mendacious methods to me.
I like to see how far I can take it sometimes with Menzie (actually, I have to say he’s a very good sport about it, which is horrid, because then I can’t get super angry at him and take cheap shots at Menzie, which practically takes all the fun out of it for me) and see what mischievousness I can get past the blog filter. OK, cross your fingers kids (BTW, the first slightly old lady answering the door is my favorite)
https://www.youtube.com/watch?v=f5xLNypFrV4
Professor Chinn,
Thank you for posting the data. I had manually tediously summarized the data by quarter from the monthly data. I notice that entering the monthly data into EViews and then dragging the data to a file with quarterly dates, the quarters show fractional entries, while my quarterly data showed non-fractional sums of the monthly data by quarter. This difference in the data entry is the reason that my regression model was different from yours. The method I used shows: f=-19.6 +0.088POP + 15.130trump. Adj. R^2 =0.19, N=145, DW=2.09.
Using the conversion of the monthly data to quarterly data by EViews, I get the same model as you present.
AS: You should set the series conversion option before dragging the series between worksheets. I think I used cumulate but I might have done it wrong….
AS: I used average instead of cumulate in the fatalities regression. I’ve corrected and put up new text (in italics). The previous numbers were per month rather than per quarter I have not included the per quarter estimates using quarterly data to estimate.
Thanks for flagging (a typical Trump quarter is now worse, by factor of 3…)
Professor Chinn,
My regression model now agree with yours using your monthly data extracted from Mother Jones converted to summed quarterly data. I had to use copy and paste special in order to choose summed monthly data. on the quarter tab. I am not familiar with the ability to set the sum conversion option when dragging data from monthly to quarterly frequency tab.
I may have a typo on my manual summed fatality data, since the numbers are off a bit from yours as previously shown in my post.
Thanks
Menzie It looks like the Dec 8, 2004 shooting is not included in your COUNT graph.
“trump is a dummy variable”
once again, menzie’s analysis is spot on 🙂
the trump response to this increase is simply more violence. guns at the doors of schools and churches. and the death penalty. now many of these folks are suicidal, so the death penalty is simply an appeal to his base’s animalistic instincts, not a true solution.
It’s a little unlike Menzie to leave comments un-updated immediately after a post. Is the world of Wisconsin turning upside down and Tony Evers is a wise man who gave possibly the best economist in his state a phone call to help him set state economic policy???? Naaaaaaahhh!!!!! Shit like that only happens in Seinfeld’s “Bizarro world”, not in MAGA world. What the hell was I thinking?!?!?!?!?
https://www.youtube.com/watch?v=vnXOAWoNADw
There is a saying in journalism: “Where there is smoke there is usually fire.”
Scientists and academics are supposed to be held to a higher standard. But then this is a blog, not a peer-reviewed journal so some loose speculation is more than permissible. But let me stop trying to eruditely beat around the bush and express my own opinion:
Donald Trump’s rhetoric incites violences, in many cases deadly violence.
To the Americans that support this rhetoric: your actions are self-loathing. You probably have no idea how the American brand is being damaged, and how American hegemony and all its privileges are being eroded.
off topic, but for all those anti-renewable critters, seems renewables are economically positive in of all conservative states, TEXAS!
https://www.chron.com/business/energy/article/Report-Renewables-have-saved-Texans-nearly-5-13374580.php