Retail sales jumped 9.8% m/m, exceed Bloomberg consensus of 5.9%. Sales ex-food services rose 9.4% in nominal terms, 8.7% if deflated by the CPI-all.
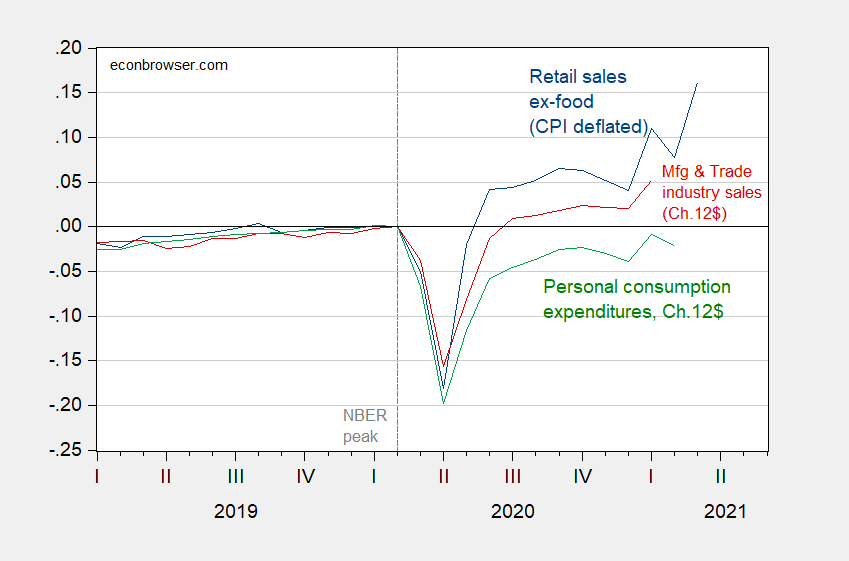
Figure 1: Retail sales excluding food services, deflated by CPI-all (blue), manufacturing and trade sales in Ch.2012$ (red), personal consumption expenditure deflators in Ch.2012$ (green), all seasonally adjusted. Source: Census Bureau, Federal Reserve Bank of St. Louis, BEA, BLS via FRED, and author’s calculations.
Retail sales ex-food services, deflated by the CPI, kind of tracks manufacturing and trade industry sales, which I’ve been monitoring, following the NBER. It also moves with consumption — but in both cases deflated retail sales have risen faster than either of the latter two series, measured in Chained 2012$. Nonetheless, the fact that retail sales, which is released before the other two series, leads to hope for continued recovery in consumption.
Update 4/16, 5pm CT:
Reader rjs takes issue with deflating retail sales ex-food services with the CPI. I agree, although CPI-all is a pretty transparent variable to deflate by. I add a series deflated by PPI for final goods to Figure 1 (pink line), resulting in Figure 2 below.

Figure 2: Retail sales excluding food services, deflated by CPI-all (blue), deflated by PPI for final goods (pink), manufacturing and trade sales in Ch.2012$ (red), personal consumption expenditure deflators in Ch.2012$ (green), all seasonally adjusted. Source: Census Bureau, Federal Reserve Bank of St. Louis, BEA, BLS via FRED, and author’s calculations.
While using the PPI changes the contours of the series, it doesn’t really change the end-point as of March 2021. Maybe it will more substantively going forward.
To make this personal – since I’m still not eating out, bought some wine and will be making some tuna for dinner tonight.
and here pgl inadvertently makes the point i was about to make…retail sales may not forerun consumption as much as usual, because consumers have been switching their spending from services to goods…a lot of people took their stimulus and bought a big ticket item in March, but those stimulus payments lilely had little effect on eating out, air travel, going to entertainment venues, or elective medical procedures…
inadvertently? No it was deliberate. OK I did not write a long winded essay like some do.
If people are following public health guidelines I’m not against freedom of movement. We never really lost it, people were just asking to be intelligent about it to save lives. With the possible exception of my time in China, I’ve always been a bit of a hermit. I mean even when you drive semi, what % of the day are you not in your cab?? To eat and shower at truckstops. What an “adventure”. You’re looking at cities and many different aspects of nature, but how much “experiencing” of the places are you getting?? Really just getting a “vibe” or a “feel” of each place. You got no virus, even if you don’t have kids you’re dropping $15–$20 to eat out. Why the hell am I gonna do that when I can eat like a king at home for $5–$8, no wasted car fuel, no risk of accident, no sitting in a drive-thru, no worrying if Timmy the teenager spit in my food. It’s not much of a choice. I wanna eat microscopic feces at Chipotle for permanent damage to my kidneys???? NO thanks, you enjoy yourself.
“If people are following public health guidelines I’m not against freedom of movement. We never really lost it”
Please inform Jim Jordan of this fact. If I had been Fauci yesterday, I would called out Jordan for being a jacka$$.
https://www.nytimes.com/2021/04/15/opinion/andrew-yang-automation.html
April 15, 2021
Andrew Yang Hasn’t Done the Math
Was his economic story too good to check?
By Paul Krugman
Will Andrew Yang, the current front-runner, become New York City’s next mayor? If he wins, would he be any good at the job? I have no idea, although I’m skeptical about the latter.
My guess is that the mayoral office needs an effective political brawler, not an intellectual, and Yang, who has never held office, owes his prominence largely to his reputation as a thought leader, someone with big ideas about economics and policy.
What I do know is that Yang’s big ideas are demonstrably wrong. Shouldn’t that be cause for concern?
Yang’s claim to fame is his argument that we’re facing social and economic crises because rapid automation is destroying good jobs and that the solution is universal basic income — a monthly check of $1,000 to every American adult. Many people find that argument persuasive, and one can imagine a world in which both Yang’s diagnosis and his prescription would be right.
But that’s not the world we’re living in now, and there’s little indication that it’s where we’re going any time soon.
Let’s do a fact check: Are we actually experiencing rapid automation — that is, a rapid reduction in the number of workers it takes to produce a given amount of stuff? That would imply a rapid rise in the amount of stuff produced by each worker still employed — that is, rapidly rising productivity.
But that’s not what we’re seeing. In fact, the lead article in the current issue of the Monthly Labor Review, published by the Bureau of Labor Statistics, is an attempt to understand the productivity slowdown — the historically low growth in productivity since 2005. This slowdown has been especially pronounced in manufacturing, which has seen hardly any productivity rise over the past decade.
I made similar points * back in 2019, eliciting a furious response from Yang, who decried “incomplete statistics” and declared that “I’ve done the math.” But if he had done the math, he didn’t share it with the rest of us; all he offered were anecdotes. Yes, at any given time there are always some workers being displaced by technology. The question is whether this is happening faster now than in the past. The numbers say that it isn’t.
For what it’s worth, my guess is that Yang started preaching the dangers of automation without ever having looked at economic data; it was a story too good to check.
But even if we don’t think Yang is right about the problem, what about his solution? Is his universal basic income proposal a good idea?
No, it isn’t. It’s both too expensive to be sustainable without a very large tax increase and inadequate for Americans who really need help. I’ve done the math….
* https://www.nytimes.com/2019/10/17/opinion/democrats-automation.html
https://fred.stlouisfed.org/graph/?g=lSy9
January 30, 2018
Manufacturing and Nonfarm Business Productivity, * 1988-2020
* Output per hour of all persons
(Percent change)
https://fred.stlouisfed.org/graph/?g=lSyd
January 30, 2018
Manufacturing and Nonfarm Business Productivity, * 1988-2020
* Output per hour of all persons
(Indexed to 1988)
Oh my – a lot of my friends are asking me to join the Yang Gang. Now who is Krugman supporting with that political brawler stuff? Some mob boss like Donald Trump? Spare us!
Mixed feelings. I do think Krugman landed an effective punch there. And I think if there are other candidates who have been working for the community longer than Yang has, then they deserve a hearing. There was a Black guy, I think from Queens, but I can’t swear to it, mentioned in that NYT article I believe I posted here a few weeks back. I’m not having any luck finding it and I cannot remember his name, but he struck me as a guy that could possibly be a better choice than Yang. I’m not even completely against the universal income thing, but this mating call he keeps reverting back to “automation” and it strikes me as a very shallow argument. When he keeps going back to “automation” it just strikes me as a shallow bullet point and it makes him look vacuous. I like Yang overall but he needs to get away from that.
“There was Black guy, I think from Queens”
Who rose from poverty to do well on Wall St.
I’m thinking of Raymond J. McGuire. 64 years old, born in Ohio, went to Harvard, and was a high executive for Citigroup. Of course there are tons of candidates it seems including Brooklyn’s borough President.
That may be the one, I’ll wait 48 hours to get around the NYT paywall and post his name in this thread. Not that it’s a big deal but on the surface scan he looked like a pretty good candidate. Black dude but had “gone to bat” for the Asian community around NYC. Historically, I’m speaking semi-historically here, Blacks and Asians haven’t always gotten along too well, so it speaks highly of the man he’s making strong efforts there, especially when the stereotype is Asians aren’t “active” in politics. My guess is Asians are way more active in the voting booth than people imagine, but. I don’t know, someone somewhere must have written a paper on it.
Eric Adams is the name I couldn’t remember, and yes he is the Brooklyn Borough president. I had confused he was in Queens because Queens has the high Asian population and I got the two things conflated in my mind somehow.
i’ve previously objected to using the CPI to deflate retail sales here before (it’s a pet peeve)…my objection is simple; it’s using a price index that is largely services, including a third rent, to adjust sales of goods, and it doesn’t make any sense to adjust sales of autos and TVs with prices for health care and rent…the proper way to adjust retail sales would be the way the BEA does, ie, use the corresponding price changes from the March consumer price index for each type of sales; ie, since nominal sales at clothing stores were 18.3% higher in March, the apparel price index was 0.3% lower, that means that real sales of clothing likely rose around 18.6%…but that’s pretty tedious (i used to do it) so i’ve developed a shortcut, which although inexact, usually gets me pretty close to what BEA will publish; i pull gas station sales, grocery & beverage sales and food services sales out from the retail total, and find that core retail sales were up by almost 10.9% for the month…since the March CPI report showed that the the composite price index of all goods less food and energy goods was 0.1% higher in March, we can thus figure that real retail sales excluding food and energy will show an increase of around 10.8%…then we adjust food and energy retail sales for their price changes separately, just as the BEA will do…the March CPI report showed that the food price index was 0.1% higher, as the price index for food purchased for use at home rose 0.1% while the index for food bought away from home was also 0.1% higher, (as prices at fast food outlets rose 0.5% and prices at full service restaurants rose 0.2%)…hence while nominal sales at food and beverage stores were 0.7% higher, real sales of food and beverages would be around 0.6% higher in light of the 0.1% higher prices…likwise, the 13.4% increase in nominal sales at bars and restaurants, once adjusted for roughly 0.4% higher prices, suggests that real sales at bars and restaurants rose around 13.0% during the month…and while sales at gas stations were up 10.9%, there was a 9.1% increase in price of gasoline during the month, which would suggest that real sales of gasoline were up on the order of 1.6% or 1.7%, with a caveat that gasoline stations do sell more than gasoline, products which should not be adjusted with gasoline prices, so the actual increase in real sales at gas station was likely greater….averaging real sales that we have thus estimated back together, and excluding food services, we’ll then estimate that the income and outlays report for March will show that real personal consumption of goods rose by around 8.9% in March, after falling by a revised 2.9% in February and rising by a revised 7.8% in January…at the same time, the 13.0% increase in real sales at bars and restaurants would boost March real personal consumption of services by more than 1%…
i know that even that seems like a lot of work, but once you’ve done it a few times it goes pretty quickly..
there’s two simple calculations for the above: first, core retail sales is the given retail ex gasoline minus groceries and food service:
( 572,704 – 71,969 – 62,170) / (521,885 -71,473 – 54,829 ) = 1.1087
then, ex food services, real goods is 13% groceries, 7% gasoline, & 80% core:
.13 * 0.6 + .07 * 1.9 +.80 * 10.8 = 8.851
the rest of it is just comparing retail to CPI indexes
@ rjs
Cool, you really are an intelligent after all. Now, lose the dress, keep the shoes.
I’m sorry, this muck, just above, has to be one of the dumbest comments ever posted on this blog. Why would you do something in a half-A** way, which is going to give you a much less accurate answer, for something professionals will give you for free if you can get your hands on a respected newspaper?? It’s about all I can do not to crack up while reading that. You’re not peaktrader’s tax accountant by any chance are you??
Why pay for it when the government experts are already doing the calculations? Unless you want hacks like Princeton Steve to charge clients even more money for his worthless data?
Moses, my argument is with FRED, who introduced that so called “real retail sales” graph years ago, which is consistently inaccurate and not “REAL”, at least the way that ‘real’ is used in national accounts…historically, retail sales deflated with CPI has understated real sales because services prices have usually been up by more than goods prices; this month it overstated real sales by obscuring the larger impact of higher fuel prices…if an accurate representation of real sales is as readily available as you suggest, then why do economic bloggers, including Menzie above, continue to insist on deflating retail sales with the services heavy CPI index?
BEA’s NIPA accounts notes most of consumption is indeed services. They separately identify nominal spending on services v. durable goods v. nondurable goods. And to make your life easier, here is the CPI for nondurable goods:
https://fred.stlouisfed.org/series/CUSR0000SAN
Yes a detailed analysis should be done and in fact it already is being done for those who search the databases.
rjs: I have added a PPI-final goods deflated retail sales ex-food svcs series to Figure 1 (see Figure 2 in addendum to post).
let’s try some more arithmetic and see if we can make Moses really go crazy….
since we now have estimates of the change in PCE goods for all three months of the first quarter, we can now estimate the contribution that PCE goods will make to 1st quarter GDP….the February income and outlays report gives the change in the Ch2012$ of PCE goods for the 4th quarter months as unchanged in October, down 1.2% in November, and down 2.2% in December…based on the revisions to retail sales in the March retail report, we now have PCE goods for January at +7.8%, PCE goods for February at -2.9%, and PCE goods for March at +8.9%…to simplify our calculations, we’ll now make PCE goods into an index, and set October with an index value of 100.00…thus Nov = 98.80, Dec = 96.63, Jan = 104.17, Feb = 101.15, and March = 110.15…hence, to figure out the growth rate of 1st quarter PCE goods, we have this calculation ( ((104.17 + 101.15 + 110.15) / 3)/ ((100 + 98.8 + 96.63)/ 3)) ^ 4 = 1.30021
that means that PCE goods rose at about a 30.0% annual rate in the 1st quarter…since PCE goods has usually been around 23% of GDP, that means the contribution of PCE goods alone to first quarter GDP will be around 6.90 percentage points…maybe the NY Fed and GDP Now should revise their 1st quarter estimates…
@ rjs
Vicious……. (joking)
I don’t need no stinkin’ arithmetic:
https://www.youtube.com/watch?v=4OcM23Hbs5U
My comment was way overly harsh, and in fact as much as it pains my ego /embarrasses me to say it, I learned something from your comments, and I should apologize to you. I am sorry. I will try to pay closer attention to these things in future as relates to services prices increasing vs good prices increasing, the difference thereof and how that is accounted for in indexes and “totals” of PCEs. No sarcasm, you have taught me something today. Now excuse me, I need to spray some Bactine on my ego boo-boo.