The goods production side of the economy continues to recover, consumption jumps, while other indicators faltered. Some key indicators followed by the NBER Business Cycle Dating Committee.
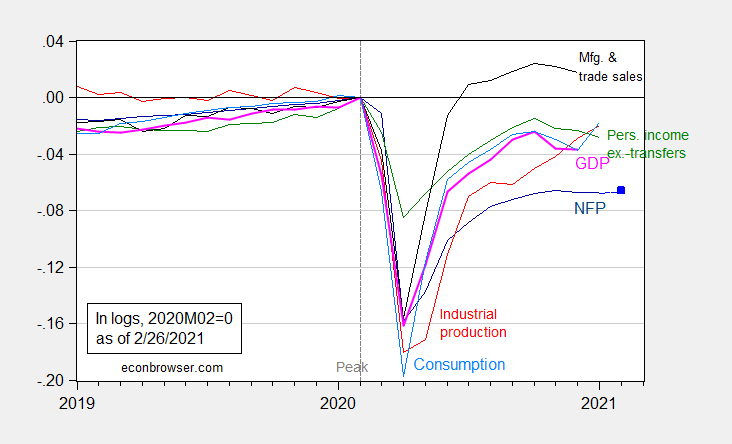
Figure 1: Nonfarm payroll employment (dark blue), Bloomberg consensus as of 2/26 for February nonfarm payroll employment (light blue square), industrial production (red), personal income excluding transfers in Ch.2012$ (green), manufacturing and trade sales in Ch.2012$ (black), consumption in Ch.2012$ (light blue), and monthly GDP in Ch.2012$ (pink), all log normalized to 2020M02=0. Source: BLS, Federal Reserve, BEA, via FRED, IHS Markit (nee Macroeconomic Advisers) (2/1/2021 release), NBER, and author’s calculations.
Manufacturing and trade industry sales data extends only through December; if retail sales are any guide, this series will recover with February’s data (there seems to be a lag, at least over the last two years).
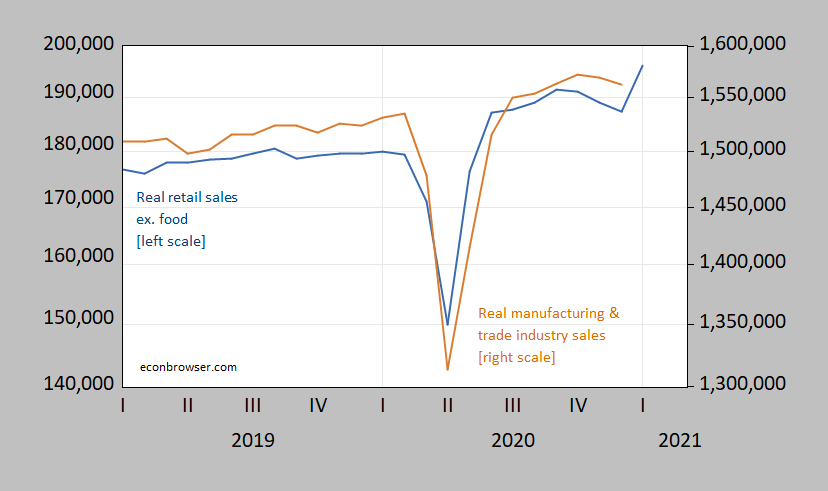
Figure 2: Retail sales ex.-food services, in 1982-84$ (blue, left log scale), and manufacturing and trade industry sales, in Ch.2012$ (brown, right log scale), both in millions of dollars, seasonally adjusted. Source: Census, BLS via FRED, author’s calculations.
As of today, Atlanta Fed, NY Fed, and IHS Markit have Q1 growth nowcasted at 8.8%, 8.7%, and 3.4% SAAR.
It’s interesting that the IHS nowcast is less than half the regional Fed ones. My sense (qualitative ‘feel’ rather than quantitative estimate) is that the IHS estimate may be closer to actual. Consumers around here seem to be buying groceries almost at the level they did last March and April when pandemic panic and sudden need to eat-at-home were operative, even though restrictions on dining out have been relaxed a couple times lately, but they’re not quite ready to spend on other goods at pre-pandemic levels. I can see a small breakout in spending on those other things occurring along with a small release of pent-up demand for dining out, bars, theaters, and other services, but people in this area finally started taking the virus seriously in January and finally altered their behavior. I think they got scared enough that reversion to pre-pandemic spending patterns may be a somewhat slow process rather than a discrete event. Of course, I may be completely wrong. Won’t be the first time, nor the last.
Consumers around here seem to be buying groceries almost at the level they did last March and April
Maybe not the March levels, but definitely the April levels:
https://tracktherecovery.org/
Last Spring there was a supply shock as suppliers had to shift production away from institutional buyers and towards individual consumers. If things get back to “normal” too quickly we’re likely to see the same kind of shock in reverse.
I’ve been grocery shopping and cooking at home for the past 50 weeks or so. At first grocery store prices went up a bit and choices went down. Things had gone back to normal but of late some of my favorite items have gone back up in price if there are even there. Oh well – at least NYC weather is getting a bit warmer.
“Maybe not the March levels,”
The monthly aggregate may not show it as much, but around here pandemic panic was in full swing during the last two weeks of March. I saw it first-hand. And, umm, the last I checked, the last two weeks of March are still March. Believe what you want but my statement is completely true.
I think you misunderstood me. The tracktherecovery.org link shows that grocery sales for March were extremely high and came down a bit in April. Grocery sales today are comparable to April’s sales but below March grocery sales.
‘Atlanta Fed, NY Fed, and IHS Markit have Q1 growth nowcasted at 8.8%, 8.7%, and 3.4% SAAR.’
Now if we can somehow sustain 8% for the entire year, we may be back to full employment by the beginning of 2022. But of course I’m counting on Congress listening to the fiscal hawks when it comes to spending (but not hawks when it comes to tax cuts for the rich).
It would be good if the fiscal hawks decided that cutting taxes was a dumb move for a change. If the stimulus goes through and there is finally enough vaccine to deal with the pandemic, we could actually have some high growth for a change.
The financial news was freaking out this week over rising “bond yields”. Yes the 10-year government bond rate rose from 0.5% last August to 1.5% recently:
https://fred.stlouisfed.org/series/DGS10
We are still talking about negative real rates and this may be more due to a stronger economy but leave it to Mitch McConnell to tell us it is evidence that the Biden fiscal plan is “too big”.
Moscow Mitch has been steadfastly wrong about everything at all times. No change there.
https://fred.stlouisfed.org/graph/?g=s1t5
January 15, 2020
Weekly Economic Index, * 2020
* Lewis-Mertens-Stock
The WEI is an index of real economic activity using timely and relevant high-frequency data. It represents the common component of ten different daily and weekly series covering consumer behavior, the labor market, and production. The WEI is scaled to the four-quarter GDP growth rate; for example, if the WEI reads -2 percent and the current level of the WEI persists for an entire quarter, one would expect, on average, GDP that quarter to be 2 percent lower than a year previously.
Harvard’s https://tracktherecovery.org/ records a – 24.2% employment decline for low income workers as of January 25, 2021 compared to January 2020. Consumer spending in high income neighborhoods as of February 14, 2021 is – 3.0%. Small business revenue in high income neighborhoods as of February 10, 2021 is – 39.1%. Shopping by my neighbors or myself is decidedly online, and we think that will continue. This, to me, means restructuring employment.
Just an FYI (no ulterior motives): https://web.cvent.com/event/7b96498a-9c74-4171-825a-65564d10524b/summary
Sebastian Mallaby on GameStop:
https://www.washingtonpost.com/opinions/2021/01/30/good-guys-gamestop-story-its-hedge-funds-short-sellers/
Greg Mankiw adds this analogy:
The bubble is being being driven by internet trolls. The right model of a troll is a person willing to waste his time and money to get other people to waste their time and money.
I always thought Dallas, Texas was a bit creepy and now we see how the city addressed racial issues. The Accommodation was first published in 1987 but the Dallas white supremists made sure few knew about this account of how they maintained segregation:
https://www.dallasnews.com/arts-entertainment/books/2020/06/22/the-accommodation-a-history-of-race-relations-in-dallas-makes-a-comeback-on-twitter/
My son and his girlfriend were living there for the past year or so. They even bought a house, thinking that they could put down some roots. Now they are going to sell and move again. My son isn’t exactly pure white. I wonder how much bearing that has on how much they now want to leave Dallas.
There seems to be a relationship between real interest rates (approximation GS10 minus inflation), and world-wide current accounts balance. Real interest rates and world current account balances may be cointegrated. If so, other things being equal, it looks like real interest rates may be negative for the next few years. The world-wide current accounts balance may be viewed on the IMF website. https://www.imf.org/external/datamapper/BCA@WEO/WEOWORLD . The IMF has forecasted world-wide current account balances out to 2025.
Any thoughts from the experts?
AS,
I am uncertain precisely what you are asking. I am not sure what that summary stat you showed from the IMF is. Menzie can correct me if I am wrong, but it is my understanding that the “global current account balance” is zero. One nation’s surplus is another’s deficit (or combinations of those of several nations), although I know that there are a lot of statistical discrepancies in the official data due to various things, most importantly unreported illegal transactions.
Anyway, the hypothesis you refer to applies to individual nations, so we do rather expect, ceteris paribus, that if a nation’s real interest rates rise they are likely to see a short term appreciation of their currency and that will usually lead, aftet a J-curve lag, to a movement towards deficit on their current account. Of course that movement of real interest rates is relative to those of other nations.
Which brings me to the point that offhand I would expect there to be no effect on current accounts of nations if they all (or most of them) have negative real interest rates. What matters are changes relative to each other for the nations involved, at least in the usual story, which is noisy, not the level global real interest rates are at.
I also note the caveat that the change in real interest rates may itself be responding to something else going on in the economy that might weaken or offset the expected effect on the current account, which is why I mentioned “ceteris paribus.” Thus relative real interest rates might rise because of a decline in the relative rate of inflation, and if that if the appreciation of the currency does not offset that relative decline in the inflation rate, the current account could move towards surplus as there should be a net improvement of international trade compaetitiveness for the nation involved.
Barkley,
Thanks for the response. I appreciate your correction.
I was looking at the world current account chart on the linked page and then at the “All Data”, Excel file. On line 228 of the Excel file there is a listing for “World”. I assumed this was a total for the World. As you suggest, I thought that the Current Account may be a zero sum for the “world”, but seeing an amount on line 228, seemed to change my mind, perhaps incorrectly.
AS,
I have not looked at these Excel files of IMF data previously. Tried to look at the one you have linked, and I am not sure what is going on.
One possibility is that this aggregate number reflects only a subset of nations, in which case of course there can be net current account “aggregate” balances not equal to zero. For what it is worth, the projection of a -0,4% of GDP “glbal” current account balance would be about $4oo billion if this were indeed for the whole world GDP. As it is, that figure at the beginning has the balance having been about a positive $400 billion for a couple of years ending around 2018 and then declining hitting an endpoint of about $200 billion as of 2020.
I do not know what to make of all this. Maybe Menzie does.
AS: World current account in $ should be zero; the statistical discrepancy item makes that so. That it is correlated with world interest rates might be just accident, or maybe mismeasurement rises as incentives to evade accounting increase.
See here.
Your link is a good discussion with a sense of humor:
‘Was the Earth a net importer of goods and services from other planets before 2005 and a net exporter afterwards? According to the International Monetary Fund (IMF), these discrepancies are driven by several factors. For one, transportation lags could generate a positive current account if the exports of a country are recorded in one year and imports are recorded in the following year. Another factor, especially in emerging economies, is the underreporting of income generated through these transactions for tax evasion purposes.’
Trading with Martians. Hmm – if Mars is a tax haven, then we just may have some serious transfer pricing abuse!
Is Mars a high wage, developed economy of a low wage, developing economy? We know transportation costs are on the high side, but are imports from Mars high value and innovative or just cheap? Unless this is clear, I don’t know how to analyze the gaps.
Thanks for the clarification. It did seem that there should be a zero sum for world current account balance, similar to the concept that one person’s account receivable is another person’s account payable. The world current account chart and Excel file seem quite confusing.
Thanks for the link to the comment about trade with another planet.
AS,
I have done a bit more digging on this, especiallyi the matter of statistical discrepancy, or as it looks like the IMF now calls it “errors and omissioins,” which as Menzie explained is essentallyi a residual that is estimated to bring about the needed zero net global balance of current (and also capital) accounts. For a given nation what one must find is that the net current account balance should equal net financial transactions flows + the capital account balance. This discrepancy then is the difference between these.
In my digging I found a 2016 paper out of the some US agency that noted various sources of these error and omissions, which can involve either unreported or misreported financial flows or such on the trade side in terms of poorly or unreported exports ot imports. Numbers for the US were presented, with this number maxing out in 1997 and also 2016 at around 0.7-0.8% of the total cuttent account, not massive, but also not exactly zero, with this report saying these numbers tend to rise during periods of “financial turbulence.”
I last looked at these sorts of data closely at the IMF over 20 years ago when I was writing a paper on rational bubbles in exchange rates with two coauthors that was published in 1999 in the then Weltwirtschaftliches Archiv. I remember that a nation that was notorious for having an especially large such discrepancy on a regular basis was Colombia, with it once upon a time being claimed that the three largest exports from there were mostly illegal and largely unrecorded: cocaine, marijuana, and emeralds, all of them supposedly exceeding coffee. I tried to find current nuibers for Colombia but got bogged down, although I did see a 2015 report from the Central Bank of Colombia about how they measure the various components of their balance of payments. It did not provide any actual numbers and never mentioned the matter of errors and omissions or statistical discrepanvy at all, although I can well imagine it is a rather embarrassing and potentialliy dangerous thing for them to do.
I hope this helps clarify this rather complicated issue, which is generally not paid much attention to, although it is my understanding that those especially concerned with international crime and corruption look quite closely at these numbers for obvious reasons.
Doesn’t Colombia also export oil and roses? I once had to address certain transfer pricing and valuation issues for a rose multinational which was a lot of fun.
Barkley,
Thank you. I appreciate the education.
pgl,
Shows how long it has been since I actually looked at Colombia’s numbers closely. Coffee has slipped way back as a leading legal export. Indeed oil is now tops at 57% of measured export earnings, with this a fairly recent development. It is also a major exporter of flowers of various sorts as well as bananas, of which is it sixth in the world in exporting.
AS,
You are most welcome.
About recovery, I was struck that Jerome Powell commented on the importance of especially focusing on increasing the portion of women in the workplace. This was a need before the recession and I am surer of that need existing now:
https://fred.stlouisfed.org/graph/?g=BqJK
January 4, 2020
United States Labor Force Participation Rates for men and women, * 2020
* Employment age 25-54
https://fred.stlouisfed.org/graph/?g=tKur
January 4, 2020
United States Employment-Population Ratios for Men and Women, * 2020
* Employment age 25-54
https://fred.stlouisfed.org/graph/?g=r2SW
January 15, 2018
Interest Rates on 5-Year Treasury Inflation-Indexed Bonds, 2017-2020
https://fred.stlouisfed.org/graph/?g=r2SX
January 15, 2018
Interest Rates on 10-Year Treasury Inflation-Indexed Bonds, 2017-2020
Marjorie Taylor Greene is on her morality high horse opposing equal right for the LGBTQ community but check how often she cheats on her husband:
https://www.thesun.co.uk/news/14026603/marjorie-taylor-greene-cheated-husband-polyamorous-sex-gym/
She makes Trump look like choir boy by comparison!
https://fred.stlouisfed.org/graph/?g=tGuT
January 4, 2020
Unemployment rates for Whites, Blacks and Hispanics, * 2020
* Employment age 16 and over
https://fred.stlouisfed.org/graph/?g=x6ix
January 4, 2020
Employment-Population Ratios for White, Black and Hispanic, * 2020
* Employment age 16 and over
[ I am bothered by the disproportionate coronavirus direct impact on Blacks, including the following unemployment and employment-population ratio impacts. ]
I was expressly asked about the loan content for Belt and Road Initiative projects and looking to several national projects in Pakistan, Ethiopia and a few other countries, the answer would be over 80% for direct BRI projects. However, the loan content has been highly flexible and adjustable according to other country needs and there are important Chinese grant projects in the countries that are not part of the BRI. BRI projects are infrastructure developing, and thinking an Ethiopia or a Laos really need not to be land-locked, I am thoroughly impressed at the need.
After all, being able to travel across Mozambique and even travel from Mozambique to neighboring South Africa is no small matter:
http://www.xinhuanet.com/english/2018-11/11/c_137597807.htm
November 11, 2018
Africa’s longest suspension bridge opens to traffic in Mozambique
MAPUTO — The longest suspension bridge in Africa, the cross-sea Maputo Bay Bridge with its link roads in Mozambique, was officially open to traffic here on Saturday.
Being part of the project Maputo Bridge and Link Roads built by the China Road and Bridge Corporation, with Chinese financing and standards, the three-kilometer twin-tower suspension bridge extends 680 meters span over the Maputo Bay of the Indian Ocean.
Speaking at the inauguration, President of Mozambique Filipe Jacinto Nyusi said that the project will facilitate the link between the country and the northern part of the African continent, “materializing the African wish built in the foundation of the African Union in 1963.” …
Barkley reminds us that Colombia also exports bananas, which I should not have missed as one of the projects for the day job was to address the transfer pricing and customs valuation issues for banana multinationals. I was going to provide this link earlier but Census’s website had its issues for a few days:
https://www.census.gov/foreign-trade/statistics/product/enduse/imports/c3010.html
Colombia also exports a fair amount of gold to us (is Glenn Beck a major importer) and I suspect all those “nursery stock” imports are really roses.
Hmmm. I was unaware of them exporting gold. That seems to be second, just ahead of green coffee, which is certainly still a biggie, but with both well behind crude oil.
pgl,
I checked on those illegal exports. It looks like cocaine probably still tops oil to be the top export. I saw an estimate that suggests its cocaine exports exceed $4 billion, which puts it ahead of the $3.3 billion for oil. However the other two are not all that important. Emeralds are maybe about $90 million, although that may be the legal number with some more being done illegally as I used to hear a long time ago. Marijuana seems to have really collapsed, with only about $5 million in exports now, barely anything, although they are apparently now exporting medical marijuana. It is possible that is the legal export number, not the total. I am not current on such things, but I remember when Colombian marijuana was reputed to be one of the strongest varieties around, but it has probably been way superseded by US domestic varieties, which I hear have become very strong.