Is the inflation scare bubble over?
As of yesterday, the five year inflation breakeven was 2.5%, down from 2.72% in mid-May. The estimated inflation risk and liquidity premia adjusted 5 year breakeven was 1.62% as of 7/30 (when the corresponding actual breakeven was 2.56%).
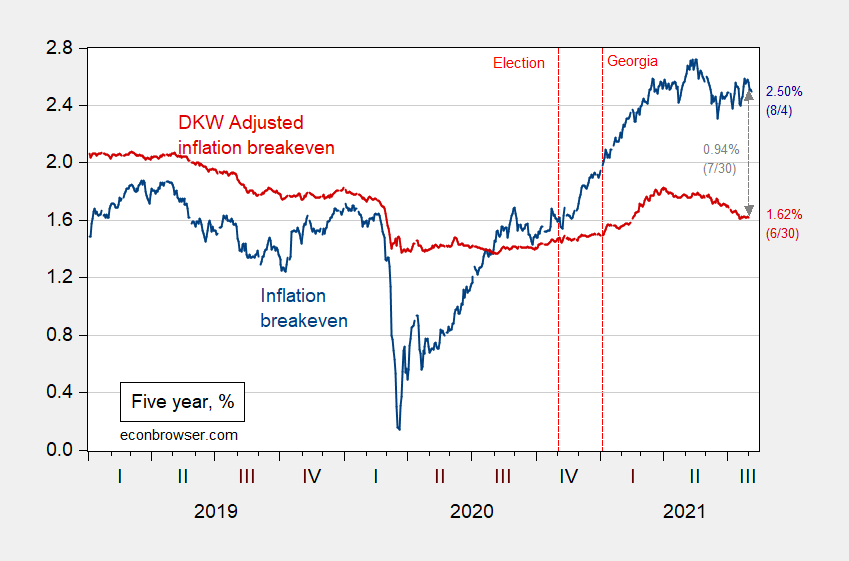
Figure 1: Five year inflation breakeven calculated as five year Treasury yield minus five year TIPS yield (blue), five year breakeven adjusted by inflation risk premium and liquidity premium per DKW (red), all in %. NBER defined recession dates shaded gray (from beginning of peak month to end of trough month). Source: FRB via FRED, Treasury, KWW following D’amico, Kim and Wei (DKW) accessed 8/5, NBER and author’s calculations.
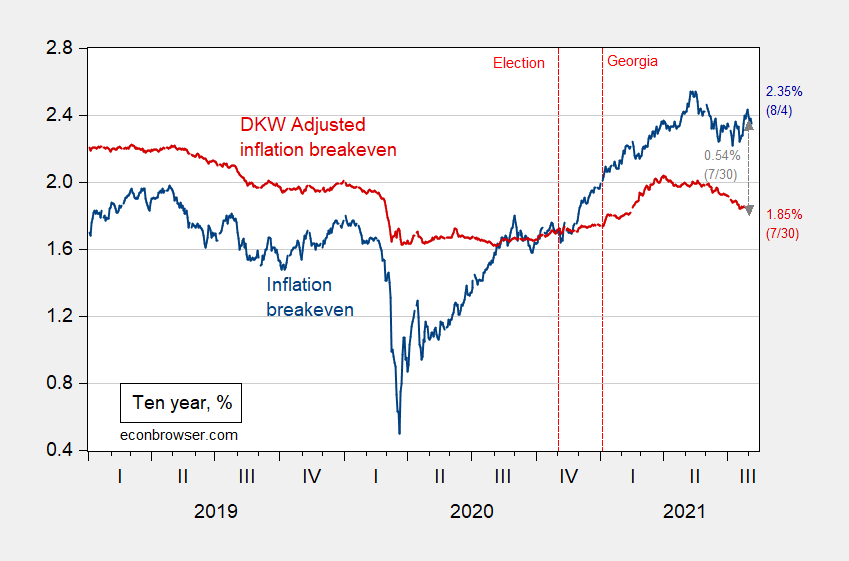
Figure 2: Ten year inflation breakeven calculated as ten year Treasury yield minus ten year TIPS yield (blue), ten year breakeven adjusted by inflation risk premium and liquidity premium per DKW (red), all in %. NBER defined recession dates shaded gray (from beginning of peak month to end of trough month). Source: FRB via FRED, Treasury, KWW following D’amico, Kim and Wei (DKW) accessed 8/5, NBER and author’s calculations.
As Gagnon and Sarsenbayev noted earlier this year, market based expectations of inflation have not been particularly good at predicting actual inflation. I concur, as discussed in this post, but I think measures purged of extreme events related to liquidity premia are probably slightly better at prediction.
That being said, medium term inflation expectations are what matters for the position of the Phillips curve, as discussed in this post.
Even if the market has rational expectations (in equilibrium – sometimes that’s called FIRE), that only means it’s correct on average. What’s true is, as Liz Ann Sonders (Charles Schwab) points out, the “internet”‘s interest has waned.
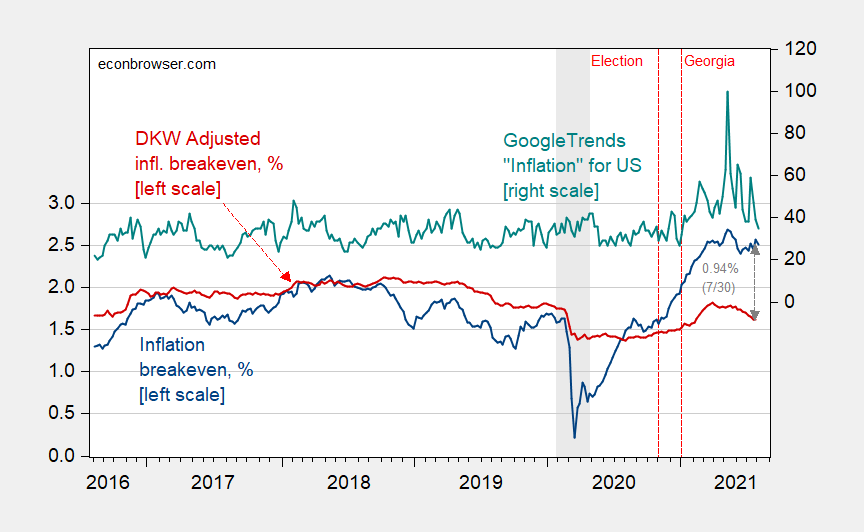
Figure 3: Five year inflation breakeven calculated as five year Treasury yield minus five year TIPS yield (blue), five year breakeven adjusted by inflation risk premium and liquidity premium per DKW (red), all in %, and Google Trends search index for “Inflation” in US. NBER defined recession dates shaded gray (from beginning of peak month to end of trough month). Daily Treasury data averaged to weekly. Source: FRB via FRED, Treasury, KWW following D’amico, Kim and Wei (DKW) accessed 8/5, NBER and author’s calculations.
Finally, I think concerns of aggregate demand shifting far into high gear (which is separate from aggregate demand far exceeding potential GDP) are abating. Both 5 and 10 year TIPS yields are near record lows.
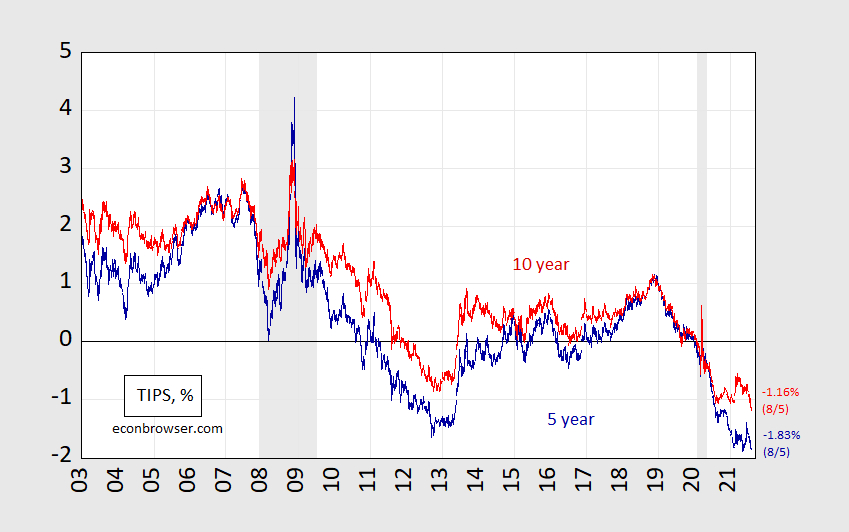
Figure 4: Five year TIPS yield (dark blue), five year TIPS yield (light red), all in %. NBER defined recession dates shaded gray (from beginning of peak month to end of trough month). Source: FRB via FRED, Treasury, NBER and author’s calculations.
Admittedly, these calculations don’t account for liquidity premia on TIPS. Five year expected average short rates are off recent lows, but are still below zero at -0.45% (vs. -1.87% for 5 year TIPS, both on 7/30).
I would ignore government bonds. Wait until the overhyped Delta strain declines in the coming weeks. I could see a ugly selloff in 10 year treasuries akin to what happened last spring.
So, Bot, why do you think there will be some big selloff of Treasuries when this decline in the “overhyped” Delta strain come “in the coming weeks”? You think that the five year rate might go back up to about 2.6% like it was a few months ago from its current 2.4% or so? Wow, that will really upend things. Assuming no change in the breakeven rate a move from a forecast of inflation five years from now oaf about 1.8% rather than the current forecast of about 1.6%. That will really imsettle the markets for sure, although maybe that breakeven rate will plunge. Is that something likely to happen when this decline in the Delta virus happens that you are so self-assuredly predicting comes to pass? I note it has been declining in the last few months along with the 5-year rate as well from a time before the Delta virus was so big, so not exactly seeing that scenario particularly.
Do not feed the trolls.
More trolling. Please go find another blog to pollute.
Even if one looked at only nominal interest rates, the rate on 10-year government bonds pre-pandemic was 1.5% or more but now it is less than 1.2%. Real rates are incredibly low and expected inflation is not exactly hyperinflation.
If you look at Figure 1, for example, the decrease in “expected inflation”, the red line, has come about almost entirely from the increase in “unexpected inflation risk” shown by the arrow as 0.94%. This value for “unexpected inflation risk” was 0.77% last month. The unexpected inflation arrow has increased.
So what does it mean, in economic terms, that “expected inflation” has decreased but the risk of “unexpected inflation” has increased? Is there a causal relationship?
Just a guess: “expected” means the central estimate, “unexpected” means dispersion of expectations around the central estimate. Assuming I have this right, then it is worth knowing that inflation volatility typically declines as inflation slows. Falling “expected” inflation accompanied by rising “unexpected” inflation is a bit of an oddity, suggesting the future is cloudier than usual. Not all that surprising right now.
I have vainly tried to get john cochrane at his blog to explain the transmission mechanism that gets transit inflation set into underlying inflation ( trimmed mean is the best as OUR central bank said a long time ago). Unless I am mistaken (and i lived it back then) in the 70s this occurred when unions demanded and got large pay increases so real wages would be maintained. Can they do this again?
I do not think so either in your failed state or in our downunder paradise
In order to properly interpret the implications of market price changes in one period, it is important to understand the drivers of prices in the prior period. The rise in yields earlier this year was widely interpreted in the press to be a straight read on growth and inflation. That is what the financial press does, and it is often a mistake. Financial pros now seem mostly agreed that the rise in yields earlier this year was more about portfolio changes than a change in the economic outlook.
Japanese accounts reduced holdings of Treasuries for internal reasons. Steepening (reflation) trades were put on. Now, the steepeners were a bet that the combination of fiscal and monetary stimulus and the lifting of Covid troubles would lead to more steepening, but from mid-March forward, that trade stalled, even as inflation readings climbed.
Steepeners have been unwound. Commodity trading accounts (CTAs) have swung from net short to net long positions in ten-year futures. Duration needs have increased, leading to more long-end buying. Duration is not – directly, anyhow – related to growth or inflation expectations.
There is a growing view that Q3 data won’t be very useful because Covid is once again raising uncertainty about what will happen beyond Q3.
All of which is to say that the earlier steepening and recent flattening, while related to economic fundamentals, were mostly fueled by positioning and changing portfolio needs. Menzie has drawn most of the picture, but go look at term premium as well: https://fred.stlouisfed.org/series/THREEFYTP10
Changes in positions not related to inflation expectations or expected cost of funding show up as changes in term premium, and there has been a pretty sizable dive in premium since late June.
Oh, and by the way, this sort of comment is music to bucket-shop managers’ ears: “Wait until the overhyped Delta strain declines in the coming weeks. I could see a ugly selloff in 10 year treasuries akin to what happened last spring.” People who think that way nearly always lose money in the medium term, no matter how lucky they get on a single trade. Market pros just don’t talk about “the overhyped Delta strain”. They take money from people who think that way. When they can be bothered.
By the way, the term premium spread between 2s and 10s (OK, I’m being tedious, but there’s a point coming) was just about zero in mid-June, while the spread between 2s (or 10s) and 5s was inverted. Now. the spread between 5s and 10s is just about zero, everything beyond 2s inverted.
This shift in term premium, focused on the long end, is a duration grab. To heck with 5s, not enough duration. I need me some tens.
If inflation fear was the dominant influence in Treasury market trade, based on inflation under way right now, why tens but not fives? Yes, you can tell a story that makes it so, but it falls apart when you check the 5-year/5-year forward inflation reading, which has only shifted about 3 bps since mid-June: https://fred.stlouisfed.org/series/T5YIFR/ The inflation story, such as it is, is about now, not between 5 and 10 years from now.
Sorry if this is a little incoherent, but the point is that Treasury market pricing, when examined in a bit of detail, tells a very particular story about what is driving changes in interest rate spreads. Stories about inflation expectations, growth expectations or a tapering scare are not adequate to explain price moves. Position adjustment and duration needs are a big part of what’s happening and are being confused for inflation, growth and tapering concerns.
Course, I wouldn’t know this if I had chosen to “ignore government bonds”.