From FRED: Employed full time: Median usual weekly real earnings: Wage and salary workers: 16 years and over (LES1252881600Q), graphed along the familiar average hourly earnings per hour, total private industry, ex-nonproduction and supervisory workers, deflated by CPI:
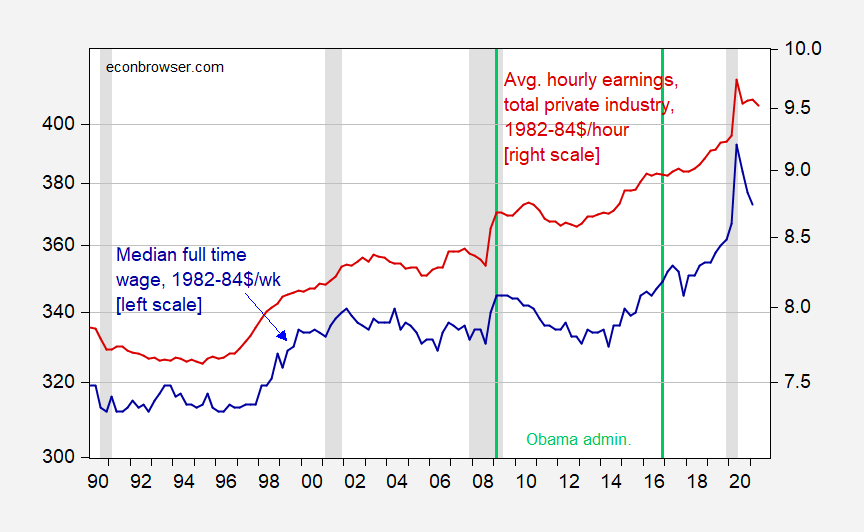
Figure 1: Median usual weekly real earnings per week: Wage and salary workers: 16 years and over, full time (blue, left log scale), and average hourly earnings per hour for total private industry (red, right log scale), both in 1982-84$, deflated using CPI. NBER defined recession dates shaded gray. Light green lines denote Obama administration. Source: BLS via FRED, NBER, and author’s calculations.
This graph is in response to JohnH‘s comment:
Where exactly does the BLS report median earnings in current dollars? SSA does this in a clear, straightforward format, albeit with a significant delay.
And if the BLS does not, why not? Isn’t the average American entitled to know how much the average Worker takes home on an hourly, weekly and annual basis? Aren’t people entitled to know from BLS that the average worker is barely making a living wage and can barely afford housing? It might help politicians focus.
Just reporting average earnings, which are 50% higher than the median , simply serves to obfuscate how the workforce is doing.
It took me 15 seconds (literally) to find and download the series. It took longer to import into EViews and then translate average hourly earnings into the quarterly frequency and plot than it took to find.
If you’re going to assert a vast conspiracy of elites trying to obfuscate and hide the data, then at least try to find a variable that is in fact not reported, and hard to create.
Dean Baker recently made the same observation. Now in the olden days, JohnH would claim Dean Baker was a progressive economist. But now he seems Dean has joined this vast conspiracy of elites trying to obfuscate and hide the data!
https://cepr.net/life-at-the-bottom-in-joe-bidens-america/
August 16, 2021
Life at the Bottom in Joe Biden’s America
By Dean Baker
With the economy facing substantial bottlenecks, and the continuing spread of the pandemic, it is worth taking a quick look at how lower paid workers have been faring. Nominal wages have been rising rapidly for workers at the bottom of the pay ladder in recent months. This has allowed workers in the lowest paying jobs to see substantial increases in real wages, in spite of the uptick in inflation the last few months.
Here’s the picture in retail for production and non-supervisory workers. Note that real wages were actually somewhat lower in 2018 than they had been in 2002. (These numbers are 1982-1984 dollars, so multiply by about 2.6 to get current dollars.) They did rise in 2018 and 2019, due to a tightening of the labor market, as well as minimum wage hikes at the state and local level. The impact of the pandemic and the recovery has been a big net positive. Real wages in the sector are roughly 4.6 percent higher than the level of two years ago, a 2.3 percent annual real wage gain.
[ Real Average Hourly Earnings for Production and non-Supervisory Workers in Retail ]
The story looks even better in the hotel and restaurant sector. Real wages had been rising fairly consistently since 2014, but growth has picked up in the pandemic and recovery. Real wages are now 6.3 percent above their level of two years ago, an average annual increase of 3.2 percent. This rate of increase is not likely to continue, but so far workers in this sector have been seeing extraordinary wage gains.
[ Real Average Hourly Earnings for Production and non-Supervisory Workers in Leisure and Hospitality ]
https://fred.stlouisfed.org/graph/?g=G9Qu
January 4, 2018
Real Average Hourly Earnings of Production and Nonsupervisory Employees in Retail Trade and Leisure & Hospitality, 2017-2021
(Indexed to 2017)
https://fred.stlouisfed.org/graph/?g=lMaX
January 15, 2018
Real Median Weekly Earnings for men and women, * 2000-2021
* Full time wage and salary workers
(Indexed to 2000)
https://fred.stlouisfed.org/graph/?g=muKc
January 15, 2018
Real Median Weekly Earnings for White, Black and Hispanic, * 2001-2021
* Full time wage and salary workers
(Indexed to 2001)
If JohnH was in a discussion based on facts, his comments would read very differently. He is, in fact, engaged in propaganda. He pretends to engage in debate so he can make misleading claaims and wierd mischaracterizations, aimed at non-specialist readers.
This sort of bumptious rhetoric makes the case:
“Isn’t the average American entitled to know…?”
“Aren’t people entitled to know…?”
JohnH wants to stoke outrage about…nothing. The median data he so vigorously demands is already easily available to anyone who bothers to look. JohnH didn’t bother.
JohnH is here to disrupt the discussion, to prevent a fact-based consideration of economic policy. He’s a faux-news style outrage peddler. Truthiness all the way.
Next thing, Johnny will complain that the series isn’t inflation adjusted and claim that at some cherry-picked point during Obama’s presidency, an adjusted reading in the series was below some adjusted reading during Nixon’s presidency, because that comparison is the ONLY WAY to know whether Obama gave a hoot about workers.
Johnny will probably have made math errors and misrepresented his data source and make unsupported emotional claims in the process of running down the first black president in U.S. history (hmmmm…?), but never mind that. Saying “Democrats BADDD” (or maybe “black president bad”?) is the whole point of Johnny’s blithering.
The Purloined Letter suggests that the best way to obfuscate and hide the data is to put it out in plain sight!
https://www.cepr.net/us-political-intervention-in-haiti-has-caused-instability-and-aid-efforts-have-largely-failed/
November 6, 2015
US Political Intervention in Haiti Has Caused Instability and Aid Efforts Have Largely Failed
By Mark Weisbrot
When a devastating earthquake struck Haiti in January 2010, killing more than 200,000 people, former President Bill Clinton said that the reconstruction would provide an opportunity to “build back better.” Some $9.6 billion was pledged by the international community, including the US government. But nearly six years later, although about $7.6 billion has been disbursed, there is not much to show for it.
Hundreds of thousands of Haitians displaced by the earthquake remain without adequate shelter. USAID, the US State Department’s development agency, pledged to build 15,000 homes but has so far only delivered 900. Most US taxpayers’ money, it seems, didn’t get outside of the Beltway. Of USAID contracts, for example, more than 50 percent of payments went to contractors in the Washington, D.C. area, while only 1 percent went directly to Haitian companies or organizations. Everyone worries about money being potentially lost to corruption in the Haitian government, and so just a small fraction of the billions pledged went to desperately needed budget support. But the large-scale corruption, fed by lack of accountability, is much closer to home.
Haiti needs a government that can collect taxes, especially from the rich elite and companies that can pay them, and provide necessary services. This should have been the target of “building back better,” rather than foreign contractors. But the US government has never shown much interest in building a democratic, legitimate government in Haiti; quite the opposite in fact. In 1991, Haiti’s first democratically elected president, Jean Bertrand Aristide, was overthrown in a military coup. It was later determined that leaders of the coup had been paid by the US Central Intelligence Agency. In 2004, Aristide was deposed again through a multi-year effort by Washington, who took him out of the country and into forced exile for seven years.
In 2011, Washington intervened once again by arranging for the Organization of American States (OAS) to reverse the first round results of Haiti’s presidential elections. This was done without a recount or even a statistical test of the sample of ballots examined, and independent research showed that there was no statistical basis for the decision. Now we are witnessing a potential repeat of the 2010-2011 elections….
https://fred.stlouisfed.org/graph/?g=G7aR
August 4, 2014
Real per capita Gross Domestic Product for Dominican Republic and Haiti, 1992-2020
(Percent change)
https://fred.stlouisfed.org/graph/?g=G7aW
August 4, 2014
Real per capita Gross Domestic Product for Dominican Republic and Haiti, 1992-2020
(Indexed to 1992)
https://fred.stlouisfed.org/graph/?g=GakH
August 4, 2014
Real per capita Gross Domestic Product for Dominican Republic and Haiti, 1971-2020
(Percent change)
https://fred.stlouisfed.org/graph/?g=GakN
August 4, 2014
Real per capita Gross Domestic Product for Dominican Republic and Haiti, 1971-2020
(Indexed to 1971)
Johnny wants to know: “And if the BLS does not, why not?” As Menzie notes, BLS does, but if BLS didn’t, it might have been because Census does, maybe.
https://fred.stlouisfed.org/series/MEHOINUSA672N
https://fred.stlouisfed.org/series/MEHOINUSA672N
But maybe there is some special right-wing statistical-analytical reason that any data series which a serious-minded troll might want to distort should only come from BLS. The rest of government doesn’t count.
Yep! But the highly skilled right wingers make up their own data. Oh wait – maybe JohnH will start referencing that too!
Yes, the Census Bureau provides useful data.
Even more useful is a another source that uses census data to amplify the data and show it more clearly than FRED.. They show the data by quintile for about 60 years. In this past they even had a source that would regularly estimate the data for periods between Census Bureau publications
https://www.advisorperspectives.com/dshort/updates/2020/09/17/updated-u-s-household-incomes-a-50-year-perspective
If you have any doubt about how poorly the average American has fared for the last 60 yeas, you only need look at the chart which shows that the middle quintile’s real household income has been pretty stagnant for most of the last 60 years. In Obama’s last year it finally rose back to where it had been in 1999. Bank profits and the stock market both recovered much, much faster than household incomes, And (Democrats just hat to hear this, but the data is clear): median household income rose 9% between 2016 and 2019–years coincident with Trump.)
If Democrats are to win elections, they have to do better than Republicans when it comes to not just “the economy” but also median incomes. Their history is grim. For a long time, Democrats couldn’t even concoct a coherent message about the economy. Fortunately, Biden is trying…I give him kudos for a Democratic effort not previously seen in this century.
“Even more useful is a another source that uses census data to amplify the data and show it more clearly than FRED”
Back to this source again? Macroduck has already documented you lie about what their data shows as well. Maybe you should start consulting with ShadowStats.
Now, if you want the view of someone other than Johnny, our local right-wing hack in progressive clothing, how about Scott Sumner (econ professor at George Mason, Ph.D from U. Chicago?)
“There was a period of stagnant real wages, but it ended in the mid-1990s. All of these series show significant growth in real wages since the mid-1990s. Whatever explains the rise of populism in America, it is not stagnant wages.”
Nearly everythig JohnH has written in comments on Econbrowser is wrong. Overwrought, intentionally misleading and wrong. But that won’t slow him down, because his political masters know the “Big Lie” only works if you keep repeating it without ever conceding an inch. That’s why Johnny just keeps saying the same nonsense, no katter how much Menzie schools him.
Summer conveniently ignores the drop in real median household incomes during the first 15 years of this century, as shown clearly in the Census Bureau data referenced above.
JohnH: Who is Summer?
Can’t get the facts right. Can’t spell the man’s name correctly. Let’s call JohnH butter as he is on a roll!
Oops, typo: Sumner
Ah, so Menzie is wrong. Sumner is wrong. Everybody but Johnny is wrong. Johnny decides which data matter.
Democrats are bad on the only data Johnny will allow because the drop began under Bush Jr. and only turned up again when Obama was president. Apparently, D emocrats are bad because they are endlessly making up for the damage caused by Republicans.
How much is the Koch clan paying you to write this drivel?
Look at the data! Wages went down under Obama, then rose to about where they started.
That’s not stagnant wages?
It’s been a brutal few decades for average wage earners ever since Volcker decided that the way to handle inflation due to oil prices was to make millions of hardworking, innocent Americans poorer. Since then the only wage gains they made were a few years in the late 90s when Greenspan, despite all the other terrible things he did, allowed unemployment to go lower than all the economists thought possible. And there haven’t been any wage gains since until Powell told all the inflation hawks to stuff it. Hopefully Powell will continue at full speed ahead.
Biggest gainers are low wage earners. Hey, remember not long ago when Kopits was dishing out his claptrap that “The losers will be those at the lowest level, meaning those with the worst skills, worst work education, worst work ethic, criminal records and problematic personal histories like that of drug abuse.”
It might be enlightening to plot on the same graph the total incomes of the top 10% and top 1% and top 0.1% over the last four decades. Would have to include unearned income since wages are a smaller part of total income for those at the top.
The problem is that the BLS data series both track average wages over time. This can be verified by reflating 2019 BLS data from 1982 dollars to 2019 dollars and comparing the result to the SSA data, which is highly reliable, since it relies on IRS data.
According to the the BLS Inflation Calculator, the inflation factor from 1982 to 2019 is about 2.7x.
According to the BLS wage series, hourly earnings were about $9.25 in 2019, expressed in 1982 dollars. Reflating with the inflation factor gives a result of almost $25 per hour in 2019. Annualized, it amounts to almost exactly $52,000, which almost exactly matches the SSA average compensation of $51,916. The BLS data yields a result that is over 50% above the SSA’s median compensation of $34,248. It’s not even close!
The same is true of the weekly data series. It shows weekly earnings of about $360 in 2019, expressed in 1982 dollars. Reflating yields $972 in 2019. Annualized it amounts to $50,544, just under the SSA’s figure for average compensation. Again, the BLS data is tracking average, not median earnings, because it is about 50% above the SSA median compensation data.
Clearly the two BLS data series are poorly labeled. Yes, it pays to look at the data.
I am still looking for a BLS data series that tracks median compensation. This is important, because, as the SSA data clearly shows, the average US worker is only making about $17 per hour, barely about a living wage of $15 per hour. It also means that almost half the American workforce earns less than a living wage.
And people wonder why so many Americans are so resentful! To understand this, you only have to look at the data to see how poorly they are paid. Unfortunately, only SSA, not BLS provides the data.
JohnH: I have no idea what you are writing. The BLS series (blue line) is median wage for full time workers.
Or are you saying the BLS series is fake, made up by nameless bureaucrats in an attempt to deceive the American people?
JohnH has no idea what he is writing either. And yet he writes more and more babble never acknowledging his past babble.
What he says is the data does not support his theory, so there must be something wrong with the data. The theory is infallible.
That is how ‘economists’ working for Newt Gingrich used to do it.
Yes, that’s the lie Johnny has chosen this time. He had to tell this lie because you revealed his earlier le. The word salad he employs to tell this most recent lie is meant to look like a description of math, because math keans “evidence”. What he really wrote is that a median isn’t a median.
Time to ban this hack. He’s incapable of telling the truth.
I am NOT saying that the BLS data is fake. What I am saying is that they are using AVERAGE wage data.
What I did was to restate the data that they—for reasons unknown–insist on publishing in 1982-1984 dollars as 2019 dollars so that it can be compared with the Social Security’s 2019 data., which is published as current dollars. To do this, inflation since 1982-1984 must be put back into the BLS numbers. (2.7x) Why the BLS refuses to publish their series in 2019 dollars is a mystery to me. It only obfuscates and confuses, as does their poor labeling.
Once the BLS data for 2019 is put into 2019 dollars it is obvious that they are using average wages, because the results of the reflation to 2019 dollars make the numbers correspond very closely to the SSA average wage data.
My effing God. Even 6 year olds get the difference between mean v. median. Why do you waste so much space proving the obvious – you are the dumbest troll ever, which EV readers knew years ago. Move on/.
Show me where the BLS data series shows that median earnings are $250/week, which is what you get when you put the SSA median compensation data into 1982-84 dollars.
Naturally, Phil is too lazy to do such a simple calculation.
Spell checker error: pgl is too lazy…
I am NOT saying that the BLS data is fake. However, BLS avoids publishing median wage data, which they surely have, The average wage data looks a lot better politically and could be the result of a political decision taken decades ago to make the prosperity of the workforce look better than it really is.
The SSA data, by directly showing both average and median compensation is a clear, unobfuscated statement of how the workforce is doing, stated in current dollars.
They avoid publishing data? Now you inability to find the data on their website is not evidence that they are avoiding anything. Please stop for the sake of your poor embarrassed mother.
Show me BLS median earnings data that corresponds closely to SSA’s median compensation data!
Funny. Especially from Menzie as he reserves his facetious side generally. Menzie being this facetious is like hearing Armstrong the Chicken Hawk of the Muppets tell a joke.
Sorry, I should have said, Sam the Eagle of the Muppets. Definitely not a chicken hawk
https://news.cgtn.com/news/2021-08-17/Chinese-mainland-reports-42-new-confirmed-COVID-19-cases-12NbqJi8mTm/index.html
August 17, 2021
Chinese mainland reports 42 new COVID-19 cases
The Chinese mainland recorded 42 new confirmed COVID-19 cases on Monday, with 6 being local transmissions and 36 from overseas, the latest data from the National Health Commission showed on Tuesday.
In addition, 17 new asymptomatic cases were recorded, while 495 asymptomatic patients remain under medical observation.
This brings the number of confirmed COVID-19 cases on the Chinese mainland to 94,472, with the death toll unchanged at 4,636.
Chinese mainland new locally transmitted cases
https://news.cgtn.com/news/2021-08-17/Chinese-mainland-reports-42-new-confirmed-COVID-19-cases-12NbqJi8mTm/img/1181dcf8df684b15af45535d05d13314/1181dcf8df684b15af45535d05d13314.jpeg
Chinese mainland new imported cases
https://news.cgtn.com/news/2021-08-17/Chinese-mainland-reports-42-new-confirmed-COVID-19-cases-12NbqJi8mTm/img/97c1508cf4be4061a0ccd20a05f9dbfd/97c1508cf4be4061a0ccd20a05f9dbfd.jpeg
Chinese mainland new asymptomatic cases
https://news.cgtn.com/news/2021-08-17/Chinese-mainland-reports-42-new-confirmed-COVID-19-cases-12NbqJi8mTm/img/47a315121d794376b70c1b0a70774d24/47a315121d794376b70c1b0a70774d24.jpeg
http://www.xinhuanet.com/english/2021-08/17/c_1310132200.htm
August 17, 2021
Over 1.87 bln doses of COVID-19 vaccines administered in China
BEIJING — More than 1.87 billion doses of COVID-19 vaccines had been administered in China by Monday, the National Health Commission said Tuesday.
[ Chinese coronavirus vaccine yearly production capacity is more than 5 billion doses. Along with over 1.875 billion doses of Chinese vaccines administered domestically, another 800 million doses have been distributed internationally. A number of countries are now producing Chinese vaccines from delivered raw materials. ]
When you’re dealing with 1982-1984 dollars, it’s as if you’re dealing with a foreign currency. Only when the 1982-1984 dollars for 2019 have been converted to 2019 can they be compared to SSA;s 2019 data, which is in current dollars (2019 dollars for 2019. The conversion factor from 1982-1984 is 2,7x.
You have to be effing kidding me. A child would know how to rebase 1983 dollars to 2019 dollars. But you are too stooopid to do the same? That is your fault – not the fault of BLS.
Please stop writing so much incredible stupidity. DAMN!
You’re perfectly free to do it your way…and come out with the same results as I did.
I made my calculations easy enough for a child to follow…yet pgl can’t!!!
JohnH: The fact that average hourly wages match up with annual median earnings after some gyrations hardly implies that the BLS is mislabeling a “median wage” with an average…And for pete’s sake, rebasing to 2019 years is trivial.
“if you’re dealing with a foreign currency”
Hey – great idea. Let’s pretend everything is being expressed in Singapore dollars. In case you are too dumb to know and too lazy to look it up … One Singapore dollar is worth about US$0.75.
Stop with this incessant garbage as it is beyond embarrassing.
My oh my – the scandal. BEA’s price deflators are based such that 2012 values = 100, while BLS reporting of consumer prices are based such that 1983 = 100.
Another fine example of JohnH’s “vast conspiracy of elites trying to obfuscate and hide the data” but only if one is dumber than those zombies who were MAGA hats.
OK, let’s try this another way. The current monthly BLS release shows both average weekly earnings ($1016) and real average weekly earnings ($393/week) for July, 2020. They represent the same number, except that one is in current dollars; the other in 1982-1984 dollars. The current and real numbers differ by a factor of 2.6.
The data on your chart differs from those found in the link you provided but are close to the real average weekly earnings you plotted.
Now convert the SSA average 2019 annual compensation ($51916) to a weekly one, ($998). This closely corresponds to the current BLS average weekly earnings data. Converting to 1982-1984 dollars gives you a figure of $383 for SSA AVERAGE compensation. SSA’s MEDIAN compensation in 1982-1984 dollars comes out to $250, a figure NOT REMOTELY CLOSE TO THE FIGURE ON the BLS chart.
The bls hourly wages are related to full time jobs. Does the ssa data have a similar restriction? Is that average only for full time employment, or does it include part time employment?
Baffling: According to SSA, it’s average per worker.
seems that john is trying to compare apples to oranges. the question is whether he is intentionally misleading, or just ignorant?