With the August employment situation release, we have the following picture of the macroeconomy.
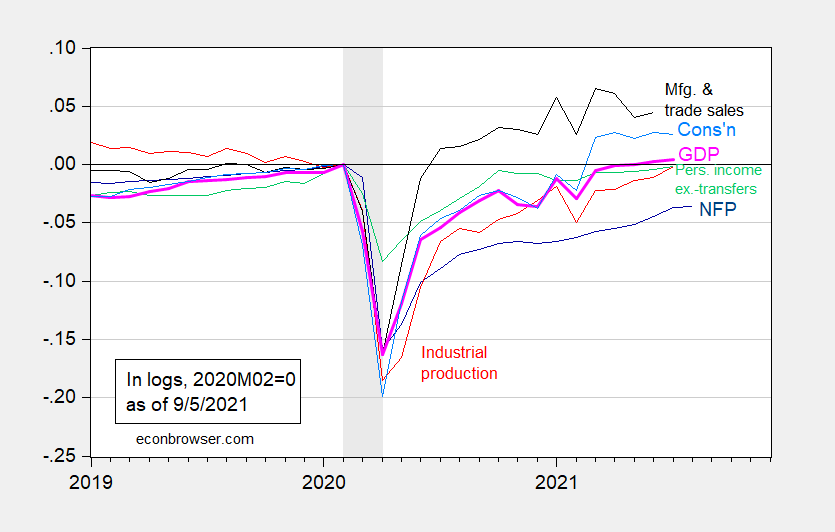
Figure 1: Nonfarm payroll employment from August release (dark blue), industrial production (red), personal income excluding transfers in Ch.2012$ (green), manufacturing and trade sales in Ch.2012$ (black), consumption in Ch.2012$ (light blue), and monthly GDP in Ch.2012$ (pink), all log normalized to 2020M02=0. NBER defined recession dates shaded gray. Source: BLS, Federal Reserve, BEA, via FRED, IHS Markit (nee Macroeconomic Advisers) (9/1/2021 release), NBER, and author’s calculations.
Clearly, the employment numbers for nonfarm payroll have slowed their ascent, continuing a trend in established in consumption and personal income ex-current transfers in July’s numbers. The increase of 235K was 515K below the Bloomberg consensus of 750K. Signifying the impact of the delta variant’s spread, retail dropped 29K, while hospitality and leisure employment was flat, breaking the recovery in that sector.
Reuters reports:
The number of number of people saying they were unable to work because of the pandemic increased 497,000 in August, the first rise since December.
Perhaps not an enormous impact, but a noticeable one as suggested earlier by high frequency indicators (remember the release pertains to employment situation a little before the middle of August).
More on the employment release in the next post.
the 3rd estimate of 2nd quarter GDP will overstate GDP by quite a bit (i’ll let someone else figure out how much) …trade figures going back to January were revised with the July report, which thus revised 2nd quarter trade deficits from 69,071, 70,994, and 75,749 million for April May and June to 66,659, 68,538, and 73,230 million for those months…the details behind those revisions will be applied to 2nd quarter trade figures when the 3rd estimate is released at the end of September…however, downward revisions of a similar magnitude to the trade deficits of the 1st quarter months will not be included in the GDP stats until the GDP annual revision end of July 2022…
that happens every year, but not by that much..
for anyone who’d want to estimate the impact of that, here’s June’s trade report: https://www.bea.gov/sites/default/files/2021-08/trad0621.pdf
here’s July’s: https://www.bea.gov/sites/default/files/2021-09/trad0721.pdf
for how the current dollar trade figures are adjusted to 2012$, here’s the key source data for the 2nd estimate of 2nd quarter GDP: https://www.bea.gov/sites/default/files/2021-08/GDPKeySource_2q21_2nd.xlsx
here;s the source data for the advance estimate, ie, to show how the monthly urls are constructed:
https://www.bea.gov/sites/default/files/2021-07/GDPKeySource_2q21_adv.xlsx