Some messages from the market and from estimated inflation rates.
First, expected average inflation over the next 5 years, from a straightforward 5 year breakeven using Treasurys and TIPS:
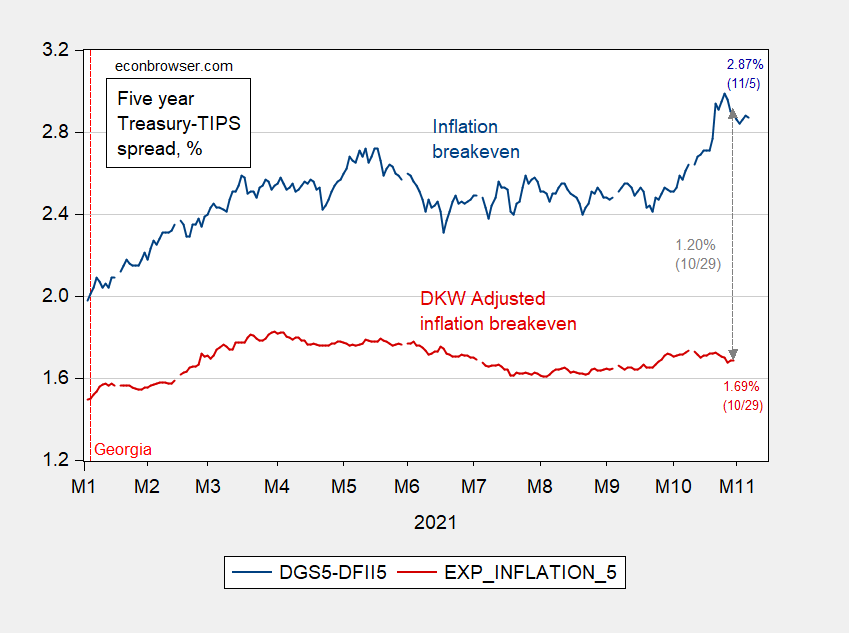
Figure 1: Five year inflation breakeven calculated as five year Treasury yield minus five year TIPS yield (blue), five year breakeven adjusted by inflation risk premium and liquidity premium per DKW (red), all in %. Source: FRB via FRED, Treasury, Kim, Walsh and Wei (2019) following D’amico, Kim and Wei (DKW) accessed 11/5, NBER and author’s calculations.
Note that in the space of ten days, the breakeven dropped 12 bps, not quite back to where it was when yields surged. On the other hand, the premia (inflation risk, liquidity) adjusted series based on D’Amico, Kim, and Wei (2018) (hereafter DKW) barely budged during the surge in 5 year breakeven.
For the five year five year forward inflation expectations inferred from market rates, there was a 27 bps jump going from 9/23 to 10/15, before retracing back to prior levels at end-October (and subsequently rising again). The adjusted series implies only a slight bump — 6 bps — before returning by month’s end to 9/23 levels.

Figure 2: Five year five year forward expected inflation calculated from Treasury and TIPS yields (blue), five year five year forward expected inflation using spreads adjusted by inflation risk premium and liquidity premium per DKW (red), all in %. Source: FRB via FRED, Treasury, Kim, Walsh and Wei (2019) following D’amico, Kim and Wei (DKW) accessed 11/5, NBER and author’s calculations.
The adjusted series suggest much more anchored inflation expectations than those calculated using simple breakeven rates. Kim, Walsh and Wei compare their implied expected inflation rates against those provided by other researchers in this Fed Notes. While the series as updated by KWW is just one estimate, it’s interesting that by 2019, all the estimated inflation series had converged.
From treasury.gov, linked by FRED in the notes to a 5-year Treasury yield graph:
《The Treasury’s yield curve is derived using a quasi-cubic hermite spline function. Our inputs are indicative, bid-side market quotations (not actual transactions) for the on-the-run securities obtained by the Federal Reserve Bank of New York at or near 3:30 PM each trading day. Because the on-the-run securities typically trade close to par, those securities are designated as the knot points in the quasi-cubic hermite spline algorithm and the resulting yield curve is considered a par curve. However, Treasury reserves the option to make changes to the yield curve as appropriate and in its sole discretion. Such changes may include but are not necessarily limited to adding, removing or modifying inputs, and making changes to the methodology for deriving the yield curve. For example, prior to the re-introduction of the 20-year Treasury bond on May 20, 2020, the yield curve had used additional inputs that were composites of off-the-run bonds in the 20-year range that reflected market yields available in that time tranche. Also, at various times in the past, Treasury has used other inputs, such as interpolated yields and rolled down securities deemed necessary for deriving a good fit for the quasi-cubic hermite spline curve.
The current inputs are the most recently auctioned 4-, 8-, 13-, 26-, and 52-week bills; the most recently auctioned 2-, 3-, 5-, 7-, and 10-year notes; and the most recently auctioned 20- and 30-year bonds. The inputs for the five bills are their bond equivalent yields.
Between August 6, 2004 and June 2, 2008, to reduce volatility in the 1-year Treasury Constant Maturity (CMT) rate, and due to the fact that there were no on-the-run issues between 6-months and 2-years, Treasury used an additional input to insure that the 1-year CMT rate was consistent with on-the-run yields on either side of its maturity range. Thus, Treasury interpolated between the secondary bond equivalent yield on the most recently auctioned 26-week bill and the secondary market yield on the most recently auctioned 2-year note and inputted the resulting yield as an additional knot point for the derivation of the daily Treasury Yield Curve. The result of that step was that the 1-year CMT was generally the same as the interpolated rate during that time period. As of June 3, 2008, the interpolated yield was dropped as a yield curve input and the on-the-run 52-week bill was added as an input knot point in the quasi-cubic hermite spline algorithm and resulting yield curve.》
On top of all that manipulation, you’re adding more adjustments, with their own noise, right? Numerology?
rsm: Wow. Instead of railing against constant maturity yield estimates, why don’t you respond to my entire post addressed to you. Better yet, read Manski’s article. Oh, and I haven’t seen you comment on the NFP post.
rsm,
And the point of this is what? You don’t want to bash this for not mentioning error bars? When you refer to “you’re” are speaking to Menzie or somehow referring to the people who wrote this bit you quoted? Menzie was not estimating a full yield curve here, in case you were unaware of this?
The adjustments they added were obviously appropriate, although I guess you do not think so. Or maybe you think that using a quasi-cubic hermite spline curve is inappropriate? Sorry, but no, this is not “Numerology.” This is an appropriate function to use here, although maybe you find it not so because you do not know what the heck it is. Are you proud of exhibiting stupidity and ignorance here?
As it is, just to annoy various people, I shall note that I knew the person who invented/discovered the highly useful spline functions, the late Isaac Schoenberg, who worked for my late father at UW-Madison in (Army) Mathematics Research Center, the place that was subject to a fatal bomb attack in 1970.
rsm has lately been appealing to a 1986 paper by Fischer Black entitled Noise. A paper that rsm has never really read.
rsm,
I know some commenters here give you a hard time. I hav done wo at times, but I’m having second thoughts. I think maybe we are all missing something in your critiques of economics as represented in Menzie’s posts. I think you may not be innumerate, that the rest of us have simply misunderstood the eepth of your thinking.
I would like to encourage you to prove your detractors wrong. Here’s how I’d encourage you to do that: I’d like you to take the description of the interpolation of interest rates you have quoted here and enlighten us as to how that interpolation is wildly at odds with the notion of the time value of money. Here’s a link to save you time: https://en.m.wikipedia.org/wiki/Time_value_of_money
Using the concept of the time value of money, demonstrate how constructing a yield curve based on interpolated constant-maturity interest rates is dumb.
That must be your point, right? Because otherwise, your point seems to be that anything you can’t understand is wrong.
In which case Darwin, Newton and Kepler probably shouldn’t be taught in schools?
macroduck,
Careful here, although I know you are putting rsm on a spot he does not know where to go from.
Strictly speaking using spline functions is not the same thing as “interpolating,” although I suppose one can argue that they are a fancy way of interpolating. Iso Schoenberg developed them during WW II when they were used for making approximations for military purposes while he was working at the Allegheny Ballistics Lab in Cumberland, MD where my late father was working on rocket ballistics, the stuff that would show up in his 1946 book on The Mathematics of Space Flight.
i would argue splines are interpolating. what a spline permits you to do very easily is piecewise interpolation. hence a single spline interpolating over a single domain is nothing special, as in this treasure case. but you can stitch many splines together to cover a larger domain, and control the accuracy of the interpolation over each subdomain. since splines can be used to control the value of the function and its derivative at the endpoints of each subdomain, it allows you to create an interpolation over a large domain that is continuous in both the function and its first derivative. this is quite useful, if for instance you ultimately need to integrate over that domain. helps to eliminate unsightly discontinuities.
at any rate, i would imagine the treasury uses a “quasi cubic hermite spline function” because it eliminates the squiggly undulations at the end of the domain that a higher order polynomial would create if used for the curve fit. the point being, rsm, is that this particular form of interpolation is designed to intentionally decrease the “noise” that you are complaining about. not that you really care about that anyways.
baff,
Yes, this is basically right. The goal is to approximate nonlinear functions, but splines do so by estimatng a bunch of piesewise linear segments.
need not be piecewise linear segments. quadratic functions are probably the most useful compromise. these are most popular in the finite element method. you can typically map them over a larger domain than linear segments.
at any rate, it seems one would actually want to do this while fitting the yield curve. it simply makes no sense that rsm would have a problem with such interpolants if his big problem to begin with is noisy data. and yet he does not offer up an alternative. seems to me he was born to complain.
baff,
Agree. The pieces are in general polynomials, such as cubics. This is indeed a sophisticated way to do interpolating.
To be more precise, what spline functions are used for is to approximate nonlinear functions, another matter up my alley. Some elements of interpolating are involved in that, but that is not the main thing going on when one uses the useful functions.
Menzie Chinn, what source are you using for your current DKW estimates? Are they coming from KWW or are you computing them yourself?
joseph: If you go to the KWW article, and go down to Section 6, you will see a hyperlink to an excel spreadsheet with the latest estimates.
Professor Chinn,
Thanks for showing the calculations of the five year forward. Looks like columns (C) and (L) are the relevant columns for the calculations.
Hi AS.
It looks to me that he is plotting column C (expected inflation) which is the red line. And he is plotting column I (IC raw) as the blue line. However, it would be more accurate to plot column j (IC fitted) because that is actually the value that KWW are using to derive expected inflation in column C, although it doesn’t make a lot of difference to the overall picture.
IC is TIPS Inflation Compensation. This is the actual observed difference between market yield for nominal Treasuries and yield for TIPS, the so-called breakeven rate.
From the KWW paper:
The breakeven rate IC = expected inflation + inflation risk – TIPS liquidity premium
So of interest in the chart is the expected inflation which is derived by solving in the equation above:
expected inflation = IC – inflation risk + TIPS liquidity premium
If you examine the spreadsheet you will see that these correspond to columns:
column C = column J – column E + column F
Note that KWW are using column J, not column I, to derive expected inflation.
Then you can see that in deriving recent expected inflation, KWW are using a surprising negative value for the liquidity premium and that the liquidity premium, not inflation risk is by far the largest contributor to the gap shown on Menzie Chinn’s chart.
You did a more detailed review of the various data columns than I did. It looked like columns (C) & (L) worked to create the curves from DKW. Maybe Professor Chinn will review the various columns in a future entry.
Column (L) is the expected inflation using 10-year Treasuries. Menzie’s chart is using 5-year treasuries, as labeled. The .5 and .10 on the column headings refer to 5-year and 10-year Treasuries.
It looked like the second chart uses “Exp_Inflation_10” as part of the formula to calculate the DKW “5 year 5year forward expected inflation”.
AS: Yes, that’s right. I’m not adjusting the actual series by the estimated premia — just using DKW’s reported expected inflation series.
Happy to see AS is still in our midst. I was scared he was “going silent” (like some of Menzie’s sharper readers no doubt do).
The second chart is using Column U, for DKW adjusted 5/5 expected inflation, red line.
For the blue line on the second chart it looks like Menzie is using the FRED 5/5 series rather than the 5/5 breakeven rates from the spreadsheet. I’m not sure why the FRED series seems to differ from the spreadsheet series.
Thanks for the spreadsheet.
There’s some interesting information in the raw data.
First off, contrary to my expectations, under the DKW model the great majority of the gap between the breakeven rate and the expected inflation rate is not inflation risk but instead is the TIPS liquidity premium.
Even more surprising is that the liquidity premium is negative. And not just negative but negative by a lot — over 1%. This surprising result says that under the DKW model that TIPS are more liquid than nominal Treasuries at this time, which is weird considering that bid-ask spreads for TIPS are 10 times that for Treasuries.
And further, this implies that the spike in the breakeven rate between September and November has nothing to do with inflation risk, but instead is due to an increase in TIPS liquidity.
These results are surprising enough that I wonder if the DWK model is designed in such a way that is attempts to smooth expected inflation by explaining away all variation in the breakeven rate as due to factors other than inflation.
Seems apropos: https://twitter.com/Teutoburg1/status/1370351849664999427
https://news.cgtn.com/news/2021-11-07/China-s-foreign-trade-up-22-2-pct-in-first-10-months-of-2021–14ZsHRyyfn2/index.html
November 7, 2021
China’s October exports rise 27.1% due to stronger global demand
China’s U.S. dollar exports rose 27.1 percent year on year in October, beating estimates as global demands remain strong and energy demand grows, official data showed on Sunday.
Exports in October came in at $300.22 billion, compared with $305.74 billion in September, the General Administration of Customs data showed.
The growth in exports beats Reuters economists’ forecast of 24.5 percent and Bloomberg’s estimate of 22.8 percent.
Imports rose 20.6 percent last month to $215.68 billion, reversing the downward trend of 17.6-percent growth in September. A Reuters poll estimated a 25-percent growth in October’s imports.
https://news.cgtn.com/news/2021-11-07/China-s-foreign-trade-up-22-2-pct-in-first-10-months-of-2021–14ZsHRyyfn2/img/8c114244cc2a4697afab0493265f30f8/8c114244cc2a4697afab0493265f30f8.jpeg
The Association of Southeast Asian Nations (ASEAN) remained China’s No. 1 trading partner, followed by the EU and U.S. In October, total trade with ASEAN stood at $72.49 billion, lower than September’s $76.55 billion.
China’s trade surplus with the U.S. edged down to $40.7 billion from $42 billion in September, according to the customs data.
In the first 10 months of 2021, China’s total imports and exports surged 31.9 percent year on year to $4.89 trillion….
http://www.news.cn/english/2021-10/20/c_1310257421.htm
October 20, 2021
China’s FDI inflow up 19.6 percent in first 9 months
BEIJING — Foreign direct investment (FDI) into the Chinese mainland, in actual use, rose 19.6 percent year on year in the first nine months of the year, the Ministry of Commerce said Wednesday.
During the Jan.-Sept. period, non-financial FDI into the country totaled 859.5 billion yuan. In U.S. dollar terms, FDI into the Chinese mainland totaled 129.3 billion U.S. dollars, up 25.2 percent year on year.
FDI into the service sector increased 22.5 percent in yuan terms, while high-tech industries saw FDI inflow jumping 29.1 percent year on year, data from the ministry showed.
Foreign investments from the Association of Southeast Asian Nations and countries along the Belt and Road into the Chinese mainland jumped 31.4 percent and 31.9 percent, respectively.
Whomever sets food stamps benefits increases evidently has high inflation expectations. The raise beginning Oct 1, 2021 was variably reported at 23% to 27%, depending; they went up 5.3% in July 2020.
I looked up [Barron’s] market data [Fed annualized yields adjusted for constant maturity]. On, Oct 15, 2020 for the Five-Year UST was 0.33%; October 15, 2021 it was 0.98; Oct 22 – 1.00%; Oct 29 – 1.19%; Nov 5 – 1.18%.
Going forward, observe which direction inflation moves as the Fed monthly reduces purchases by $10B less USTs and $5B less MBS, from current monthly $80B and $40B, respectively; and the Federal government spends an additional $1.2 or $5 trillion.
OOPS! You’re only looking at 2021.
Never mind!
T.Shaw: Every time I show a yield curve or a inflation breakeven, I note the link to FRED, which provides daily data on constant maturity Treasury yields, both nominal and TIPS https://fred.stlouisfed.org/categories/115. For the rate right after market close, you can go to Treasury’s website https://www.treasury.gov/resource-center/data-chart-center/interest-rates/Pages/TextView.aspx?data=yield. No need to look up these data laboriously in Barrons.
Now you mention the interest rate data I’ve been citing is for 2021, and there’s been a taper announced. Clearly you have no understanding of finance, the meaning of the word “news”, the concept of “event studies” upon which thousands of business journal articles have been written. Specifically, if markets are efficient, then the five year breakevens recorded after Powell’s announcement should impound the information about future expected actions with respect to QE.
For the Pete’s Sake, can you read a finance book, or at least read this set of notes I wrote for my undergraduate students:
Asset Pricing.
I apologize.
I am a complete dope.
Realization of your true nature is a big step.
What Remains of the Inflation Scare of October 2021?
[ From China’s domestic perspective, sectoral inflation has been controlled and is dissipating. The Chinese approach is to directly intervene in sectors exhibiting significant price instability. Reserves of critical products tend to be 2 or more years, and reserves are readily used to counter price increases. An electricity shortage was experienced in September, but countered through October with increased coal production and delivery. There is now a domestic coal surplus, but the objective is to continually lessen the use of coal which means continued and quickened conversion to clean energy sources. ]
https://fred.stlouisfed.org/graph/?g=Gb0g
January 30, 2018
Consumer Prices for China, United States, India, Japan and Germany, 2017-2021
(Percent change)
https://fred.stlouisfed.org/graph/?g=HNv2
January 30, 2018
Consumer Prices for Russia, Indonesia, Brazil, France and United Kingdom, 2017-2021
(Percent change)
My hope is that with proper monetary and fiscal policy, and through the combined efforts of all true Americans, we can restore the price of a popsicle to 5 cents—as God intended it. The great horrors of the current loose money regime are manifested everywhere, like at my barbershop where a sign on the wall warns of a coming price increase for haircuts. I’ve started converting the basement of my house into a gasoline storage tank and all of my cash savings are in Bitcoin. Someday soon I’ll be laughing at Moses Herzog and all the Tesla drivers who have hitched their cars up to draft horses.
I could be wrong though. The markets shrugged off the taper announcement and the data Menzie shared above points to a likely scenario of 5 years of PCE around 2%.
Am I taking myself too seriously and this is supposed to be satire?? Honestly with people like Kopits, Sammy, CoRev, Bruce Hall, and Ed Hanson wandering around in the comments it’s kinda hard to decipher what is serious and what is satire half the time.
My Dad loved draft horses. And as a Depression baby my father also loved cheap popsicles, cheap movie tickets, cheap ice cream cones etc. And also the ethnic group I most “relate” to is probably German. My Dad would at least once every other day rhetorically ask me “What is the most beautiful word in the English language: [ pause ] FREEEEEEEEE!!!!!!! My Dad used to literally fume when my Mom threw away newspapers two months old he hadn’t read yet, because they cost him money and he was convinced there might still be useful information in those 2 month old newspapers. My bedroom growing up was on the outside of the house, and he would run the thermostat very low. If I complained about the cold my standard answer was “get another blanket”. I once had a grade school choir teacher (Black dude) who made a phone call to my parents in the middle of class, because he saw my feet had gotten so big for my shoes they had holes in them. He never gave my sister and I an allowance because he said kids shouldn’t get an allowance just for doing chores that are to be expected of them anyway. I am no fan of inflation. In my late teens and early 20s I used to go to an old school barbershop run by a white haired guy named “Carmel” who proudly hung his Freemason membership on the wall. Most young men I knew then were going to “stylists” and paying $20+. He snipped my ears twice but I kept going because he was only $8 for a full haircut. I can’t afford a Tesla, I am an Asian imports guy, same as my father. I still look around for $10 T-shirts, $40 jeans, and $40 sneakers. I wait to get things I “need” so I can get a good deal. Sometimes months looking inside ad circulars for that unheard of price. I once got a DVD machine at Target for cheaper than it was offered at Wal Mart~~because I can read. And if you shop at both of those stores, you’ll “get” how unusual that is. When my father negotiated together with me for my first car, after talking with about 3 different salesman for hours and nearly walking out of the dealership, the owner of the dealership came out to talk to me and my father and as we J**ed him down he said with a straight face “We have to pay the light bill here too you know”. Shall I go on?? I bet Menzie believes me when I say I could fill up about 5 single line typed pages of these stories, I’m just getting warmed up. Have you purchased 18cent limes in good condition in the last two years?? I never pay more than 25cents per lime, and I feel like I’m letting them off the hook by not leaving them at the store when they go above 20 cents per lime. I get 85% of the books I read and the movies I see from the public library.
I got my tires patched for FREE, TWICE at a place that I didn’t even purchase the tires at.
Ok, is that enough “Poor white dude, feel sorry for me, sob stories” for the time being??
I am no fan of inflation. Neither am I a fan of seeing things that aren’t there. Or certainly things which are not systemic/perpetual issues for the most part, but a transitory effect of a world health issue, which aren’t issues which normally have a relation to supply and demand curves.
I guess as long as a Coke cost more than 5 cents, you will be screaming HYPERINFLATION.
David,
From your popsicle-stained lips to God’s ears.
Having taken your views into account, I have entered into a Tesla/sweet-feed-futures swap, leveraged 5/1. I don’t mind taking delivery even if the horse thing doesn’t pan out, as sweet feed makes a dandy moonshine.
Mr. Macroduck and pgl and Moses,
The definition of satire is voters in Wisconsin sending Ron Johnson to the U.S. Senate chamber (or is that tragedy?)
Speaking of tragedy, that’s what following investment advice from me would result in.
Comedy is the University of Austin that Tyler just announced on his blog—maybe I should give it the benefit of the doubt, but having big name sponsors means nothing–just ask Elizabeth Holmes. (prediction: she gets acquited)
Moses, you’re getting robbed: I’m wearing a $7 t-shirt from Amazon and I’m going to buy some $28 blue jeans if I can make up my mind.
Why I am writing this? This thread is dead while everyone is using Sammy as punching bag 4 posts up.
I am not sure that we can use the price of TIPS for anything related to predicting future inflation. A lot of ignorant people moved money out of regular treasuries and into TIPS after the press began drumming up fear of higher prices. That is just the usual circus of Wall Street driving the sheeple into the slaughterhouse. However, it does change the price of TIPS dramatically during the process. But those flips in the price of certain papers relative to others has nothing to do with whether the cost of making products and services have any lasting upward trends – or companies have gained lasting pricing powers.
Ivwn,
Yep, that can be a problem, particularly in the short run. Reading (adjusted) TIPS pricing over a period long enough to get past scares should tidy things up, though.
One thought – while one’s (dis)belief in the wisdom of crowds might lead one to accept TIPS pricing as a forecast or not, TIPS pricing works as a read on “expected” inflation. If Wall Street stampedes the public into expecting inflation inappropriately, that’s still an expectation. Mostly, though, adjusted TIPS pricing has not shown a serious rise in inflation expectations.
just out of curiosity, has anybody on this board ever actually purchased TIPS for their own account?
i have purchased I-bonds (savings bonds) from treasury. but any other bond product has been through a fund or etf, never a direct purchase of the bond.
i ask this because of the commentary that people are fooled into TIPS by the press and wall street. are individual investors buying these, or are they really institutional and wall street purchases?
baff,
Got some in some bond funds I have, but not specifically.
Apparently, quite a lot remains of the inflation scare, with Oct CPI coming in at 6.2%.
I had an interesting experience this morning, filling up at BJs in Hyannis. BJs has, bar none, the lowest gasoline prices on the Cape. What was interesting was the large number of trucks filling up there. I had not seen that before, and suggests that gasoline prices are really beginning to bite. If the trend holds, expect a total wipeout for the Democrats next year.