From the markets:
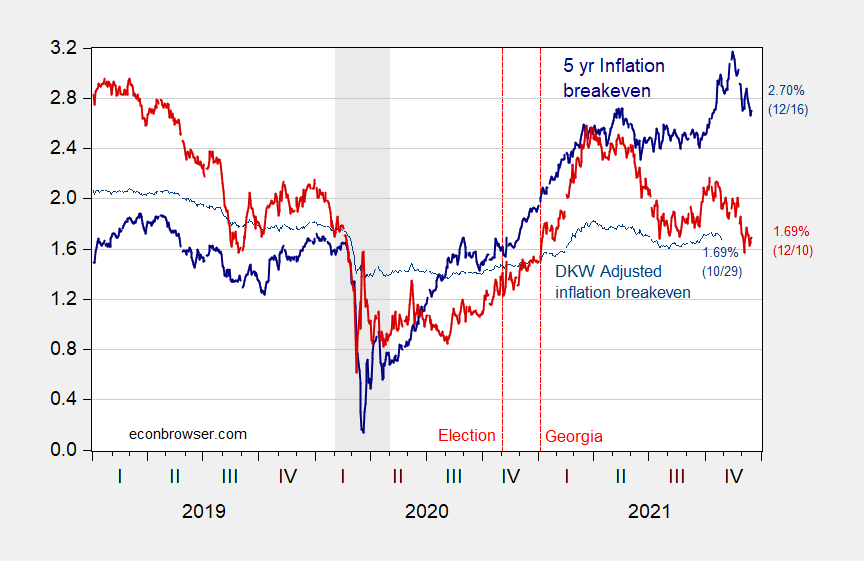
Figure 1: Five year inflation breakeven calculated as five year Treasury yield minus five year TIPS yield (dark blue line), five year breakeven adjusted by inflation risk premium and liquidity premium per DKW (light blue thin line), five year five year forward expected inflation calculated from Treasury and TIPS yields (red), all in %. Source: FRB via FRED, Treasury, Kim, Walsh and Wei (2019) following D’amico, Kim and Wei (DKW) accessed 11/5, NBER and author’s calculations.
Markets seem to indicate average CPI inflation of about 2.7% over the next five years, down considerably from a month ago. Long term expected inflation, as proxied by the 5 year 5 year forward spreads, is also down from two months ago.
What was it 5 years ago? 10 years ago? Was it anywhere near actual? Are these derivatives more about hedging than prediction? When will economists realize finance relaxes all the constraints they dream up?
rsm: (1) Re: forecasting, see this post; (2) I am not using derivatives here. You really should try to understand what is being analyzed before asking such questions.
rsm,
Following is a link to the FRED 5-year breakeven series, T5YIE:
https://fred.stlouisfed.org/series/T5YIE/
When I downloaded the values and lagged them five-years, T5YIE seemed to compare favorably with actual, not exact, but seemed close enough for my expectations of useful forecasts.
As I recall there is a quote saying attributed to Geroge E.P. Box, “All models are wrong, but some are useful”
Here’s a somewhat dated analysis of TIPS breakeven performance. https://seekingalpha.com/article/4086587-tips-inflation-break-even-rate-accurately-predict-future-inflation
The results donot exactly inspire confidence. As for its usefulness, it could serve as a good conversation stopper, except perhaps among economists…