Confidence Intervals
Reader Steven Kopits is critical of them:
If the historical data is relatively stable compared to future events, then confidence intervals or the like can be useful. So, for example, if we take traffic on the George Washington Bridge and adjust for weather, time of day, day of year, and weekend/holiday, then I think a confidence interval is a useable piece of information. You can make decisions on that basis. …
However, if the data is unstable or not well understood, if the methodology is new or not well understood, and if the exceptions to the general rules are not well understood, then confidence intervals can provide a false sense of confidence. For example, if I fail to adjust GW Bridge numbers for time of day, then confidence intervals will be effectively useless. So if I took average transit times on the bridge, but crossed at 3 am, then I would likely be too pessimistic about transit times.
I find confidence intervals are often used for political purposes, to project certainty where methodologically, that overstates the case. Sometimes materially. Hurricane Maria in PR serves as a case study.
Readers will recall that Mr. Kopits provided a range of estimates in the case of Hurricane Maria, which subsequently turned out to be too low. On 5/31/2018 he wrote:
I would expect the excess deaths at a year horizon (through, say, Oct. 1, 2018) to total perhaps 200-400.
He subsequently raised on 6/4 his estimate to 1400 as of Dec 2017 (see this post for discussion). You can see the various estimates as tabulated by Sandberg et al. (2019) here.
To summarize graphically:
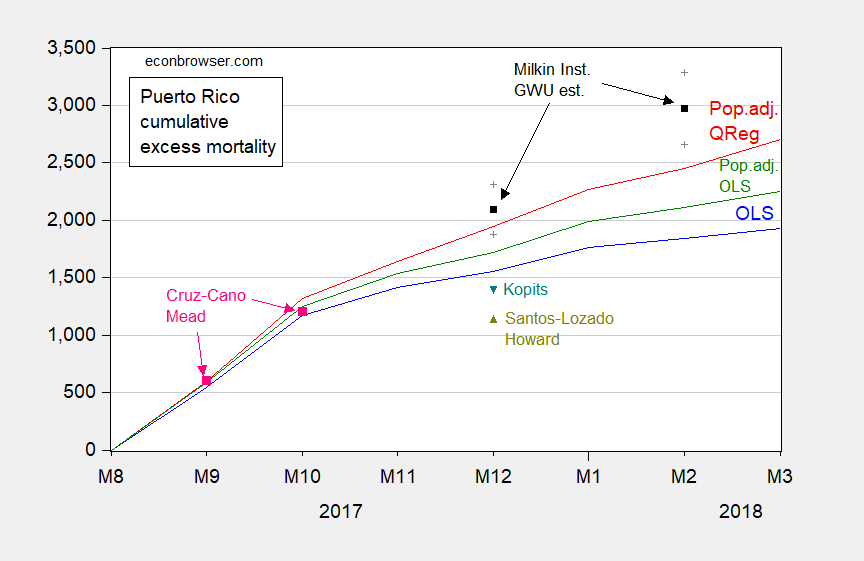
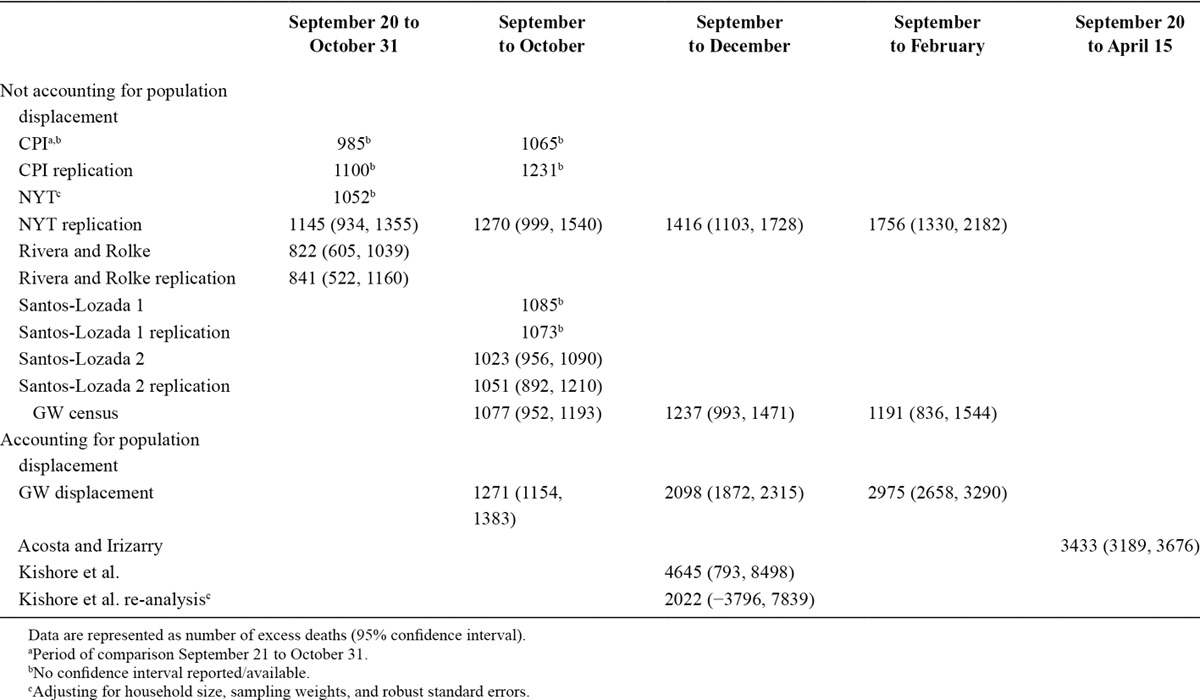
Figure 1: Cumulative excess deaths from September 2017, for simple time dummies OLS model (blue), OLS model adjusting for population (green), and Quantile Regression model adjusting for population (red), Milken Institute point estimate (black square) and 95% confidence interval (gray +), Santos-Lozada, Howard letter (chartreuse triangle), Cruz-Cano and Mead (pink squares), Kopits (teal triangle). Not pictured: Kopits estimate of 300-400 for October 2018. Source: author’s calculations, Milken Institute (2018), Santos-Lozada and Howard (2018), Cruz-Cano and Mead (2019), and Kopits (2018).
For a long examination of Mr. Kopits’ failure to understand what a confidence interval is, see this post.
So, my view – confidence intervals are useful. Even if they are wide (in which case they tell you to beware the siren call of certitude). They certainly beat “pull it out of one’s a**” approach. Since Mr. Kopits is unlikely to believe me, I’ll note David Romer’s praise of confidence intervals.
Final point on confidence intervals: On the issue of changing conditions (I’m not sure what “unstable data” is), there are ways to account for time variation in the standard errors. The most-simple minded (I teach my undergraduates!) is to do a rolling regression. Consider the regression:
Δp$Import = α + βΔs$ + u
One can estimate this with a rolling window, of 24 months in this case. I use the BLS measure of import prices of commodities for the left-hand side variable, and the (nominal) broad trade weighted dollar exchange rate for the right hand side (both logged, in first differences). For full sample:
Δp$Import = 0.002 + 0.44Δs$ + u
Adj-R2 = 0.22, SER=0.011, Nobs = 314. Bold face denotes significant at 5% msl, using HAC robust standard errors (Newey-West).
β coefficient estimate and +/- 1.96 standard errors below:
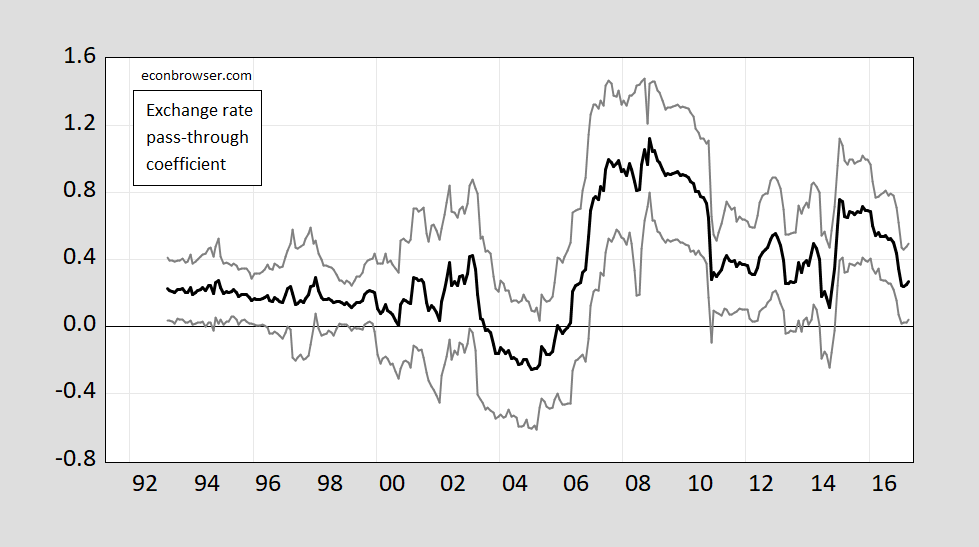
Figure 2: Exchange rate pass through rolling regression coefficient, 24 month window (black) and +/- 1.96 standard errors (gray line). Source: Author’s calculations.
Logs
Regarding my time series plot of Long Beach Port traffic, Steven Kopits writes:
Why would you even think to present that in log terms? Totally deceptive. Do the graphs straight up.
I actually think it’s deceptive to plot things in levels when one is interested in growth rates. Consider the PCE deflator. If you plot in levels, it looks like the price level has been growing at a constant rate since about 1985 to 2020. If you plot in log levels, you see that the pace has slowed since after the Great Recession (in other words, a straight line in a base e log scale denotes a constant growth rate).
Figure 3: Personal consumption expenditure deflator (blue, left scale), personal consumption expenditure deflator (brown, right log scale). NBER defined recession dates peak-to-trough shaded gray. Source: BEA, NBER.
For more on anti-log discourse, see this post.
Question for everyone: Do they still teach logs and exponentiation in high school?
I’ve only clicked on his links once, when he was trying to play revisionist history on his $100 oil price prediction before the end of 2021. And even clicking on that site once about gave me the dry heaves, like worse than after I’ve had like 2250ml of alcohol. I mean, he’s way off the map. That is the thing that is so incredibly offensive about him, he claims to have a Master’s, yes?? We would guess CoRev was lucky to even attend college, yeah?? Am I gauging this right?? And yet he says things that are every bit as dumb as CoRev. That should be highly offensive to anyone who believes in education and shame inducing to his former profs. I mean I went to a small 4-year state university (yes with some graduate programs) , only got my Bachelor’s (thereby barely narrowly avoiding my Father claiming I must have been left on the front porch by an anonymous ostrich) . Yet I can at least have a grasp of these things. I mean I have many negative traits but the one thing you can’t say is that I’ve tried to “pass myself off” as something I am not on here. I don’t just have problems sometimes doing differential equations, but even sometimes (much to my shame because I remember doing them in college) now have problems and hick-ups doing linear equations. But I can sense some of his statements are WAY off the map. The man with his Master’s. I swear to G*d I want to call up “admissions” or “Office of Student Records” up at his school and ask if they have a record of him even getting his Bachelor’s. Who takes a Stats class and doesn’t understand confidence intervals?? It’s not a damned matrix.
Who predicts that if a country raises it’s GDP dramtically (and one would assume therefor has more “happiness” or higher quality of life) the next morning they get up out of bed the demand democracy?? I’ll tell you who: A flaming moron.
Validation for Stalin – Huaracan Maris edition. “One death is a tragedy; one million deaths is a statistic.”
Wow!!
Did you just, 15 minutes ago, finish consuming that 2,25ml of liquor?
When Moses wrote this wisdom:
‘Who predicts that if a country raises it’s GDP dramtically (and one would assume therefor has more “happiness” or higher quality of life) the next morning they get up out of bed the demand democracy?? I’ll tell you who: A flaming moron.’
He may have read Princeton Steve’s latest blog post which was a real piece of work. Go read it for yourself and you will need to drown yourself in vodka just to get it out of your mind.
Stork, not ostrich, excuse me, No T. Shaw, I did not, but I wouldn’t blame you for thinking I was imbibing for mixing up ostrich with stork.
I suspect ignorance on Mr. Kopits part is a choice, though perhaps not a conscious choice.
One can approach the world with curiosity and an open mind, or one can cling to one’s priors with a death grip. Ideally, those who engage in research should all be of the former type, but a shocking number of consultants, scholars and researchers think they know the answer before they are done formulating the question.
A common characteristic of the death-grip crowd is that they sell their views with swagger and certainty. They assert, rather than show. In a sense, curiousity is modesty, while certainty feels no need for modesty.
Another comon characteristic of “my priors ARE my answer” thinking is that the priors grow out of an ideology. Trumpism is too easy an example. Think of the notion that contracts are by nature fair because parties enter into them by choice – a Federalist Society shibboleth. Or the idea that cutting marginal tax rates inevitably leads to better economic performance. Or, to go back in time just a bit, the notion that non-whites (Jews, Slavs, the Irish, Italians, non-Anglo-Saxons) are inherently inferior. “Everybody knows” these things, so one simply assumes them, asserts them, and moves on. Kopits “knows” that presenting this or that data series in log terms is wrong. No need to explain why.
And of course, defense of ideology commonly involves questioning the other guy’s motives. The other guy disagrees, so (s)he must intend to deceive. It’s the other guy who has bad motives, not the guy employing cheap debating tricks to defend his priors.
Now, I assume Kopits doesn’t need to be taught the distinction between levels and changes, what with his degrees and all. But in the “Why would you even think to present that in log terms?” case, he is certain that showing levels is the only non-deceptive thing to do. Never kind that the sneaky, deceptive Professor Chinn was demonstrating rate of change.
Mr. Kopits “knows” that log terms are wrong when they don’t suit his priors. He “knows” that trade is messed up because of fiscal policy, because he “knows” that fiscal policy is too expansionary (never mind that there may be more important policy goals than a narrower trade gap).
This little dust-up is not about ignorance as ignorance on the part of Mr. Kopits. It is about insisting on ignorance as a way of insisting on his priors. Clinging to one’s priors is not how knowledge progresses.
Amen to everything you wrote but permit me to highlight this:
Mr. Kopits “knows” that log terms are wrong when they don’t suit his priors.
Check out his latest comment here as this dimwitted troll is now saying plotting imports as a share of GDP is deceptive. Now I would not have thought any one was THAT STUPID. But I guess I was wrong.
So, not just Trumpists, but also other Republicans. Those are your wider examples of holding priors too dear? 😉
Couldn’t find any examples on the left? Couldn’t come up with an apolitical (sports, art, business, history) example?
I would think it is more of a human failing than one of a particular party.
Menzie, thank you for this explanation, and your continued efforts to present data in a rigorous and useful manner. I’m sorry that people like Kopits, rsm, and others are immune to understanding. They should polish their resumes for jobs in the next Trump administration.
I vaguely remember being taught about logs and exponents in high school, but like most humans, the concept of non-linear growth can be deeply counterintuitive and generally incredible. Compared to an age where we only had to kill one mammoth a week we seem to be living in an age of “fat tail” effects where the ground is constantly shifting under our feet. The most recent example is the spread of the Omicron variant, which could have considerable impacts on life for the next few months.
Princeton Steve accused your use of logs in that context “totally deceptive”. Seriously?
Let’s give him some credit for this admission:
‘I find confidence intervals are often used for political purposes, to project certainty where methodologically, that overstates the case. Sometimes materially. Hurricane Maria in PR serves as a case study.’
His low balling the reality of deaths in Puerto Rico from Hurricane Maria certainly serve the political purposes of the Trump regime back in 2017.
Strange world we live in. rsm insists on confidence intervals for everything including whether to put on a coat when the weather man says is is cold outside. Princeton Steve takes the opposite view – do not do confidence intervals even if they are useful as that might get in the way of the MAGA agenda.
Now Steve makes a point here that CoRev should think about before putting forth things like his most recent garbage with respect to COVID-19 and the vaccines:
“For example, if I fail to adjust GW Bridge numbers for time of day, then confidence intervals will be effectively useless. So if I took average transit times on the bridge, but crossed at 3 am, then I would likely be too pessimistic about transit times.”
Now CoRev protests that Menzie provided the link that CoRev refused to provide us. Sorry CoRev – but your latest dishonesty has been exposed.
Plot Fig 1 from the linked post as you presented it and additionally with a linear y axis, and I will show you why it is misleading and deceptive. Looking forward to the post.
https://econbrowser.com/archives/2021/12/how-much-of-the-trade-deficit-is-due-to-surging-non-oil-goods-demand
Steven Kopits: Figure … 1… is … plotting … a … share variable. Think about that.
Use a linear y axis. Or do I have to do the post on this?
Steven Kopits: So, you are saying that the Kopits standard is all y-axes have to be linear? I would actually love to see a post you write on the necessity of having all axes by in linear format. I would in that case actually read what you have written on your blog.
Warning. He writing style is to write for something like 10 pages for each of his weird “points”. His latest screed trying to defend his nonsense that high income per capita must lead to democracy was all over the map for page after page after page.
Excuse me but do you even remotely understand the simple arithmetic of plotting imports as a share of GDP? Never mind the reasoning for presenting shares – me thinks your pre-K arithmetic teacher has lost it with her most arrogant but stupid student ever. Please do not try to mansplain us on this matter as your long winded diatribes are already too much for anyone to stomach.
the second derivative gets no respect, any more.
My initial estimates were based on PR mortality data, which is turns out, was far more inaccurate than I would have anticipated, and of course, the data were not publicly accessible. Later, reporters got hold of the data, and I adjusted the estimates accordingly. These have held up well compared to the range of other estimates. I would note that the GW estimate remains high. Habeus corpus. Show me the bodies. GW can’t.
Let me also make a few points about estimates and CIs.
The original Kishore (Harvard) estimate is so high that you don’t even have it on your graph. Deceptive.
Second, note the incredibly wide CI, from 800 to 8500. What should a decision maker do with that? If you have 1400 extra bodies in the morgue and a mean estimate of 4,600 excess deaths, what should the governor do? Does he send out the cadaver dogs, the recovery teams, the excavation equipment? That’s what they did at Surfside, because they believed that people and bodies were trapped beneath the rubble. But they didn’t do that in PR. Why not, if Harvard felt confident in its mean estimate? For you, Menzie, statistics are just math exercises. In the real world, they drive decisions. The Harvard study was dead wrong in terms of driving action.
Second, note that the mortality estimates increase after Jan. 1 2018. For example, the GW study implies that 900 excess deaths occurred in January and February of 2018, that is, the 4th and 5th months after the hurricane ended. So walk me through that on a first principles basis. So, say, someone on dialysis managed to survive 90 days, but on day 100 died of hurricane-related something? That is, GW thinks that more than 40% of the excess deaths occurred more than three months after the hurricane. So explain that to me. Let’s hear some specific examples.
Finally, what the hell is the -3,796 lower confidence interval in the Kishore re-analysis. Is he saying that he cannot preclude that Hurricane Maria raised Puerto Rico’s population by nearly 4,000 people? How do you get a negative confidence interval on deaths? Do you think that lower CI bound is total garbage? Of course it is. You’d have to have some sort of really exotic thesis to suggest the Hurricane raised the population when there are excess bodies in the morgue. Again, this is the printing of mindless statistics without any consideration of the real world implications contained therein. But, unless you misprinted the CI, that’s what the stats package spit out. Would I present that number? Hell, no. That’s exactly an example of the situation where you do not want to publish a CI.
Steven Kopits: These are not just math exercises to me. Unlike you, I worked in the US government, performing analysis in executive and legislative branches. A wide confidence interval can be actionable – because it informs one about how reliable a point estimate is. You don’t want to be overconfident about the precision of your point estimate when real life decisions have to be made.
I’m not sure working for the government is a particularly good credential nowadays…
But explain to me what Kishore’s lower CI limit of -3,796 means. What is the real world interpretation of that number?
OK but being a frequent guest on Fox and Friends is certainly evidence that your credentials are truly superior?
Steven Kopits: White House Council of Economic Advisers staff under Bill Clinton and GW Bush (so, *not* Trump) – I’m proud of that. National Fellow, Congressional Budget Office. Consultant (twice) International Monetary Fund. Visiting scholar, Federal Reserve Board, International Finance Division (multiple). Duisenberg Fellow, European Central Bank. Consultant, Banque de France (ongoing). So if USG is not so good, maybe those might inform your views a bit more.
What does -3,796 mean? Interpret that for me.
Steven Kopits: Do some math and refer to a Normal distribution table. It would mean a 50% confidence interval would just encompass a value of 0. That would in turn mean that one should ascribe a low degree of precision to the estimate at hand; I think that is (very) useful information.
Slacker……..
“For you, Menzie, statistics are just math exercises.”
In case anyone missed it, this is just another boilerplate version of Republicans/”conservatives” deriding and denigrating those with an above average education and/or knowledge. The same Republicans who will rob other Americans of a quality public education, fully-funded and fully-resourced, as they simultaneously send their own children (often off of a family inheritance from their parents) to an expensive private school.
Actually I think Stevie is saying that shilling for corporate clients pays a lot more than serving as an advisor to Presidents who actually give a damn about good government policy.
PGL claims: “Actually I think Stevie is saying that shilling for corporate clients pays a lot more than serving as an advisor to Presidents who actually give a damn about good government policy.” What a novel comment.
The normal comparison is to job security. Private sector employees produce and make a profit for the company. If not they lose their jobs. Government and education jobs seldom are based upon profits and are protected with civil service rules and tenure (often coupled with some level of protective civil service rules.)
CoRev
December 21, 2021 at 9:48 am
Does CoRev realize he just endorsed corporate lying and theft as the best way to make a profit? I’m sure he does. Which is to show what we suspected all along – CoRev has no moral center. It’s all about money no matter how you get it. Thanks CoRev for making that crystal clear!
PGL, do have even a lick of sense? https://schoolofpoliticalscience.com/differences-between-public-and-private-administration/
Differences Between Public and Private Administration
Points of
Comparisons ——Public Administration ———————————————————————— ———-Private Administration
Definitions Public administration refers to the activity of governmental organization or institution Private Administration refers to the ——————————————————————————————————————————————————activity of privately owned —————————————————————————————————————————————————-organizations or institution
Goals and Objectives —–Public welfare ————————————————————————————Maximisation of profit
Legal Framework ———-Governed by a statutory law ————————————————————————Governed by the directors of the ——————————————————————————————————————————————————organizations
Public Accountability Accountable to the people for its actions —————————————————–Only accountable to the owner of ——————————————————————————————————————————————————-the organization
Freedom of Action Limited freedom of action ——————————————————————————Its freedom of action is much wider
Political Character Run by political direction and regulation —————————————————Completely separated from politics
Approach ————Bureaucratic approach —————————————————————————–Egalitarian approach
Revenue or Income Taxes, duties, fees, etc. —————————————————————————–Seles of products and services
Scope ——————-Much wider in scope ————————————————————————————limited in scope
Question of control
by economic interests—Not controlled by any economic interest —————————————————Fully depends and controlled by —————————————————————————————————————————————————-economic interest
When Harvard and GW prints statistics that look to the casual viewer like fabrications, what does that do for the credibility of the medical establishment? Does the public trust the advice ‘science’ is giving them? Maybe they don’t, because ‘science’ has allowed itself to become politicized and thereby tanked its credibility. So if ‘science’ says to get a vaccine, how much stock will, say, Trumpers put in that?
If you check my comments from the time, I am pretty sure I commented on the incredibly corrosive effects of Harvard’s numbers on the credibility of the US public health system. I stand by those comments, and these.
Steven Kopits: How is a study by a Harvard School of Public Health scientist corrosive to the US public health system? I’ll let you find your comment, and provide the URL – I’ve not signed on to be your RA.
If Harvard says 4600 and the media has a field day with that, and then it turns out that the real number is closer to 1400? You don’t think we have a credibility problem there?
Hey. Just take the logarithm of each and they’re only 16% different. I keed. 🙂
+1
Evidence that this has happened? You are bordering on CoRev level of dishonesty here.
BTW Menzie – CoRev is now defending his vaccine dishonesty challenging you to post a new thread. And he has finally provided a link – one that me thinks he does not understand.
“So if ‘science’ says to get a vaccine, how much stock will, say, Trumpers put in that?”
Are you now campaigning to get on Tucker Carlson now? Do you really believe these vaccines do not reduce the risk of dying from COVID-19? Seriously?
Veritas.
In 2020, Biden [From his basement or a car rally attended by eight people, I forget.] said he had the plan to beat COVID 19.
Is he waiting until 2024 to implement his plan?
Aequitas.
CIs
Kopits’s critique is valid but moreso as a critique of models rather than confidence intervals. Disdaining a model is one thing (all models are wrong…), but offering up a worse one is another (…but some are useful). I don’t understand hating on CIs specifically, and especially when the alternative method of conveying uncertainty they endorse is…pulling a range out of thin air. Odd.
I think one could address the criticism more charitably (though I don’t know the full commenting history, so maybe there is a reason for it). I think it’s extremely clear from Kopits’s post that they’re talking about stationarity (they literally give an example of a time-varying mean, come on), and on another level one could also think of omitted variables bias. I’m using the highbrow terms, but the vernacular critique is no less valid (although: 1. it doesn’t apply exclusively to CIs, this is a modeling issue! and 2. any proposed alternative should address the problem, and “just wing it” does not).
Logs
Yup.
Daniel –
You’ve walked into the PR governor’s office, and you say to him, “Mr. Governor, we have established that mean excess deaths is 2022, but at the lower confidence interval, it could be -3,796.”
And the Governor says, “So, you’re saying that the hurricane may actually have increased the population by nearly 4000 people? That’s incredible. I didn’t even know that was possible. Tell me about it. How could that have happened?”
If that conversation ever gets to that level, you as the advisor are f**ked. That’s the difference between a junior analyst and a project manager or managing director.
Or the difference between an academic and someone involved in decision support. The junior analyst just publishes the data; the managing director says, “That’s nice, but, we’re not going to put that down on paper, because I’m not going to have that conversation with the Governor.”
“I’m not going to have that conversation with the Governor”.
How many Presidents of the USA have you ever provided economic advice to? No one remotely interested in good policy is going to have a conversation with a failed consultant like you. Now Trump might LOVE to have you on his policy team.
I have provided advice to MOL, Hungary’s largest oil company; to the Hungarian government regarding industrial policy and privatizations; I led the technical team on the privatization of Hungary’s second largest bank; I gave the Hungarian government advice regarding its largest steel mill, which took in subsidies of 0.25% of GDP. I have advised on billion dollar investments in the United States and strategies for a number of Fortune 500 firms.
So, yes, I understand what you say and don’t say matter. There are issues of judgment and presentation, not merely analysis.
But you have also stated your disdain for Hungary’s government. Go figure!
Which Hungarian government?
I’m sure your advice to MOL is what created this EU investigation:
https://www.reuters.com/article/mol-omv-eu-idUSBFA00057520080306
I bet MOL and OMV would love to form an Eastern European energy cartel. And with Hungary’s 9% corporate tax rate, I bet you were the master at transfer pricing manipulation. What a guy!
“Steven Kopits
December 21, 2021 at 11:29 am
Which Hungarian government?”
Dude – your said you did some wonderful consulting for THE Hungarian government but you sort of forgot to state which one or when.
Do you ever pay attention to your damn writing? I hope so because no one else does.
Your own (worthless) blog said Hungary is a weak democracy. Gee – it is also considered the most corrupt government in the EU. Is this the consulting advice you so proudly brag about providing to a corrupt government where bribery is rampant? Go figure!
https://www.ganintegrity.com/portal/country-profiles/hungary/#:~:text=Public%20corruption%20polls%20reveal%20that%20a%20third%20of,paying%20bribes%20to%20judges%20%28GCB%202013%2C%20Eurobarometer%202014%29.
I did work for all of the conservatives, socialists and fiscal conservatives. I also interacted quite a bit with communist era apparatchiks. Technically, so one them would have counted as clients.
Yes, I think Hungary does indeed constitute a weak democracy. It’s survival there is not assured, best I can tell.
Professor Chinn,
Trying to follow your data presentation on exchange rate pass-through coefficient.
Are you using the equivalent of FRED series: “IR” for the price of commodities and the
FRED equivalent of: “twexb” for (nominal) broad trade weighted dollar exchange rate?
Thanks
AS: Yes, that’s the series. The vintage of my series is mid-2019; the latest vintage at FRED differs somewhat.
Thanks, I noticed the “twexb” series has been superseded by “dtwexbgs”.
I am getting a negative sign on EViews, c(2) for the model. Moving to the back of the class.
AS: I defined the exchange rate in real $/real foreign currency units, which is the opposite of what is in FRED/Board (they define as *value of US dollar* rather than exchange rate). I’m using the international finance convention. You’ll see the coefficient you get is equal & opposite sign of mine (if you match my sample period). Also, I spliced together the goods and services version to the goods version (the earlier version).
Thanks sorry to be a problem.
Looks like we need to be in your class, so much to know.
AS: This particular problem (how are exchange rates defined) occurs all the time – int’l finance people define it the way I did in this post, most domestic macro people define it the other way (the way the Fed Board and BIS and IMF do — often done for trade weighted or effective exchange rates).
Great questions and great answers. THIS, the above exchange between Menzie and “AS” is why I read this blog and why I LOVE this blog. For all those who complain we “only argue” on this blog, you’re not paying attention.
Copmala Harris’s new side-hustle~~Embarrassing the Biden administration and having Fauci and other health officials run around to the media cleaning up her public relations messes and “gaffes” (that’s assuming she’ not intentionally poisoning the water in the White House). If Biden keeps her on for 2024, he is either incredibly dumb, or feeling somehow it’s beneficial to have the snake nearby and “contained”.
https://www.theguardian.com/us-news/2021/dec/18/kamala-harris-la-times-interview-covid-variants-vaccines
This is Copmala’s 2nd big mistake since the administration started, embarrassing Biden on a very large platform—first NBC discussing the southern border, now LA Times. How many more gaffes of Copmala’s does the White House want to sit through??
“Kamala Harris concedes White House ‘didn’t see’ Delta and Omicron coming”.
Was that her gaffe? Or was it her statement that Republicans are lying to us about the benefits of getting vaccinated? Look – this virus has surprised a lot of us. I would rather admit this than be like Trump and his confidence that it would all wash away be Easter of 2020.
Copmala must have been sleeping on the day Biden’s science staff, not to mention his political aids told him that the chances for mutations and therefor virus variants was extremely high (does anyone above a 4th grade education (and Copmala) not</b< believe Biden was told this multiple times by staff??) My best guess is that on that day, or more likely, those dayZZZZZZZZ, Copmala was out with Neera Tanden at Starbucks getting an iced mint mocha, discussing how they could dupe 20 years of salary out of the Center for American Progress once everyone in the White House figures out their only skill might be selling My Pillow and “advantage” Medicare. Perhaps a job as Kopits’ VP of Marketing.
From Hugo Lowell of British paper “The Guardian”
“The trouble for Trump – and part of the source of his frustration, the sources said – is his inability, out of office, to wield the far-reaching power of the executive branch to affect the course of the inquiry.
The limited success of strategies he hoped would stymie the committee – ordering aides to defy subpoenas or launching legal challenges to slow-walk the release White House records – has been jarring for Trump.
‘I think what he’s finding is that as the ex-president, he has a lot less authority than he did as president. But his playbook doesn’t work if he’s not president,’ said Daniel Goldman, former lead counsel in the first House impeachment inquiry into Trump.”
From another portion of the article:
“When Trump sees new developments in the Capitol attack investigation on television, he has started swearing about the negative coverage and bemoaned that the House minority leader, Kevin McCarthy, was too incompetent to put Republicans on the committee to defend him.”
More from the Hugo Lowell article:
“The portrait that emerges from interviews with multiple sources close to Trump, including current and former aides, suggest a former president unmoored and backed into a corner by the rapid escalation in intensity of the committee’s investigation.”
https://www.theguardian.com/us-news/2021/dec/20/capitol-attack-investigation-closes-in-trump
Trump looks weak, fat, ugly, like a loser. Almost like someone grabbed him by the p*ssy. You can do that yeh know, with donald trump, grab him by the p*ssy. You can move on donald trump like a B—- .
I don’t think Kopits understands the very basic aspects of IID sampling statistics, let alone differences in looking at time series versus IID. And the importance of differentiating esactly what error is estimated. For example, his example of a daily average versus a time of day snippet is silly as well. Apples and oranges. Like people complaining about a frost last night, when global warming raised averages over a century.
Whole thing reminds me of the almost trivial economic errors I see on the net in terms of supply and demand, sunk cost, NPV, etc. I say this as someone who is FAR from a statistician or an economist (never even took real courses). But the level of discussion, even from long term participants (thus had time to educate self on the very basics) is a drag. I would think it would especially bug an academic, as even just for a slightly better hoi polloi, it bugs me.
I say all of this with some warmth to Steven. I like his personality and his industry focus. But, ugh, if I have to hear about “supply constrained” or “demand constrained” or similar buzzword silliness rather than a classical supply-demand analysis, to include discussion of free competition versus monopolist behavior….grr.
The discussion of hurricane death thing seems tangential. Sort of neener, neener. He could have made a bad guess on a future number (or even methodology of ascribing deaths), but that’s a pretty different issue (ability to forecast, and one specific incident), not a discussion of CIs, meaning, understanding of them, etc. Like are we going to turn to a debate on hurricane death #s now, versus CIs?
For what it’s worth, this is my favorite CI plot:
https://www.eia.gov/outlooks/steo/images/fig1.png
And it is amazing how many people on the net, debating oil price, peak oil, etc. are ignorant of it. And the bounds are NOT based on EIA estimates, or some time series finagling. They are based on traded FIXED PRICE options. Like Vegas odds! And again amazing how many people are ignorant of their existence, don’t know the difference between them and buy-sell futures, that are more commonly discussed.
“For what it’s worth, this is my favorite CI plot:”
The notes say that the CI was derived using option market data. Interesting!
If you read the end of my post, I mention it as well.
A lot of people don’t seem to realize that not only is there a prompt and strip for selling oil long/short, but that you can buy FIXED price options (puts and calls). IOW, if you want to sell or buy oil in DEC22 at$50 or $100 or the like, you can get a price for that option. From this, some math is applied and they extract the CI.
See e.g. https://www.barchart.com/futures/quotes/CLZ22/options/dec-22?moneyness=50
But it’s really based on a market view of volatility, as expressed in how dear/cheap fixed price options are. Very Bayesian. Not based on EIA own guess. Not based on time series (previous volatility). Just based on how market is pricing options at $70, $80, etc. If the market has high uncertainty, the funnel will be wide. If the market has low uncertainty, it will be narrow.
And pretty much, you’ll see the funnel widening with time (less certainty about the future). If you look at natural gas futures, you can notice as well the higher uncertainty in winter (can get spikes or crashes from weather).
But in general, most casual commenters (and even some who should know better) are unaware of how dramatic the level of uncertainty is. How wide the CI is. And this is a standard EIA report that comes out every month (their headline report, really). And the price funnel chart for oil is always their first figure on the web version of the report. And investing forum and peak oil commenters (some of whom have discussed oil for over a decade) are blissfully unaware of this.
“I actually think it’s deceptive to plot things in levels when one is interested in growth rates. ”
Have had this discussion before. I actually have some sympathy here with Kopits. Inflation is something we often think of in terms of % growth. But population, temperature, traffic, etc. are more intuitive if plotted linearly. Especially for the initial overview. I do buy the constant-dollar correction to prices or the like. But I wouldn’t plot revenue or the like on a log scale for a corporate client. They can more easily get insight from the graphic with a linear scale. And, while you have a few posters that are hard core economists, there are a lot of hoi polloi that aren’t any better than a typical business executive. I just think for initial examination of the phenomenon, linear view makes more sense.
If exponential behavior is important (e.g. oil well decline, Arps model), would show it on a second view, at least with an untrained audience. You get the wrong idea of how fast a shale well declines if you post it on a semi-log scale. Granted if you are dealing only with reservoir engineers, fine. But even then, it’s important to mention the semi-log scale…and use it when most appropriate (for wells that show exponential decline, not harmonic).
Ah, but Kopits didn’t suggest levels as an option which might convey information to a less sophisticated audience. He questioned ever using logs in the situation at hand. Logged data show very clearly whether and when growth rates vary. One could use % change instead, if the audience is not familiar with logs. This is an economics blog, so Menzie has every right to assume a certain amount of familiarity with the tools of economics. Kopits claims a degree in economics.
But again, this is not Menzie calling Kopits out for using the wrong tool. This is Menzie responding to Kopits insisting that Menzie chose the wrong tool. Further, it was Kopits saying Menzie used the wrong tool in pointing out an error Kopitz made in his claims about fiscal policy and trade. (The error was an error of fact, undeniable by anyone who looks at the data.)
This is Kopits compounding his error in an effort to claim he didn’t make an error. So while in general, we can discuss best methods of data presentation, that’s not the point of this debate.
“This is Kopits compounding his error in an effort to claim he didn’t make an error.”
Koptis and CoRev are a lot a like in this way.
‘duck:
I quoted MC, not SK. I’m (realio trulio) commenting on this specific statement, myself, since that’s of interest to me. Not their kerfuffle. 😉 That’s why I direct quoted and responded at that part of the discussion. Just fastening on the micro issue itself.
FWIW, I don’t see any eeful intention. Just a stylistic flaw. MC is used to doing this semilog stuff so much in fancy formal literature, that he tends to overdo it. IMO.
Consider a possible example, here:
https://static.seekingalpha.com/uploads/2013/8/21/91506-13771123377649117-Devon-Shire_origin.jpg
You’re actually kind of missing the point (the nonlinear decline, rapid drop, long tail) to be communicated, if you show that on a log bopd y-axis scale. And for lease-holders, midstream providers, investors, etc., it’s really the actual level that has meaning, not the log of it. (But of course, you have to consider multiple wells as you move further and further from a single pumpjack to the pad, field, etc. level).
It’s like temp versus resistivity for a semiconductor. For a casual audience, I would not show the log cond vs 1/T graph. They need to understand the non-linear dynamics. It’s actually an important piece of awareness for initial intuition into the dynamics. For a professional matsci audience, it’s good to show the semi-log behavior, since they will know the typical relation and will look for how straight a line you get. Conversely, of course, even for a professional audience, it does not make sense to show a metal’s temp vs resistivity on a semilog plot. Because in that sort of material, the stereotypical behavior is linear t vs r (with a small slope) and even professionals will get more out of seeing the normal plot (which is also easier, less mathy). For that matter, even for semiconductors there may be times you want to show the standard plot. For example if your issue of concern is cooling water requirements (where the actual heat load is the question of interest, not the activation energy of the material)
But like I said, I’ve already expressed this He’s heard it, he disagrees. I’m fine, I’m not adding anything, just repeating myself, won’t do so more…Internet discussions are so plagued by repetition. I just couldn’t help myself. Mea culpa maxima. https://imgs.xkcd.com/comics/duty_calls.png
When top to bottom the variance is something like 70%, you don’t need a log scale and it presents a distorted view of the situation. In general, log scales are to be avoided for all but professional audiences, notably when exponential growth rates are involved. I would almost never use one in a commercial setting or for a general audience, because they are so easy to misinterpret. I strongly prefer simple linear scales when possible. I have no problem with percentage changes, if that suits the issue. And I often use indices where some period is set to 100 and the other values are offset compared to that.
“In general, log scales are to be avoided for all but professional audiences, notably when exponential growth rates are involved. I would almost never use one in a commercial setting or for a general audience, because they are so easy to misinterpret.”
This is the first time I have ever seen someone calling the incredibly STUPID “professional”. What you are saying is demeaning to anyone who gets this issue. So I guess macroduck is right – you think of your clients as incredibly dumb suckers.
No private sector experience, eh?
Steven Kopits: Heath Tecna, Harvard University Kennedy School of Government Energy & Environmental Policy Center, Brookings Institution, National Bureau of Economic Research.
i was referring to pgl. So you want to interpret that -3795 number for me?
“Inflation is something we often think of in terms of % growth. But population, temperature, traffic, etc. are more intuitive if plotted linearly.”
Excuse me but inflation is already the rate of change of the price level. So hopefully this rate of change is not growing forever (as in hyperinflation). Temperature and traffic are not forever growing either. I would say the same thing for a single firm’s revenues or profits. So your point is ?????
I was probably sloppy in my wording. Inflation (percent itself) should be plotted on a linear scale. Prices make sense to plot on a semi-log scale, especially for a long time series.
Eric Adams becomes mayor of NYC in less than two weeks. His police commissioner will be a woman. He just announced his 5 deputy mayors – all women with ethnic diversity abounding. NYC has changed for the better since I moved here under the regime of Manhattan’s mayor Michael Bloomberg. I guess this is the Brooklyn way!
The Asset-Debt Macroeconomic System
Unlike wonkish articles on subjects that are require confidence intervals to attempt to characterize an economic area of interest, the summation of the global asset-debt macroeconomic system is well represented by the hourly, daily, weekly, monthly, and yearly exact zero sum gain data output which generates the system’s composite asset (and debt instrument) growth and decay valuation curves. Qualitaitvely, it is trivially accepted (and perhaps characterizable by confidence intervals) that the system’s valuations go up and down in a cyclical fashion. If, however, there was an underlying exact quantitative timing relationship between debt expansion, money creation, asset overproduction, and asset peak overvaluation and, thereafter, valuation decline of assets, the macroeconomic system would have the characteristics of a self-organizing system – exactly like that of the self assembly systems of sub-atomic particles, atoms and molecules; the self assembly of DNA copying, its two strand bonding and helical folding, the self assembly protein synthesis using mrna templates and ribosome, and the self assembly organization of gases, stars and planets within galaxies and beween the galaxies themselves. Those identified patterned laws and properties of self-organization eg two up quarks combining with one down quark, confer upon those named entries: quantum mechanics, chemistry, biochemistry, astro physics, et. al. the quality of reliable predictability and the term ‘ hard science’. It could be that the asset debt macroeconomic system can also be defined by a similar exact patterned behavior of its growth and decay valuation curves and is therefore, also, a hard science.
Omicron is spreading fast. I have ruled out going on an airline trip, going to a bar, going to a sports event, and even going out to eat for the next couple of months. Of course I have not done any of these things in almost two years so what is news.
My 91 old mom called me and she has the booster thankfully. But she is asking me if I intend to go for a haircut. She never like me teenage hippy hair style back in the day so maybe I should take that chance – wearing my mask as usual.
“come on, do you want to live forever……”
are you near the panera where the pooe soul w/o a vaxx id was arrested? for trying to live
be like rosser!
He was asked to leave multiple times after being rowdy. The reality is no one would have bothered him if he just got his food and left thee premises without bothering customers and everyone inside the restaurant. He behaved like a girl in her early teens who’s starving for attention from her father:
https://twitter.com/LeeroyPress/status/1472675919471034372
You Republicans no longer believe in the rights of private property owners?? You Republicans/”conservatives” weren’t singing that tune when it meant you could throw Black Americans out of a restaurant.
https://www.salon.com/2010/05/20/rand_paul_maddow_segregation_open2010/
Go over to Kevin Drum’s place and he seems to be offering an off ramp to the Manchin betrayal. Kevin argues that Manchin wanted to support BBB sine that Child Tax Credit and the White House said no.
Look I totally support the Child Tax Credit. But let’s think about the 2022 elections. Pass BBB with the Child Tax Credit and then run like hell against anyone who opposes this important policy including Manchin. In other words, give this traitor want he wants and then hang him the next time he wants the families of West Virginia to vote for someone who would throw them under the bus.
Pass BBB without the Child Tax Credit with Drum’s advice. Sorry for the typo. It is an interesting strategy if the progressives have the extreme patience to pull this off. Time to hang the Blue Dogs with their own ropes.
so…. you already reneged on all the presumption that said the bbb would not run up the mational debt!
Try reading what the CBO wrote which included the proposed new tax revenues. Now run away little troll.
relate the assumptions in the cbo you rely upon,
usually, i do not suffer gaslighters.
Menzie,
You have beaten this proverbial horse to death. At least you’re able to get an ego boost out of your fan club making digs at your enemy “Steven Kopits”. I’ve noticed that your blog posts rarely contain any genuine discussion within the comment section – does that deflate your perpetually bruised ego further? Or are you not concerned? I wonder, as a professor, are you one of those who just lectures? Minimal interaction? No concern for student interest? I just checked your page on ratemyprofessor and I’m thinking my pondering might have merit. At least you are keeping yourself entertained and providing a forum for people to attack those they disagree with and/or comment on areas completely unrelated to y the topic of your posts.
“I’ve noticed that your blog posts rarely contain any genuine discussion within the comment section”
Well this is certainly true when you act like a total jerk. Which is ALL you ever do. I presume you are quite proud of yourself.
That or comments like this: https://econbrowser.com/archives/2021/12/on-confidence-intervals-and-logs#comment-264333
Please put away the clown, PaGLiacci.
I am most certainly not Menzie’s enemy. Absolutely, categorically not. We may disagree about ideologies and methodologies, but these are technical discussions in no way reflecting any personal animosity from my side. I appreciate the work Menzie does on a daily basis to explore certain topics, mostly in economics. To learn and teach, that is why I am here.
Just published:
https://www.ons.gov.uk/peoplepopulationandcommunity/birthsdeathsandmarriages/deaths/bulletins/deathsinvolvingcovid19byvaccinationstatusengland/deathsoccurringbetween1januaryand31october2021
December 20, 2021
Deaths involving COVID-19 by vaccination status, England: deaths occurring between 1 January and 31 October 2021
Age-standardised and age-specific mortality rates for deaths involving COVID-19 by vaccination status; deaths occurring between 1 January and 31 October 2021 in England.
1. Main points
The monthly age-standardised mortality rates (ASMRs) for deaths involving COVID-19 have been consistently lower for people who had received a second dose at least 21 days ago, compared with unvaccinated people. This is the case for all age groups.
The age-adjusted risk of deaths involving COVID-19 for people who had received a second dose at least 21 days ago compared with unvaccinated individuals varied from 99% lower (in February) to 78% lower (in October); this could be caused by various factors, such as changes in the composition of the group, changes in background COVID-19 infection rates, changing levels of immunity from prior infection, changing dominant variants, seasonal changes in mortality rates and vaccine waning….
Kevin Drum catches Trump telling Bill O’Reilly that his MAGA hat wearers and not liberals that should get credit for the vaccines:
https://jabberwocking.com/trump-dont-let-liberals-take-credit-for-the-vaccines/
Watch this one minute clip as Trump claims the Spanish flu killed hundreds of millions of people. Where get he get that statistic. I thought that most estimates were between 25 and 50 million people. Oh wait maybe the confidence interval should be put at 17 to 100 million people. But hundreds of millions of people? Maybe Princeton Steve and CoRev will author a paper confirming Trump’s claim!
Anon –
IID is something you target ex-ante, but confirm ex-post.
Have you actually ever designed or executed surveys? Do you have any idea how tricky estimating mortality from household surveys in post-hurricane Puerto Rico could be? Pretty darn tricky.
Consider the numbers:
During a typical stretch from late September to end of December — equivalent to the period from Hurricane Maria to year end — Puerto Rico would expect to record about 8,000 deaths on 1.2 million households, that is, 0.67% of households would see a death over that period. If we take 1400 as the plausible number for excess deaths, and I think that’s where most the studies come out, then that’s an addition 0.12% of households would report a death in that time frame. The Harvard study conducted 3,299 household surveys. Thus, in a normal year, we would have expected 22 of these 3,299 households to report a death in the relevant stretch, and an additional 4 of these households would report a death to reach the excess 1400 death level. To reach the 4,645 excess deaths of the Harvard study, only an additional 9 or 3,299 households would have to report a death for the period. Nine bad surveys. That’s all it takes.
That means just the smallest systematic bias on the selection of geography or subsegments, just the smallest distortion from survey respondents, just the smallest tilt from surveyors and you can be off by a lot for the purposes of this survey.
The problem is that you do not know whether you have those problems ex-ante. Is your geographic coverage good enough? What happens if deaths were concentrated in a ten square block area and you neglected to survey it? What if your surveyors heard that this was a hot spot for deaths and one of them decided to go down there to survey it? What if the people you tried to survey and weren’t home weren’t an iid sample? What if just 1% of respondents thought they would be eligible for compensation if they said someone in the family had died? What you’re not allowed into gated communities to survey the residents? Did you survey houses with guard dogs?
There are all sorts of traps in this kind of survey. And we know that, because the Harvard estimate was 3x too high. They blew it by a country mile, well, three country miles. What you absolutely cannot do is start from an iid assumption. You can target for an iid sample. But you really start from the assumption that you’re going screw up, maybe materially, maybe in multiple ways — in ways you can’t necessarily anticipate. You have to assume that you don’t know whether you’re really iid or not. Of course, you can try to compensate with sampling technique, and sometimes that works. But until you have a proven method that you’ve cross-checked against real data, and done that a number times, you do not know whether either your methodology or data are any good. The Harvard methodology was inadequate, and yet they did not take the trouble to cross check it against actual mortality data, which would have told them that their survey methodology was materially wrong and misleading as they chose to present it.
AS, thanks for the link to the new release. I was surprised to find the basic raw cumulative numbers for vaccinated/unvaccinated deaths from Jan1/21 thru Oct 31/21 were 35578 vs 17708 or about 2 to 1 for the unvaccinated, Table 8. Since 2021 was our first year of Covid vaccine use, I would have expected the ratio to be much higher.
Table 3 also has some interesting numbers showing decreasing deaths (A good thing?) for the unvaccinated: Number of deaths Jan thru Oct/21:
52,353
19,991
7,835
4,044
2,755
2,201
2,149
2,168
1,958
1,809
Also Table 1 shows that the number of (ever) vaccinated deaths for Oct was 2,256 versus 393 for unvaccinated.
Perhaps the decreasing Table 3 numbers is a demonstration of success of the vaccination process, and the Table 1 ratio is an example of the imperfection of these vaccines for those of us in the age, weight and medical comorbidity cohorts. Which has been my point now for weeks.
None of escape death, and the likelihood increases with age. 😉 Some here appear threatened by that truism.
https://news.cgtn.com/news/2021-12-21/Chinese-mainland-records-81-confirmed-COVID-19-cases-16al5DmMVCE/index.html
December 21, 2021
Chinese mainland reports 81 new COVID-19 cases
The Chinese mainland recorded 81 confirmed COVID-19 cases on Monday, with 57 linked to local transmissions and 24 from overseas, data from the National Health Commission showed on Tuesday.
A total of 19 new asymptomatic cases were also recorded, and 505 asymptomatic patients remain under medical observation.
Confirmed cases on the Chinese mainland now total 100,467, with the death toll remaining unchanged at 4,636 since January.
Chinese mainland new locally transmitted cases
https://news.cgtn.com/news/2021-12-21/Chinese-mainland-records-81-confirmed-COVID-19-cases-16al5DmMVCE/img/cc40ae703e224f96909512da4beb811c/cc40ae703e224f96909512da4beb811c.jpeg
Chinese mainland new imported cases
https://news.cgtn.com/news/2021-12-21/Chinese-mainland-records-81-confirmed-COVID-19-cases-16al5DmMVCE/img/27ab50019f31466e8f30cbb93bd2340e/27ab50019f31466e8f30cbb93bd2340e.jpeg
Chinese mainland new asymptomatic cases
https://news.cgtn.com/news/2021-12-21/Chinese-mainland-records-81-confirmed-COVID-19-cases-16al5DmMVCE/img/38dcebea73044300b9b693cf66b33b4f/38dcebea73044300b9b693cf66b33b4f.jpeg
http://www.news.cn/english/2021-12/21/c_1310385825.htm
December 21, 2021
Over 2.69 bln COVID-19 vaccine doses administered on Chinese mainland
BEIJING — More than 2.69 billion COVID-19 vaccine doses had been administered on the Chinese mainland as of Monday, data from the National Health Commission showed Tuesday.
[ Chinese coronavirus vaccine yearly production capacity is more than 7 billion doses. Along with over 2.69 billion doses of Chinese vaccines administered domestically, more than 1.85 billion doses have already been distributed to more than 120 countries internationally. Nineteen countries are now producing Chinese vaccines from delivered raw materials. ]
https://www.worldometers.info/coronavirus/
December 20, 2021
Coronavirus
United States
Cases ( 52,059,667)
Deaths ( 828,836)
Deaths per million ( 2,483)
China
Cases ( 100,386)
Deaths ( 4,636)
Deaths per million ( 3)
Oracle pays $28 billion to acquire the electronic medical records firm Cerner:
https://www.computing.co.uk/news/4042345/oracle-acquire-cerner-biggest-acquisition
Is Oracle paying too much for Cerner? Cerner’s stock was trading at less than $75 a share before news of this merger which would give Cerner shareholders $95 a share. I guess one could argue synergy benefits but it seems this merger news has been dragging down the share price of Oracle:
https://www.barrons.com/articles/oracle-stock-extends-slide-as-cerner-deal-spurs-worries-51640101817?siteid=yhoof2&yptr=yahoo
Speaking of logged data, here’s a case where logs would be handy, but FRED doesn’t seem to offer that option:
https://fred.stlouisfed.org/graph/?g=K6CK
Margin debt has risen very rapidly over the past year and some. Margin debt is hardly the only source of leverage in the equity market, but it is easiest to track and arguably represents overall trends in securities lending. What goes up…
Macroduck: Go to “edit graph”, go down to “units” (near bottom), and choose “natural log”
Many, many thanks.
https://fred.stlouisfed.org/graph/?g=K6OB
Macroduck,
If I have done the VAR correctly, it looks like Wilshire 5000 Granger causes margin debt. I was inclined to think that margin debt would Granger cause market movement.
Oops,
When manually entering EOQ data from Excel into EViews, I got the quarters off by one quarter.
Now appears that Margin Granger causes Wilshire.
Apologies.
http://www.news.cn/english/2021-12/21/c_1310386188.htm
December 21, 2021
Chinese women’s average life expectancy exceeds 80 years in 2020
BEIJING — The average life expectancy of Chinese women reached 80.88 years in 2020, up from 77.37 years in 2010, according to the National Bureau of Statistics (NBS) on Tuesday.
Chinese women’s social status has been raised significantly over the past decade, and their sense of accomplishment, happiness and security has increased dramatically, said an NBS report on the monitoring results of the Outline for the Development of Chinese Women (2011-2020).
The gender gap in compulsory education has been eliminated, with the net enrollment rate of primary school-aged girls remaining above 99.9 percent for six consecutive years since 2015, the same as that among boys.
With the improvement of policies for employment and starting businesses over the past decade, employment channels for women have been expanded, and the number of women in the workforce has seen a steady increase.
There were 67.79 million female employees in urban work units last year, up 39.5 percent from 2010. Women currently account for 43.5 percent of China’s total employment, according to the report….
Macroduck: “Margin debt has risen very rapidly over the past year and some. Margin debt is hardly the only source of leverage in the equity market, but it is easiest to track and arguably represents overall trends in securities lending.”
It is often said that stock market asset inflation is an undesired side effect of low interest policy. The Fed could easily mitigate this by changing the margin requirements in the Fed’s Regulation T. Currently the initial margin requirement is 50% and the maintenance requirement is only 30%. There is no excuse for the Fed allowing this increasing leverage risk.
The Fed acts as if asset inflation is something they simply must tolerate as a result of low interest policy and can do nothing about. This gives some credence to complaints that the Fed’s low interest policies are designed to punish small savers and benefit the rich. It’s bad public relations.
Just published, meticulous and completely clear:
https://www.ons.gov.uk/peoplepopulationandcommunity/birthsdeathsandmarriages/deaths/bulletins/deathsinvolvingcovid19byvaccinationstatusengland/deathsoccurringbetween1januaryand31october2021
December 20, 2021
Deaths involving COVID-19 by vaccination status, England: deaths occurring between 1 January and 31 October 2021
Age-standardised and age-specific mortality rates for deaths involving COVID-19 by vaccination status; deaths occurring between 1 January and 31 October 2021 in England.
Over the whole period (1 January to 31 October 2021), the age-adjusted risk of deaths involving COVID-19 was 96% lower in people who had received a second dose at least 21 days ago compared with unvaccinated people….
A reader has been commenting on energy (oil and coal production and conversion) technology:
http://www.news.cn/english/2021-12/21/c_1310386420.htm
December 21, 2021
Coal-to-liquid plant in China’s Ningxia reaches full capacity
YINCHUAN — A project converting coal into oil in northwest China’s Ningxia Hui Autonomous Region had produced 4.05 million tonnes of products this year as of 9:17 a.m. Sunday, according to the developer on Tuesday.
It marked the first time that the plant had reached its designed annual output capacity of 4 million tonnes since it went fully operational in 2017, said Ningxia Coal Industry Group Co., Ltd under the state-owned China Energy.
With a total investment of 55 billion yuan (about 8.6 billion U.S. dollars), the project started construction in September 2013 and its localization rate has reached 98.5 percent.
According to the company, it has launched 559 key technological innovations in recent years and invested 7 billion yuan in environmental protection to effectively solve the problems such as sewage treatment and solid waste discharge….