Teaching Public Affairs 200 “Contemporary public policy issues” this semester, we had the good fortune to have a guest lecture by Greg Nemet (my colleague at La Follette, and a lead author on IWG3 Report of the IPCC Assessment Round 6) on Wednesday. He covered an enormous amount of material in one short lecture, here:
The lecture noted the lack of uncertainty regarding whether global temperatures were rising, the human-activity contribution, and bad news regarding the fact that previous forecasts were underpredicting actual, and the good news regarding developments in climate change mitigation, particularly in costs of alternative energy production.
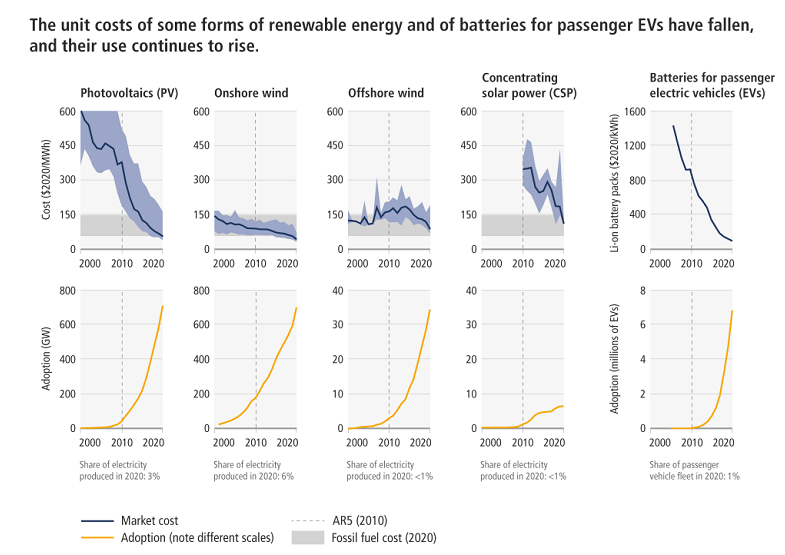
Source: IPCC AR6 IWG3.
Entire presentation here (PDF). (You’ll have to enroll in the class at UW to see the video presentation!).
Greg is also author of How Solar Became Cheap (discussed in this post). Article on climate change/mitigation in Wisconsin State Journal.
https://www.ncdc.noaa.gov/cag/national/time-series
April 17, 2022
Climate at a Glance, 1895-2022
Temperature and Precipitation
Global
National
Regional
Statewide
Divisional
County
City
[ Useful arrays of data. ]
These are great, thank you.
A big issue with temp measurements has been the locations and conditions surrounding the stations. The US has addressed this by establishing the USCRN set of automated stations. In operation since 2005 its US records show this: https://www.ncdc.noaa.gov/cag/national/time-series/110/tavg/1/3/2005-2022?base_prd=true&begbaseyear=2005&endbaseyear=2022 Accordingly these stations were established to reduce or eliminate the need for data adjustments common with the older or less well established data/sites.
The temp peaks in the above graph are closely correlated with ENSO/el Ninos: https://ggweather.com/enso/oni1990.png There is no known human cause for ENSO. NOAA defines it this way: “El Niño is a naturally occurring climate pattern associated with warming of the ocean surface temperatures in the central and eastern tropical Pacific Ocean, which can significantly influence weather patterns, ocean conditions, and marine fisheries worldwide…” https://www.noaa.gov/understanding-el-nino
Using the USCRN data US temperatures are clearly affected by ENSO. Remember the claims for a new record average high temperature usually follows am el Nino occurrence.
CpRev,
Oh gag. Now that we just had Bruce Hall in here making a fool of himself over this issue you have to jump in and do so as well, eh>
OK, you admit that the urban heat issue is being dealt with, no effort to try and suggest that is still gumming things up. But, ah ha! You bring up another silly old bugbear, El Nino!
Yes, it is true that peaks tend to follow El Nino occurrences. But peaks are not the issue, silly boy. It is the long tern average trend, which is going up. That is not explained by El Nino. So sorry, you are just wasting peoples’s time here, as you pretty much do every time you post anything here.
Another gullible response: “Yes, it is true that peaks tend to follow El Nino occurrences. But peaks are not the issue, silly boy. It is the long tern average trend, which is going up.” Peaks (and valleys) are exactly the issue in a world of averaged data. As first figure in the article shows, comparing peaks to averages (where both peaks and valleys) are removed is another form of misinformation. It takes a special kind of bias for a trained mathematician to accept such a prediction with any validity.
Putting the first figure into economic terms: The March 2022 US CPI of 8.5 is higher than the historical decadal averages, and economic models provided by the Russian and Chinese schools of conservative economics show that the March 2100 CPI will be 43.25. Prove the models wrong.
Incidentally the driver of this abnormal 2100 CPI growth is the expansive use and mandated investment in PV, wind and other intermittent renewable energy production. As the article’s 2nd figure shows the true cost of these energy sources is the sum of the costs along with the underlying base-load backup source(s) costs (including storage) to assure energy reliability of before the inclusion of the intermittent renewables.
Before their inclusion into the energy mix most outages were primarily due to power grid failures and relatively limited. Since we have seen statewide size failure and/or brownouts, as in California and Texas die to generation intermittency and failure. All the while the users of these hybrid energy systems have seen higher prices than their stable non-hybrid neighbors.
The steady decline in the price of renewables production stands in sharp contrast to the volatility of hydrocarbon prices. A secure energy future requires a continued shift toward renewables, and not, of course, just because of greater price stability.
Here in comments, we’ve seen claims that battery-powered cars don’t perform as well as petroleum-powered vehicles. That claim is untrue in all but one regard – fuel storage. Even in the absence of further battery improvement, the story associated with the “performance” obfuscation is that consumers won’t accept behavioral changes required by current battery technology. Says who? Consumers change behavior all the time.
Implying problems with “performance” in any regard but fuel storage is a bit of a joke, as it amounts to a sly suggestion that EVs cannot violate the law by a sufficient margin.
There is a resource problem, though, one which has been discussed here on occasion. The metals required for batteries are in short supply, relative to expected future demand. Investment capital and improved extraction practices are both needed, and we have yet to work out how both can happen without government assurances. Efforts in that direction are underway, but belatedly:
https://www.whitehouse.gov/briefing-room/presidential-actions/2022/03/31/memorandum-on-presidential-determination-pursuant-to-section-303-of-the-defense-production-act-of-1950-as-amended/
Taking steps to assure sustainability requires government which takes the national interest seriously. We didn’t have serious government under the other guy.
“volatility of hydrocarbon prices”
That’s a very good point. In and of itself that’s a bad thing in a source of global energy. And that’s putting aside geopolitics (would be volatile without it).
https://english.news.cn/20220422/8d91e268636e453d9446d75311f73861/c.html
April 22, 2022
Wondrous Xinjiang: Dying desert poplar forest brought back to life
URUMQI — Imagine a stretch of forest by a river, with a dense covering of leaves, the sound of trickling water and wild birds fluttering around — in a desert.
Such a scene may seem unreal, but it certainly exists. For it describes a flourishing poplar forest along the banks of the Tarim River in northwest China’s Xinjiang Uygur Autonomous Region, on the northern edge of the Taklimakan Desert.
These days, it is thriving, a haven for wildlife amidst a rugged desert environment. However, until around 20 years ago, this landscape was more closely associated with death than life.
FOREST LIFELINES
Populus euphratica (more commonly known as “desert poplar”) is a rugged species of tree, dubbed “guardian of the desert.” It is resistant to low temperatures, drought and saline-alkali soil, and serves as an ideal windbreak and sand-fixation plant.
The 17-million-mu (about 1.13 million hectares) populus euphratica forest, the largest natural forest of the species, has been nurtured by the Tarim River, China’s longest inland river, for centuries.
However, starting in the 1950s, ecological conditions deteriorated due to the overexploitation of water resources along the Tarim River, causing the river to dry up as water levels dropped. Swathes of populus euphratica trees died as a result.
In the hope of saving the forest, in 2001, Xinjiang started to channel water from upstream sections of the Tarim River to the forest in its lower reaches during the high-water season.
In 2019, a restoration project was initiated to enhance the forest’s capacity for self-repair through building flood diversion facilities to irrigate the degraded populus euphratica trees. With an investment of 124 million yuan (about 19.3 million U.S. dollars), the project detailed ways to make full use of the channeled water.
Among the key figures in this work is Ilham Burhan, head of a ranger station in Yuli County. Digging ditches has become a normal part of daily life for him, working alongside his fellow rangers.
According to Ilham Burhan, these ditches are used to connect the separate water bodies, thus expanding the volume for water reservoirs and sending more water into the inner parts of the forest.
He has also built a diversion canal that stretches over 10 kilometers from the Tarim River, allowing water to flow along its ancient course, which had dried up for ages.
The joint efforts of the rangers and local government have borne fruit. To date, over 6.8 million mu of poplar forest has been saved from degradation, according to the regional forestry and grassland authorities.
Over the past three years, the average height of populus euphratica trees in areas with irrigation channels increased by 0.4 to 0.7 meters, with the number of seedlings increasing by some 14.3 million, official data shows.
NO-MAN’S-LAND
Forest rangers have been protecting the ecological environment along the river for more than two decades now….
You might find it interesting to read the Biden Administration’s approach to making everything about climate change. It’s fascinating reading with a bottle of brandy or bourbon or scotch… maybe two.
https://www.federalregister.gov/documents/2022/04/20/2022-08288/national-environmental-policy-act-implementing-regulations-revisions
Another part is forthcoming.
But don’t worry, Gina McCarthy is making sure that no progress will be made on anything deemed contributing to climate change:
On Wednesday’s broadcast of MSNBC’s “Hallie Jackson Reports,” White House National Climate Adviser Gina McCarthy declared, “President Biden remains absolutely committed to not moving forward with additional drilling on public lands.” And said that the Biden administration “had no choice” to put out new drilling leases, “but they also found ways to reduce the size of that and its impact.” She also said that “we are making an irreversible change towards clean energy that no court is going to block because we’re doing it in a legally solid way.”
McCarthy said, “President Biden remains absolutely committed to not moving forward with additional drilling on public lands. The challenge that we faced was that we had a court that ordered a new lease to be done. The Department of Energy had no choice but to put it out, but they also found ways to reduce the size of that and its impact. And we’ll keep doing what we need to do to appeal those decisions and to make our case in a court. Because we know that there are laws that were written decades ago that challenge our understanding now of what the key issues are moving forward, and climate is certainly one of them. And President Biden has already made historic progress on, not just putting us back in a leadership position internationally, but on the domestic front, we are making an irreversible change towards clean energy that no court is going to block because we’re doing it in a legally solid way. But we’re also doing it in a way that the public will understand it’s to their benefit. It is creating jobs for them. It’s creating opportunities to save money for our families.”
Just like those Keystone pipeline jobs magically transformed into solar panel jobs, eh? If you think the cost of energy is a problem now, just wait until Old Uncle Joe gets done with his agenda.
Of course, there are exceptions to every rule. https://c4.legalinsurrection.com/wp-content/uploads/2022/04/01-Em-Reserv-LI-1080a.jpg
Hyuk hyuk?
Bruce Hall If you think the cost of energy is a problem now
Cost to whom? No doubt that transitioning to a lower carbon economy would represent a higher cost to you. But here’s a news flash: You are neither the only person in the world nor the only generation. What’s good for you (cheap carbon energy) is very bad for those who’ll have to live with the consequences of your actions long after the worms have finished dining on your carcass. Or maybe you don’t believe in such a thing as intergenerational equity.
Bruce is your standard MAGA hat wearer. It is all about ME, ME, ME!!!
Oooo, quaking in your basement corner, eh? Look at what is happening regarding fossil fuels in Asia and then refocus.
• https://www.statista.com/statistics/265510/countries-with-the-largest-coal-consumption/
• https://www.statista.com/statistics/263455/primary-energy-consumption-of-selected-countries/
The US has seen dramatic declines in the use of coal and increases in intermittent energy produced by wind and solar arrays. The problem with wind and solar is the inability to store sufficient energy produced by those intermittent sources which then requires a fallback to coal and natural gas, especially as nuclear power in being taken offline despite frantic efforts by the Biden Administration to reverse that foolish policy.
Your presumption that a warmer earth is a more hostile earth is not supported by observations and, in fact, the opposite is true. Menzie’s chart is pure conjecture. Earth’s average temperature lies somewhere between Orlando, FL and Detroit, MI, both of which climates are handled well by humans and which are not apocalyptic. The constant flood of doomsday stories sells advertising, but when fully examined is fluff. We have been on the precipice of climate disaster for 50 years according to “researchers”. Meh.
You do write a lot of bald faced lies. Look troll – repeating your lies over and over will not make them true.
Wait – you are impressed that China consumes more energy than the US. Of course its population is FOUR times our population. So a little arithmetic challenge for our favorite Village Idiot. Redo this graph in per capita terms. We will wait as we know the calculations will take you all next week.
Your point is irrelevant. Much like Hall’s. Deflection.
Gregory Bott: Please respond to https://econbrowser.com/archives/2022/04/fantasies-of-the-past.
Bruce Hall The problem with wind and solar is the inability to store sufficient energy
It’s becoming ever less of a problem as technology improves.
Earth’s average temperature lies somewhere between Orlando, FL and Detroit, MI, both of which climates are handled well by humans and which are not apocalyptic.
Wow. You really don’t understand climate science at all. According to one study (http://cup.columbia.edu/book/economic-risks-of-climate-change/9780231174565) atmospheric concentrations of CO2 that climb to 542 ppm by 2050 and 996ppm by 2100 (all within the lifetimes of people living today), will result in average summer temperatures for Florida more than 10 degrees (Fahrenheit) warmer than today’s average annual temperature for Saudi Arabia and India. Texas will be even hotter. Michigan’s summer temperatures will be comparable to Spain’s, which is to say, pretty warm. You’re a conservative, which means you have difficulty understanding dynamic processes. Almost by definition conservatives cannot think in terms of change. But the climate will change. The arctic will get much warmer. The oceans will no longer support large schools of fish. Coral reefs, already dying, will disappear. Hundreds of millions of people who live along coastlines will be underwater. Do you think people in Bangladesh and the Maldives and Indonesia are just going to lie down and die because Bruce Hall doesn’t want to be inconvenienced? There’s a reason why the Pentagon is more concerned about climate change as a long run threat to global security than Putin in Ukraine. There will be wars and your grandchildren will not be able to escape the consequences.
We have been on the precipice of climate disaster for 50 years according to “researchers”
Your memory is pretty bad. Fify years ago scientists were saying that the sooner we took action the less painful and less costly the actions needed to avert disaster. Well, we didn’t take action and costs have gone up. And they will continue to go up. But you don’t care because it will be another generation that gets left holding the bag.
interesting!
what is the quality of life in your low carbon economy?
who is your system engineer?
so far none apparent!
“what is the quality of life in your low carbon economy?”
maybe it is more pertinent that you answer the question, what is the quality of life in a high carbon economy? it will be pretty dismal throughout the world.
“You might find it interesting to read the Biden Administration’s approach to making everything about climate change. It’s fascinating reading with a bottle of brandy or bourbon or scotch… maybe two.”
So many misrepresentations so little time. Glad to see you think having poison in everything is a mere joke. Enjoy your dirty bourbon troll since we know you did not read that actual analysis of oil lease revenues. Cliff Notes version for ya – everything you wrote on this topic was a lie.
I think what might call for accompanying reading the repeat with consumption of serious alcohol is that it is kind of boring reading given how laced it is with all these acronyms such as NEPA and NRPM and so on. Of course these actually represent real policy efforts, whatever one thinks of them, but the reading is pretty eyes glazing over.
Ironically given Bruce Hall’s unhappiness about efforts to block further oil drilling on public lands is that in the current Ukraine war crisis it looks that Biden has been relaxing these efforts at least temporarily, with many commenting that climate policy is taking a hit at least temporarily because of the wae. This is the sort of thing that ought to make Bruce happy, but he does not even recognize it is going on.
You have to remember – Bruce Hall’s comments are emailed to him by Kelly Anne Conway who is still serving Donald Trump. Trump has been known to flip flop on issues whenever his fragile little ego gets bruised. And of course Bruce Hall is incapable of telling his masters that he cannot say the bozo things he writes.
Lucy, now I know you didn’t read the Federal Register publication. What a twit.
No comment about what Gina McCarthy crowed about?
Little Brucie hoping some dude name Lucy goes out with him. ” Now what in this publication has you misrepresented now. After all you lie about every link you provide so why stop now.
“No comment about what Gina McCarthy crowed about?”
John Kerry ably addressed this issue. He distinguished between addressing short-term concerns v. the long-run goals. Yea I know – concepts your little MAGA hat wearing head will never get. After all – you are still trying to understand how to tie your little shoe laces.
As I’ve mentioned before, I think it’s really important for good-faith skeptics to point out exactly why they think assessments like the one above from an IPCC author are inferior to claims by scientist who put out starkly contrasting views, especially when those views are in the tiny minority.
If you’ve got some science that backs up your claims, great. But why does that science trump IPCC scientists’ claims? How do you decide between two opposing views?
As a non-scientist, I see no reason to doubt the IPCC.
AG,
Speaking of non-scientists, our self-styled lay expert here, Bruce Hall, likes to brag about his connections with a couple of TV meteorologists, one of them lacking even a bachelor’s degree, in terms of discussing climate issues. When one notes that these guys seem not to be all that expert, he whines about “credentialism.”
“Bruce Hall, likes to brag about his connections with a couple of TV meteorologists”
Is one a guy named Lucy? Brucie may be dating him.
AG asks: ” As I’ve mentioned before, I think it’s really important for good-faith skeptics to point out exactly why they think assessments like the one above from an IPCC author are inferior to claims by scientist who put out starkly contrasting views.” The problem with the author’s/article’s temp graph is that it compares apples to oranges, an average temperature peak against a point peak. Averages remove the point peaks and valleys, so comparing them is useless. Here is another graph comparing averages: https://holoceneclimate.com/image/holocene-co2-temperature.jpg
CoRev returns! I guess you realized that Bruce Hall was making a mockery out of himself so THE PREMIER climate change denier needs to take over for him.
Hold my beer.
Your chart is for Greenland. Last time I checked Greenland was not the globe. What a moron.
2slugs, and yet you would ignore the point, comparing peak/valley data for a averaged data is always invalid. Compounding that invalidity is comparing the final end point peak to an estimate. Believing such examples then ignoring the example is confirmation bias at its worst.
CoRev No, you’re missing the point. Your Greenland chart is irrelevant because the discussion is about global warming. And we’re not talking about temperatures in a wildly different context. We’re talking about temperatures in the age of civilizations.
2slugs, your commenting is more and more irrelevant. The point was the misinformation in the presentation of the article’s first figure. The Greenland chart was an example of how to present averaged data without misinformation.
Do you understand that some of the Holocene peaks have given names associated with the various civilizations’ advances, Minoan Warm Period. “5000 – 3000 BC Also we have the period covered by the graph I provided: “Climatic optimum Warm conditions; temperatures were perhaps 1 to 2 degrees Celsius warmer than they are today. Great ancient civilizations began and flourished. ” http://www.atmo.arizona.edu/students/courselinks/fall12/atmo336/lectures/sec5/holocene.html
Just a reminder of how I described the graph: “Here is another graph comparing averages: https://holoceneclimate.com/image/holocene-co2-temperature.jpg ” In your own words: “What a moron.”
As mentioned, that’s Greenland.
Also: “The problem with the author’s/article’s temp graph is that it compares apples to oranges, an average temperature peak against a point peak. Averages remove the point peaks and valleys, so comparing them is useless”
What are you talking about? All “peaks” are some sort of average.
Andrew do you know how to calculate an average? The 1st figure of the article look like it has the long term data averaged within a time frame of 500 to 1,000 years time frames. The end point peak time frame is less than a century, which is less than the 500 to 1,000 years used in the early data set.
I asked: do you know how to calculate an average?, because if you know how, you realize that all the peaks and valleys associated within the time frames are removed and replaced with the single average for each time frame. Therefore comparing a peak for for a period shorter than the averaging time frame is comparing apples to oranges and invalid.
I showed the Greenland graph as an example of one of the more acceptable graphing techniques when using time series data ending with an incomplete data-set/truncated time frame. The technique is to drop the incomplete data to forestall questions on how best to handle the incomplete data. Completing the time frame with padded data is also used, but often generates questions over the validy/quality of the padded data.
This graph did neither. It just appended collected (yes averaged) data and then appended more data from models. The graph still appears to not have a complete ending time frame and the end is graphed using a different averaging time frame. This is a deceptive graphing technique.
“Andrew do you know how to calculate an average?”
It sure sounded like you didn’t, because you made it sound like you didn’t realize “peaks” are averages too.
Comparing averages that are averages over somewhat different periods may be invalid, or may not be. You need to make an argument why or why not.
AG, this: “Comparing averages that are averages over somewhat different periods may be invalid, or may not be. You need to make an argument why or why not.” shows your ignorance. What you ignored or were ignorant of is that the two averages were of different time frames and of different data. Anyone making definitive statements comparing them is lying.
They’re averages, which removes the peaks and valleys. Graphing incomplete data is often done by dropping the incomplete end period, or padding the period’s data to complete the ending period’s average calculation.
The IPCC is irrelevant. Nobody cares about them and after they helped cover up real ecological damage for decades.
Gregory Bott: Please respond to https://econbrowser.com/archives/2022/04/fantasies-of-the-past.
A collection of the world’s leading climate scientists is “irrelevant”?
Just a few problems not addressed:
China and India will massively increase carbon emissions over the next 10-20 years. This alone will negate all of the green energy transitions in Europe and North America by a huge margin. There are ZERO realistic plans confronting this reality.
We do not have the technology to store intermittent wind and solar energy at scale and will not likely have this ability for decades.
Environmentalists are blocking high voltage transmission lines, wind farms, and solar fields that are essential in moving from places of generation to consumption. They are doing the same with domestic mining of Lithium, Cobalt, Copper and other materials needed for the green transition. These scarce materials will get much scarcer as the international supply is sourced from just a few countries (with very unstable governments that have deplorable human rights and environmental records).
Natural gas is being blocked at multiple levels (see John Kerry’ comments from a few days ago) despite the fact that the transition from coal to gas has done more to reduce carbon emissions than all of the green energy investments combined over the last two decades. Getting India and China to transition from coal to natural gas for electricity generation would do more for global emissions than all of the solar and wind installed over the last three decades.
“China and India will massively increase carbon emissions over the next 10-20 years.”
This indeed is a problem. But the way Trump trashed out efforts – are we at all surprised?
Bob Jones (sorry you have had to deal with having the same name as a university run by religious fanatics with that name),
You do not mention nuclear power, but for both China and India this is in play as a serious player. Heck, it emits less CO2 than natural gas you tout. India has been experimenting with thorium reactors, which we should have gone to long ago. There is plenty of it, safer than uranium-based fission power, and one cannot make bombs from it, which is why US dumped it back in the 1950s.
Bob Jones You sound like you might have gotten a “college degree” from Bob Jones University.
It’s certainly true that there are lots of technological challenges standing in the way of greening the planet. That’s why it’s going to be an expensive undertaking. And it’s precisely because it will be costly and painful that people like Bruce Hall and CoRev would rather kick the can down the road and make it the next generation’s problem even though people like Bruce Hall and CoRev are probably some of the worst culprits when it comes to climate damage. It’s also true that India and some developing countries will increase their use of dirty carbon. But that’s an argument for us to do more, not less. If we decide that we don’t want to pay the cost because China and India don’t want to pay the cost, the end result will be a dead planet all around. You don’t get to choose whether or not you want to play in the green planet game.
Anyone who wants to get too down on India’s case about likely increases in GHG emissions in the near term from there needs to understand that they still do not have general rural electrification and what that means in terms of quality of life. Yeah, we would love it if they did it all greeny, but that is not so easy.
They aren’t blocking anything. Please try harder and understand the term “sunk cost”. It wasn’t until 2004 that “climate change” really became a thing. Before it was not a thing, there was little interest in moving away from fossil fuels. 200 years of investment. I don’t see solar or wind having enough ummph to replacing fossil fuels in the entirety. Which further reduces interest.
Gregory Bott: Please respond to https://econbrowser.com/archives/2022/04/fantasies-of-the-past.
GB,
“2004”? The Kyoto Accord was passed in 1997, which became international law, even though the US withdrew from it and did not participate in it. That accord, signed by the vast majority of nations in the world, did address trying to lower CO2 emissions globally in order to offset global warming, “climate change.”
Just how out of it are you?
Neither China nor India are run by idiots so they will get their energy as cheep as they can. As the data above show ,the green energy sources are now cheeper than fossil fuel.
We already have the technology for storage of energy and will be using it in large scale as soon as the economic advantages of PV and wind get a little better.
There is not a lot of need to transport energy from place of generation to place of consumption if you have your solar panels on the top of your roof and the heat pump pipes under your lawn. Energy systems based on small communities and individual homes are very resilient to weather related breakdowns and many people now have decided that its worth the extra cost to avoid black and brown outs.
The electrification of poor villages in the third world is actually a lot cheeper using solar than trying to build a whole new infrastructure with big power plants and high voltage transmission lines. The one thing poor people are very aware of is cost – so they will get power via solar. Which will give them a lot more reliable power than any of the malfunctioning systems currently delivering power to the third world cities.
Ivsn,
Unfortunately both China and India are still buidling coal fired power plants, but they are also pursuing other alternatives, including nuclear, solar, and wind, with costs varying a lot from location to location, and wind cheaper than solar in many places, although apparently Rick Stryker thinks wind is awful. They have both signed on to the Paris Accord and appear to be making some efforts to go along with it, China in particular having developed a lot of solar energy.
These are all good points.
When better energy storage tech comes online, the value proposition for renewables is going to be extremely hard to ignore — including among poor and rapidly developing countries.
I am not as pessimistic as yourself, though you do make good points. China has committed to going carbon-neutral (I think that’s what they meant) by the middle of the century. They can do it, especially as they’re a developing country still building out their infrastructure. And the storage technology is slowly coming online. Remember how fast the price of solar and wind came down in the past 20 years. Plus, storage tech is useful in a huge variety of applications.
So I’m definitely more optimistic than you are, Bob.
I thought it might be useful for students to see my notes on the climate science presentation to help them understand the material properly. So, over the next few comments I’ll make some observations on specific pages. Here’s my summary page notes.
Page 2
Climate Science: Key Points
The slide starts with a tautology that there is no uncertainty that the climate is changing. Yes, indeed. True today. True yesterday. True 1000 years ago. True 1 million years ago. True 1 million years from now.
“Positive feedbacks poorly understood.”
Wait, what? That’s a big problem since positive feedbacks are the processes in the models that produce the large temperature increases. I thought there was a lot of certainty about this? At least that’s what the tautology above was trying to suggest to me.
“+2 degrees C seen as threshold for widespread,catastrophic, irreversible damages.”
Where did 2 degrees come from? Climate scientists and policy people talk about a 2C threshold, but they never justify it and justification is not easy. Looked at from an economics viewpoint, the optimal temperature rise depends on the cost of reducing GHG emissions, the costs if they are not reduced, the timing of both, and the intertemporal tradeoff between utility of current and future consumption. All of this is highly uncertain. But unless you specify a model and quantify the uncertainty, 2C is just a number pulled out of –well decorum prevents me from completing the thought. It might turn out that the optimal temperature increase is 3C or 4C. How do we know? Where is the argument?
Moreover, is alarmist language such as “widespread, catastrophic, and irreversible” justified? If this language is justified, then I expect to see evidence later on of dramatic consequences from global warming, something like per capita income returning to the 19th or 18th century for example and staying there. Or widespread starvation. Or something really big and really bad and really permanent. Let’s see is we get this evidence in later pages.
I pity your students. BTW, the average global temperature is about 57 degrees Fahrenheit. During the Ice Age the average global temperature was about 46 degrees Fahrenheit. So what sounds like a small difference turns out to have dramatic effects. There is a small but not implausible chance that global warming could increase by 11 degrees Fahrenheit during the lifetimes of your grandchildren’s grandchildren. In other words, the future world could be as radically different from our current world as the Ice Age is from today. The only difference would be the direction of the temperature change. Either way, it’s literally a civilization ending outcome. Since CO2 persists in the atmosphere for centuries, today’s generation bears significant responsibility for such an outcome.
As to your GDP estimates, you’re revealing your American bias. A small drop in GDP might be tolerable for wealthy Americans, but if you live in Bangladesh or the Maldives climate change will essentially wipe out 100 percent of your GDP. And keep in mind that GDP represents GROSS domestic product. The relevant measure for human welfare is NET domestic product. Climate change will strand capital and increase a correctly estimated depreciation. But if a 2 percent drop in GDP is tolerable for future generations, why isn’t a 1.9% drop in GDP tolerable for the current generation?
2slugs,
I think you’ve raised an important point about the effects of climate change that is unappreciated. Climate change will affect developing countries much more than the developed and developing countries are much less able to tolerate economic losses than developed countries. But if boosting real GDP in developing countries is our goal, then climate change policy is an inefficient way to do it. It’s too expensive relative to the real GDP gains that might be saved. We should instead focus on much better development policies, encourage free markets, financial development, etc. We can get much bigger gains to welfare at much lower cost.
The general point I was making is that if we look estimates of welfare loss as a result of climate change, they’re pretty small. It’s certainly not a “catastrophe”, yet, strangely, people keep saying that it’s a catastrophe while at the same time publishing data that is self-refuting.
“But if boosting real GDP in developing countries is our goal, then climate change policy is an inefficient way to do it. ”
is that really what our goal should be? I know you may want to have profits increase rick. but what if that village in the developing country has less aspirations than quadrupling their gdp? what if they simply don’t want their community to exist underwater in the next 50 years? not everybody will have the same greedy metric in profitability that you have rick. some may actually be comfortable with their current existence.
Rick,
Excuse me. Did you mean to address readers here as “students” whom you are going to “present my slides” to so that we might “understand the material properly”? Are you kidding?
Or does this mean that you are actually a teacher of some sort, maybe even a professor, of something somewhere at some level that has you presenting what you are posting here to some sort of students of some sort. So you decided to do us this favor by presenting the slides you show to your students to us also? Oh goody.
Now I shall probably have Bruce Hall getting all over my case about my awful tendency to “credentialism,” and Econned might get on my case about my incessant name dropping, but in fact I do happen to personally know a bunch of the world’s leading climatologists, including some prominent as so-called “skeptics.” So I am going to ask what the eff your credentials are to be teaching anybody at any level about any of this? I realize that given you are here like so many under a phony name that you are terrified of not giving up (even thosgh it has some curious connections), we shall not probably get to learn precisely what those credentials are. I mean, like, do you have some google scholar citations about any of this?
Really, an adoring public wants to know, oh, excuse me, I mean we your “students” want to know.
Barkley,
I imagine that Greg Nemet will be disappointed to hear that you didn’t bother to read his climate science presentation that Menzie linked to above, since you thought I was posting my slides in my comments. What I was doing was posting my comments on specific pages in Greg’s slides that he gave in his guest lecture to Menzie’s Public Affairs 200 class. I mentioned “students” merely because these slides were designed to teach a class for students at U Wisconsin. Menzie posted the slides so that “students” in the broader sense, i.e., readers of his blog, might see them too. I’m a student in that sense as well.
Why don’t you go back and read Greg’s presentation? It’s a good, clear presentation although I obviously disagree with some of it. I think my comments will make more sense to you after that.
Rick,
Well, this does not help you very much. I did read Nemet’s piece, which looked generally pretty reasonable to me. You did not make it clear that was what you were referring to or who the students were when you posted your slides here. Are you aware of that lacuna on your part? At least I gather you are not claiming any credentials, which look to be sorely lacking.
Frankly your comments are so bad they are barely worth responding to, certainly not at any length. So I shall only pick at one of your more obviously tendentiously stupid and misleading points (why is it that you people who do not know your a** from a hole in the ground keep pontificating on this issue? It is becoming truly nauseating).
You note that on the one hand Nemet argues that it is pretty much certain that average global temperature is rising and also that it is pretty much near certain that it will do so by at least 2 deg C. But then you get all in a huff that he says we lack knowledge regarding the degree of positive feedback effects and think you have found a problem in his remarks.
No, you have not. You have only shown that you are an ignorant moron of the worst sort. Getting to that 2 deg C does not involve any assumptions that there are positive feedback effects. The lack of certtainty about them that is very real does not play a role in that forecast, which is based on aspects of the system that are well understood, and much is well understood and getting better undersrtood all the time, at least by people willing to take science seriously and not play stupid games cherry picking statements in misleading ways to score stupid ideological points.
The problem raised by the positive feedback effects, which are known to exist but whose degree and effect is not well known, has to do with how much beyond that 2 deg C increase we might go. That they exist was a crucial part of the argument by the late Marty Weitzman regarding the matter of possible (likely, he argued) fat tail effects because the distribution of future temperature outcomes possibly being Pareto rather than normal or even lognormal. This possibility substantially raises the possibility of indeed catastrophic outcomes such as a 12 deg C increase over the next century to as high as maybe even one percent, still low, but not the negligible one in ten billion that a less skewed distribution would generate, an outcome that can indeed just be ignored.
Actually, this sort of thing is exactly the sort of thing that I have long studied, having begun doing so with climatologists at UW-Madison a half century ago, and regarding which I have published, with actual google scholar citations to boot. I always find it amusing when poorly credentialed “skeptics” tout “complexity” of the global climate-economic system as a reason to doubt IPCC projections and an excuse to do nothing. In fact as a one of the leading students of complexity economics around (me), the complexity of the system associated with the nonlinear positive feedbacks that are in the system, and which Nemet accurately noted are not well understood, are a reason to do more about the situation given some of the truly scary possible outcomes out there, than to do less as people like Bruce Hall and CoRev and I guess you also would have us (not) do.
BTW, i am relieved to learn that indeed you are not actually “teaching” any actual students anything.
Barkley,
You are very confused, as usual. The point about uncertainty of positive feedbacks is unrelated to the point about the 2C threshold. If you understood this subject at all, you’d have known that. You keep claiming to be an expert and then you make these kinds of elementary mistakes.
I wasn’t planning to do any teaching, but in your case I’ll make an exception. You may recall that I had to do this before, when you denied up and down my statement that regressing two series with time trends will produce an R2 of 100%, an unbounded t stat, and a parameter estimate that is the ratio of the two time trends, in the limit. I challenged you to show I wasn’t right (rather than just bloviating I wasn’t right) and when you couldn’t do it I showed you I was right mathematically. Now it’s time for you to put up or shut up on your alleged climate science expertise.
You falsely claimed that feedbacks determine how much above 2C the temperature will rise, thereby confusing a threshold of damage with the basic greenhouse effect. Here’s what you need to do to convince me (and anyone else) you are qualified to comment.
1) Use the Stefan-Boltzmann law and energy balance to show that without positive feedbacks, equilibrium climate sensitivity (ECS) to a doubling of GHG produces about a 1C rise in temperature (thereby contradicting your 2C confusion).
2) Then incorporate estimates of positive feedbacks in your analysis to show that ECS rises to about 3C, in line with model estimates
If you can’t do it, I’ll teach you how it works, and I’ve done before. Menzie can use the answer in his class as well, and added bonus.
just to be clear, it seems rick will show us how we will get at least a 3C rise in global temperatures. at a minimum. please proceed, rick.
Rick,
Sorry, not going to play your game to ptovide some estimates based on some model you propose. Nemet is drawing off the IPCC report. Go read it if you do not understand these things, which you pretty clearly do not.
OK, let us take your stupid points one by one, just from your first slide. There is so much that is just totally gonzo off the effing wall.
Your first claim is that it is a tautology that there is no uncertainty that climate change is happening. Pretty clearly you have no idea what a tautology is. It is something that is true by definition. That climate is changing is a matter of empirical testing. It is not true (or false) by definition. I think what you want to claim is that climate has always been changing, although in fact you do not know that to be the case. But that is an empirical claim whether it is true or false. Do you have a detailed and complete weather record for the entire history of the planet since it came into existence? No. It is possible that there has been a location where for some period of time the climate was basically the same over some period of time. This is an empirical question based on measuring temperature and precipitation at certain locations over periods of time. It is not true by definition. You are simply dead wrong on that one and looking totally stupid on this..
Is it really true that you have no idea whatsoever what the meaning of the word “tautology” is? That is certainly what it looks like here, pretty clearly.
Now as it is, the temperature forecast is that the temperature will rise between 1 and 6 deg C by the end of the century. If one goes to the IPCC report it turns out that this is based on an estimated 95% confidence interval.. As noted, I agree with Marty Weitzman that this is questionable, but that is what the forecast is. The issue of lack of certainty is dealt with in Chapter 10 of the report, where it is recognized that there are nonlinear positive feedback effects whose degree is not well known or understood. There is an extended discussion of some of the sources of these and how they can lead to fairly sudden and dramatic changes in global temperature, as we know happened with the beginnings and endings of ice ages. The most dramatic of these involve changes in ocean flow patterns, which are difficult to model, but others involve changes in radiative forcing due to changes in snow and ice on the surface. The crucial point is that while the report recognizes these forces and processes may happen, they are not introduced into the estimates that are made of the ranges of possible outcomes, with these variations due to variations in possible climate sensitivity responses that are not due to any of these nonlinear positive feedback effects.
So Nemet is completely accurate in reporting that these nonlinear effects are not well known. He is also consistent with the IPCC report, which states this. I must note that it actually recognizes implicitly Weitzman’s point without citing him by noting that “upper end” of the range of outcomes is “uncertain” due to these nonlinear effects that are not modeled, whose action is uncertain. But the 1 to 6 degree range does not depend on them.
Regarding the matter of the 2 deg C increase, I am willing to grant that there is no clear reason why that is the cutoff for a “catastrophic” outcome. Indeed, I would prefer to see that stronger language reserved for some higher level of increase, but there is no definition or agreement on what constitutes a “catastrophic” outcome. So, if you want to whine about that, fine, be my guest. I would just remind that Weitzman provides a serious case that there may be a not completely infiinitesimal probability of something like a 12 deg increase, which is twice the upper end considered in the IPCC report. And that level of increase would certainly be so dramatic that I think the term “catastrophic” would be reasonable to use.
BTW, I have published extensively on catastrophe theory, but that is a mathematical theory where the word’s definition is not applicable to this matter of how much of a global average temperature increase should be called “catastrophic.”
In any case, you have nothing here, and dragging in the Stefan-Boltzmann law is really seriously irrelevant. Sorry. (and I have published on Boltzmann’s law in physics journals). Since you seem to be claiming to have some expertise on this matter, how about you provide an argument as to how it establishes your ridiculous claim that it rules out the kinds of temperature projections one finds in the IPCC report that Nemet takes seriously. Maybe CoRev will be impressed.
Pages 3 and 4
“Climate Science Basics very low uncertainty”
This is true if you have a very simple model of the earth as a black body and you calculate simple greenhouse gas effects. But if you add in the complexity of the actual climate, there is quite a lot of uncertainty. Cloud micro-physics in these models is highly uncertain for example.
Page 5 Lyndon Johnson Quote
It is interesting to note that Johnson’s comment was motivated by the Report of the Environmental Pollution Panel from the President’s Science Advisory Committee. That report is perhaps the first in government (it was published in 1965) to lay out the case for GHG emissions causing warming. Interestingly, the one estimate they provided overstated the effect by about a factor of 2 or so compared to modern models, although they did acknowledge the estimate was likely on the high side given the primitive modeling. Also, they suggested some geo-engineering to deal with the problem. In 1965, scientists and politicians had not yet realized the enormous potential for climate change to be used as a justification for substantially more regulations, taxes, and government control. They thought there should be an engineering solution.
Page 6
“Is the climate changing? Yes, zero uncertainty”
Never let a good tautology go to waste. Repeat it.
Page 10
“Is it us? Yes, 95% sure that >50% of +temp is human-caused”
Does anyone say I’m 95% sure that gravity follows an inverse-square law as a local approximation to General Relativity? Love that precision. Not 90% or 96% but 95%, like it’s a confidence level or something.
I agree with you about nuclear and that “catastrophe” may be overstating it.
But I just don’t get your other comments here. All measurements are going to have confidence intervals. What is so hard to believe about that?
AndrewG,
I agree that measurements have error bars and I have no problem with that whatsoever. My point is that these statements in the presentation are not measurements. When the presentation says that we are 95% certain that at least 50% of the temperature increase is man-made, nothing is being measured other than the subjective beliefs of the climate scientists. 95% is not a probability or a confidence level, although it sounds like it is. They are just saying that they are very sure that at least half of the temperature increase is due to GHG emissions. I’m pointing out that saying something precise, such as 95%, is misleading, implying measurements and statistics that aren’t really there.
Similarly, saying that uncertainty of the temperature rise is between 1C and 6C is not a statistical statement nor is it a statement of error in measurement. Rather, it’s a statement of the range of answers they get when they run different climate models that have been tuned in different ways according to the subjective judgment of the modelers. This statement also implies statistics and measurements that aren’t really there.
Page 13
“IPCC Range of temp in 2100: 1 – 6C”
It’s important to understand that this range is produced primarily by difference in cloud models used by the modelers. The dirty laundry of climate modeling is that important physical processes can’t be represented at the level of granularity that climate models are discretized and must be approximated with heuristic models. These heuristic models are then “tuned” by the climate modelers, i.e., the modelers make up the parameters to match some physical observation or according to their own judgment. Sometimes, they even cook the books by setting the parameters to target the climate sensitivity that produces the temperature rise they expect–they assume the conclusion in other words.
As a consequence, this range doesn’t give any real estimate of uncertainty.
“As a consequence, this range doesn’t give any real estimate of uncertainty.”
but it does give you a range of outcomes. a lower and an upper bound. it also tells you that warming is actually happening. contrary to what many of the deniers like to claim. the range is providing transparency from deterministic models. different inputs and assumptions provide different outcomes. that is to be expected. you are trying too hard to quantify the uncertainty here, rick.
“The dirty laundry of climate modeling is that important physical processes can’t be represented at the level of granularity that climate models are discretized and must be approximated with heuristic models. These heuristic models are then “tuned” by the climate modelers, i.e., the modelers make up the parameters to match some physical observation or according to their own judgment.”
I hate to break it to you rick, but this is actually how science works. nobody works with a perfect model that incorporates everything. so you make your models as transparent as possible. and you continue to improve them. and of course you tune them. people have always calibrated modeled systems, based on physical observations. there is nothing unusual or nefarious in any of this.
“Sometimes, they even cook the books”
not sure which crowd you hang out with, rick. but most of the scientists I know do not engage in such behavior.
Page 15
21 Estimates of Climate Change Impact.
This is what I’ve been waiting for. Page 2 said that the effects are widespread, catastrophic and irreversible.
Wait a minute. What??? If I’m reading this right, a 3C increase corresponds to welfare loss by 2100 of about 2% of GDP. Is that a typo? 2%? We know that the estimate for temperature rise based on the Paris Climate Commitments is about 3C, so this page is saying that the loss is very, very small. How is this catastrophic?
We also know that estimates from the IPCC and others generally are in the range of 2-6% of the level of GDP by 2100 (sometimes higher too) for a 3C increase. Is that a “catastrophe?” If world real GDP grows at 2% per year for the next 80 years, then the world will be almost 5 times richer in 2100 in real terms. Then the effect of climate change is to be 2-6% less rich than 5 times richer than we are today? If this is a catastrophe, then sign me up!
Look, per capital GDP in Europe is about 60% of the U.S. Not 94-98% but 60%. Is anyone talking about a catastrophe?
Rick,
Regarding the matter of a 2 percent decline of global GDP it must be noted that this will be very unevenly distributed across the earth’s surface. In fact the major part of it will be concentrated in poor tropical nations. with, for example, Bangladesh expected to take a 20% decline hit in that case.
Yes, 2slugs made that point earlier and I agreed with it.
Page 21
The Paris Accord is a “miracle”
How is it a miracle? If you take Paris commitment NDCs (which only go to 2030 mostly) and then extrapolate them to 2100, you get an estimate of about 3C increase with a range of about 2.5 to 3.5C. The Paris Accord in no way limits the temperature increase to 2C or 1.5C. Mostly, countries committed to doing what they intended to do anyway, with no binding commitment and no enforcement mechanism. Paris was hardly a “miracle.”
Page 26:
“Bad news: developing countries growing”
Said like a true first world elitist. Are you kidding? People in developing countries are very glad their economies are growing. Gets them out of poverty. Reduced mortality. All that good stuff first world climate change alarmists take for granted.
Page 28:
“Good news: technology improving”
Ok, what’s missing here? I’ll give you a hint. It produces about 75% of France’s electricity. But somehow, it’s never on the solution list.
However, I will give extra points on this slide since there are no picture of wind turbines. I’m with the Anemomenophobe-in-chief on this one. I hate wind turbines. I hate how ugly they are. And how they spin so ominously. A lot of eagles feel the same way. Thank you for no wind turbine pictures.
Rick, some days I really miss the LIKE button. 2slugs, Barkley, Baffled, and others epitomize how bias confirmation works to shut off logic.
Others like PGL/Lucy/Pagliucci exemplify Pavlov.
CoRev,
You got a logical critique of my critique of the slop that Rick put here?
Barkley, do you have a critique of my economic example of the article’s figure 1 in my response to you? I provided it to offset 2slugs misunderstanding about why I showed the Greenland data.
Without a critique I’m left with assuming you agree with the March 2100 estimate of US inflation.
CoRev: I’d love to get that March 2100 estimate of US inflation. What will be the corresponding inflation rate in the Klingon empire?
CoRev missed the chance to strike at the real weak point in Nemet’s research. He forgot to consult Bachelor’s in Communications holder and former TV sports anchor Sarah Palin and have her proofread his assertions on global warming. (OK, she used to play flute, but we can’t be overly-critical of people’s past). Palin says she once saw Republican James Inhofe throw a snowball on the U.S. Senate floor in mid-February 2015 and she has video to prove it. So, what do you and Nemets have to say about that??
* the name in the last sentence of my comment should read Nemet, not “Nemets”, my apologies.
Menzie, snark instead of a critique of the methodology? Without a critique I’m left with assuming you agree with the March 2100 estimate of US inflation.
BTW, if you can get me the Klingon fundamentals I can model it for any future. 😉
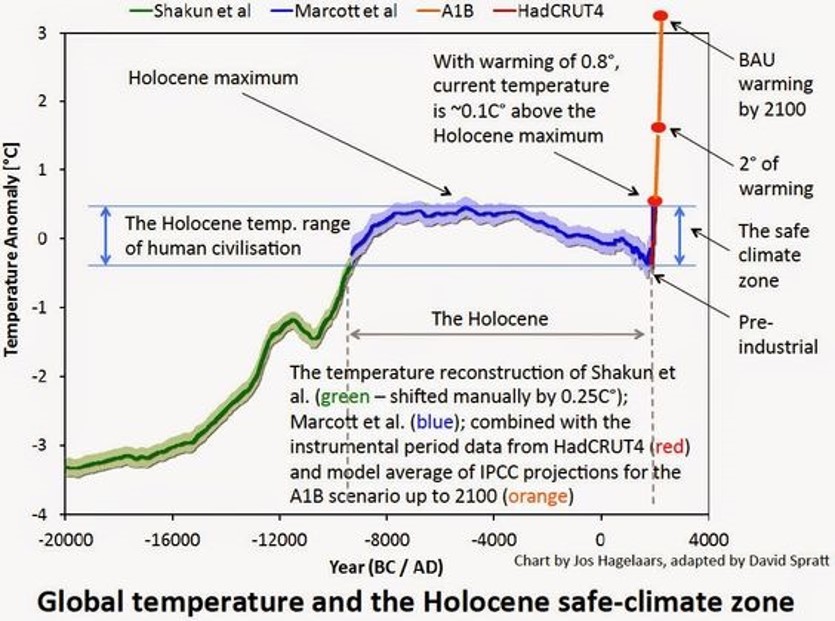
If it’s not already clear my complaint is with the statement: “With warming of 0.8C, current temperature is ~0.1C above the Holocene maximum”. Nope, not from the data in the 1st graph where the statement is made.
CoRev: Sure – what the heck. I agree with your March 2100 estimate of US inflation.
Why the fear to accept or discuss the obvious errors in the graph and its statement inf Figure 1 of this article or my alternative example: “Putting the first figure into economic terms: The March 2022 US CPI of 8.5 is higher than the historical decadal averages, and economic models provided by the Russian and Chinese schools of conservative economics show that the March 2100 CPI will be 43.25. Prove the models wrong..”
Menzie, I will use your lack of response: “CoRev: Sure – what the heck. I agree with your March 2100 estimate of US inflation.” as the poster for emotional, illogical, blind acceptance of unsupported claims. Bias confirmation at its worst.
CoRev,
Yes, they are incapable of learning since they are convinced they already know everything.
Serious question Rick: Who is going to read all of this? It’s tedious nitpicky page-by-page commentary.
AndrewG,
Most people won’t read it. I doubt most readers of this blog bothered to open Greg’s climate presentation much less read it carefully, as I did, so they don’t care. Barkley certainly didn’t open the presentation, although that didn’t stop him from commenting (it never does).
My comments are aimed at the few people out there who are genuinely interested in climate change, read the presentation, and are smart enough or knowledgeable enough to realize that I’m not making nitpicking comments, but deep, informative comments that they’ll have a hard time hearing about in a college classroom or in the media.
they are not deep, informative comments.
Rick,
LOh gag, how nauseating. You piled in here making it look like you were presenting slides you were presenting to students in a class. I get it you thought it was clear what you were doing, but it was not. Others, e.g. 2slugbaits, had the same initial impression I had.
As for your claim I did not read Nemet, sorry but you are wrong. Yeah, I did mispresent what he said about the 2 deg c increase initially, but that was quick reading, not no reading.
Then we had this weird bit where you tried to cook up some “challenge” for me to present a global climate model using the Stefan-Boltzmann Law. Whatever made you come up with something as silly as this? It is simply a textbook matter how it enters into models of global climate, not worth dragging through here. You seem to suggest that somehow it suggests that global warming is not happening or cannot happen quickly or something like that. Did you really mean to imply such a stupid thing? Did you? Gag again. Off to the vomitorium with you. This is like Bruce Hall trying to claim that there is still some sort of urban heat biaz in global temperature measurements, which there has not been for a long time. But actually your bit on this is worse than that one, which was actually a problem at one point. Your thing was and is totally vacuous from the top.
Then we had the blazing evidence that you have no idea what a tautology is. You may view this point as “cherry picking,” but I note that you kept coming back to that and mentioning it in your massively stupid remarks. More gag and another trip to the vomitorium.
I will give you a few points, but they are on pretty minor things. So Nemet did not mention muclear? Well, I would like to see nuclear in the mix, and it is in some other nations. But far various reasons it is just too expensive in the US now. You do not like wind because of birds? Well, actually bats are a more serious problem with wind turbines than birds, but this can be minimized by going offshore or otherwise being selective about locations.
On the 2 deg C matter, I would agree, although you did not actually articulate this very clrearly, that it is essentially a politically chosen cutoff coming out of a difficult negotiation involving nearly 200 nations. As I noted there is no definition of what constitutes “catastrophic,” but while a 2% decline in global GDP may not be all that bad in some nations, with some even having increases, in some others it will be very bad, e.g. Bangladesh, not to mention certain island nations that may disappear.
Oh, and indeed the conventional range of possible temp increase does go as low at 1 deg C, which would lead to an increase in global GDP something you did not notice and most ignore. But that is indeed a low probability outcome.
if anybody has ever published in a peer reviewed journal, on occasion you will get a reviewer that comments just like dick striker. editors hate folks like that, because they usually impede the publication of an otherwise solid article. wasted time in revisions, which ultimately water down the final product. once an editor notes this type of reviewer, they usually just reserve poor articles for such a doofus to review. some people actually contribute to the advancement of society. others become an impediment. which do you think dick falls under?
Barkley,
In reply to your comment , what I asked you to do is not use “some model.” I asked you to use “the model,” the most basic physics you learn about climate change modeling. That you don’t realize that along with the other fallacies in your comment show how truly ignorant you are of climate change science. So, I guess I will have take you to school once again.
The Stefan-Boltzmann law is written as A = sigma*T*4. Treating the earth as a black body, the total amount of energy flux emitted A is proportional to
the effective emission temperature of the earth raised to the fourth power, with sigma =5.6710^−8 /(^2^4)
0= incoming solar radiation=1360W/m^2
alpha =planetary albedo =0.3
Energy balance requires that
pi*R^2*(1-alpha)*S0 = 4*pi*R^2*sigma*T^4
Solving for T, we get T = 255K. Because of the “greenhouse effect,” some of the energy is trapped and re emitted by the atmosphere, resulting in
a temperature at the earth’s surface that is on average higher than 255K, i.e., 288 K (15C). But this won’t matter for the analysis.
We can also relate the change in the Earth’s radiation budget to the change in energy plus sensitivity to temperature change as
dR = dQ + lambda*dT, where dR is the change in the radiation budget, dQ is change in energy, lambda is the climate feedback parameter, and dT is the change in temperature. In equilibrium, dR = 0 and so
dT = -(1/lambda)*dQ
This is an important equation, since if we know dQ from the energy forcing and we know lambda, the climate sensitivity, then we can estimate the temperature change in equilibrium.
Let’s first estimate the value of lambda without any feedbacks. This lambda is called the Planck sensitivity and will tells us how much the temperature will rise purely from long wave radiation without any feedbacks. Going back to energy balance but assuming the system is out of balance,
R = (1/4)*(1-alpha)*S0 – sigma*T^4
dR/dT = -4*sigma*T^3 = dQ/dT = lambda = -3.7. So, our simple estimate of the Planck feedback is -3.7.
We also need dQ from a doubling of atmospheric C02. A well known-approximation from the climate literature is that
dQ = 5.35*ln(GHGfinal/GHGinitial).
Initially, GHG was 280 parts per million, so doubling gives us 560 parts per million. Hence,
dQ = 5.35*ln(560/280) = 3.7 W/m^2
We’re almost there. Going back to dT = -(1/lambda)*dQ, we have
dT = -(1/-3.7)*3.7 = 1
So, our simple estimate from first principles is that in the absence of feedbacks, the temperature would be expected to rise about 1C (not 2C as you falsely claimed Barkley).
How do these simple calculations fare with respect to the very complex global circulation models? Pretty well, actually. Let’s take a look at the paper Causes of Higher Climate Sensitivities in CMIP6 Models that appeared in Geophysical Research Letters in 2020 and let’s examine in particular the estimates of equilibrium climate sensitivities and Planck sensitivities in Table S2 . In the table, we can see estimates of ECS and the Planck sensitivity for the various CMIP5 models.
Notice that the average Planck sensitivity is -3.2 for the CMIP5 models, (Greg’s presentation seemed to be referencing the CMIP5 models), and so our estimate of ECS would be dT = -(1/-3.2)*3.7 = 1.15C, pretty close to the basic physics derivation of 1C. From the table, if you add all the feedbacks in, lambda becomes -1.08, and so the simple estimate of temperature change is dT = -(1/-1.08)*3.7 = 3.43 C. The model average ECS in Table S2 was 3.3C, so close.
You can repeat the calculation for the more up-to-date CMIP6 collection of models in Table S1 if you want. The CMIP6 collection of models run a little hotter than previous GCMs.
It should be now clear that feedbacks are the problem in climate change modeling, raising the temperature from about 1 to something over 3C from a doubling of GHG gases.
You treat the earth as a black body. That assumption has some flaws. And those flaws will impact second order effects like feedback loops. Your base model is not as accurate as you are implying.
rick, you assumed a doubling of CO2 in your model. your reference indicates a quadrupling of CO2 (assuming from same baseline, but not certain here). what, if any, error comes when you mix those two conditions in your comparisons?
when you assume an albedo of 30%, are you already including feedback items such as cloud cover and water vapor in that estimate for albedo? i don’t think this estimate is truly an estimate in the absence of feedbacks?
“It should be now clear that feedbacks are the problem in climate change modeling, ”
care to elaborate on what you mean by “problem”? or do you mean an important driver? or do you mean wrong?
Baffled,
The reference is about the equilibrium climate sensitivity (ECS) of the CMIP6 model collection. ECS is defined with respect to a doubling of CO2, so I’m consistent with the paper.
The calculation is not assuming any feedbacks from clouds, atmosphere, or anything else. It treats the earth as a blackbody with a planetary albedo, alpha, of 30%. That means that 30% of the solar radiation is reflected back and 1- alpha, or 70%, is absorbed.
The term pi*R^2*(1-alpha)*S0 says that (1- alpha) of the solar radiation S0 is coming through. It’s multiplied by pi*R^2, since the earth looks like the surface area of a circle to the sun. The other term, 4*pi*R^2*sigma*T^4, measures the earth’s radiation of the solar energy back into space. It’s the Stefan-Boltzmann relation multiplied by 4*pi*R^2, since energy is being uniformly radiated over the surface area of a sphere. In equilibrium, energy in equals energy out at a temperature of 255K.
I mean feedbacks are the problem in two senses. Without any net feedback, a doubling of CO2 would only raise the temperature by 1C, which no one thinks is much of a problem. Climate change is claimed to be a problem since net feedbacks boost the temperature increase by a factor of 3 or more, depending on the climate model used. Feedbacks are also a problem in the sense that they must be modeled accurately. Yet, many of the feedbacks can’t really be modeled except heuristically–cloud feedbacks being a notable example. The paper I linked to is pointing out that the ECS of the CMIP6 models is higher than CMIP5, and that’s primarily because the newer models have higher cloud feedbacks.
“Here we find that the temperature response to an abrupt quadrupling of atmospheric carbon dioxide has increased substantially in the latest generation of global climate models.”
rick, this is from the paper. hence the question i asked of you.
“It’s multiplied by pi*R^2, since the earth looks like the surface area of a circle to the sun.”
this is an approximation, but of course we know this is not completely accurate. it assumes a uniform absorption. The three dimensional atmosphere will keep this from occurring. just part of an approximation to keep the problem tractable, and not unreasonable. but an approximation.
“The calculation is not assuming any feedbacks from clouds, atmosphere, or anything else. It treats the earth as a blackbody with a planetary albedo, alpha, of 30%. That means that 30% of the solar radiation is reflected back and 1- alpha, or 70%, is absorbed.”
you are defining your aldebo as 30%. that is not controversial. what is not quite accurate is that feedback effects are not part of that assumption. water vapor produces cloud cover, and we know that cloud cover impacts albedo. white clouds are more reflective. we also know that water vapor and cloud cover are part of the feedback loops. in particular, if these are nonlinear effects, how you define your initial conditions can be impactful to the outcome. the way you are trying to make your argument, about the 1 degree contribution versus the rest, may not be as accurate as you are implying.
” Without any net feedback, a doubling of CO2 would only raise the temperature by 1C, which no one thinks is much of a problem. ”
most people understand that it is the co2 plus feedback that create the higher temperatures. when people mention the increase in co2 as a problem, implied in that is not only the direct greenhouse gas impact, but the secondary results (such as increased water vapor, cloud cover, etc). and as your numbers show, those feedback effects are not to be ignored. we may not know exactly what the upper bound of those impacts are, but we seem to have a good feel for what the lower bound will be. and even if you just consider the lower bound, it becomes problematic for global climate change. the realistic scenario is not that lower bound, however. there is little uncertainty that these second order effects exists. and the uncertainty is not equally distributed with its magnitude.
Baffled,
On your first question, the paper defines ECS with respect to a doubling of CO2, as is standard. The way they calculate it is to quadraple CO2 in the models and then divide the answer by 2. I could have done the same thing in my approximation, but it was not necessary since I’d get exactly the same answer. That’s because, from the properties of logarithms, ln(x^y) = y*ln(x)
On your second question, yes, I’m abstracting away from the fact that the earth has an atmosphere, clouds, water vapor, etc. That’s why I noted that 255K is not the surface temperature–it’s too low. If you want a bit more complicated model, you’d have two layers, including an atmosphere. 255K would be the temp in the upper atmosphere but the surface temperature would be higher. Doesn’t really change anything much if you add that complexity though. Also, an albedo of 30% is a measured parameter, not an assumption. And remember, we do know the approximation is pretty accurate, since we can check it against the Planck sensitivities of the CMIP models in the paper I linked to.
On bounds of ECS, the 2020 Review of Geophysics paper An Assessment of Earth’s Climate Sensitivity Using Multiple Lines of Evidence argues for bounds between 2C and 5.7C with a likely range between 2.6C and 3.9C.
Rick, Albedo of 30% is a measured property, as you noted. But included in that are features directly related to feedback loops. If those are linear, then your analysis is valid. But if those feedbacks are nonlinear (and that could very well be the case), then your discussion is not completely accurate, at least to the level you are implying in the discussion.
“It should be now clear that feedbacks are the problem in climate change modeling”
that statement is not accurate at all.
Barkley,
Ok, let’s move on to Lecture 2.
You said in your comment that “Now as it is, the temperature forecast is that the temperature will rise between 1 and 6 deg C by the end of the century. If one goes to the IPCC report it turns out that this is based on an estimated 95% confidence interval.” That was a reply to my point about the temperature uncertainty in Greg’s presentation where I said:
“It’s important to understand that this range is produced primarily by difference in cloud models used by the modelers. The dirty laundry of climate modeling is that important physical processes can’t be represented at the level of granularity that climate models are discretized and must be approximated with heuristic models. These heuristic models are then “tuned” by the climate modelers, i.e., the modelers make up the parameters to match some physical observation or according to their own judgment. Sometimes, they even cook the books by setting the parameters to target the climate sensitivity that produces the temperature rise they expect–they assume the conclusion in other words.”
Here is you second assignment.
1) Justify your claim by pointing to exactly where in the IPCC document this range is found and how it’s a 95% confidence level. Provide a link.
2) My point was that these ranges just reflect the differences in model specification and parameter tuning the model developers use. Yes, the IPCC will take 25 models with 25 different temperature projections, fit a normal distribution, and then report a 5% to 95% range of model output. But that has no objective probability interpretation. It’s just an empirical summary of the fact that the models differ because modelers use different assumptions. If you think your instructor is wrong, show by pointing to text you’ve linked to why I’m wrong, if you can.
Since you are a famous climate change expert with lots publications supposedly, you should have no problem setting me straight. But when you fail to do this, as I know you will, I’ll give you the answer, and in the process I will teach you some facts about IPCC temperature projections you didn’t know.
Rick,
Sorry, but I am not taking “homework assignments” from you. You do not have anything here at all in your wonderful calculation. Your link informs us that clouds and cloud dynamics are important. Well, that is right! I was tempted to provide a tetbook link showing how indeed they pretty much obviate your fantasies, but your and your stuff are just not worth it.
On the matter of the 95% confidence interval regarding the 1- 6 possible range of future temperature increases, you are technically correct that this is estimated from essentially running a bunch of variations of a bunch of models. Yes. But so what? The alternative is to have a whole lot of actual future temperature trajectories to observe out of which to estimate a ptobability distribution. But, guess what? We do not have that and will not. So IPCC doing the best they can. Indeed, this is the point in the different direction you ignore that Marty Weitzman made that the actual distribution may extend a good deal more in the upper direction given how the nonlinear positive feedback effects apparently really there in the world are not there in the model given the lack of knowledge of how strong or how those effects operate, a point made in the IPCC report itself as well as the generally nice summary of it that Nemet made that Menzie has reproduced here, that you provided your mostly horrendously inane comments here.
And I am now going to be outtahere on this thread, which has gone on too long with you fantasizing “skeptics” attempting to stir things up with your various vacuous piles of nonsense.
Barkley,
My calculation demonstrated that I was right that about 1C is the warming you’d expect from a doubling of CO2, not including feedbacks, just as I said it was.
In my notes to the slide on the 1-6C range, I said “this range doesn’t give any real estimate of uncertainty” because it was derived from running a set of models under different assumptions. You denied that, called me a moron, and asserted that it was a 95% confidence interval. Now you are admitting I was right, but shifted to the position that my point doesn’t matter! As Corev and I discussed, you are not capable of learning. No point in trying to teach you anything.
BTW, Weitzman never made any really important contributions on climate and a lot of his stuff was just plain silly. The Nobel Committee was correct not to give him any prize.
Rick, another opportunity for Like button response.
I doubt you will see any attempt to do the calculations. As they fear doing so would add doubts to their blind and emotional belief structures. They are similarly resistant to accepting the evidence of their economic policies as they are implemented by Biden.
Thanks Corev.
I don’t think the problem is that they fear doing the calculations. It’s that they can’t do the calculations since they have a newspaper level understanding of climate change. Alas, the kids in Public Affairs 200 will emerge from their class with the same newspaper level knowledge of climate change. Barkley of course is not aware of this, but that 1C – 6C range presented to the kids that he thought was a 95% confidence interval actually came from newspaper articles from 2007. Journalists took the bottom of the range of models for a low emissions scenario and the top of the range of models from a high emission scenario and presented that pseudo-range as “scientists say.” Not even the latest IPCC numbers and misleading to boot. Very typical in climate change.
Rick,
Stop lying about what is going on here. You have presented a simple-minded toy model of the global climate that is a joke. Your calculations are not inaccurate. They are unimportant, representing a small part of the total system.
Get your calculations presented here accepted for publication in a peer-reviewed journal like the one you cited, and maybe somebody other than the ludicrous CoRev will take your junk seriously. You will not be able to do so, and you know it. So, STFU.
It’s you who are being dishonest Barkley. I asked you to justify your false statement that 2C will happen without feedbacks and I asked you to prove you are qualified to critique my climate change points by showing knowledge of the most basic climate change physics. I asked you to do that because if you did, you’d automatically refute your 2C misunderstanding. As I expected, you were not able to explain the most basic ideas. I would not have asked you to do it if you had not been so rude to me in your comments.
You are now trying to divert attention from your obvious ignorance by claiming that I have proposed some toy model. But I haven’t. I’ve just written down the most basic climate analysis you’d find in any climate modeling textbook, analysis you obliviously don’t know. CoRev knows it. I know it. Lot’s of people know it.
Rick,
You are totally delusional. I have been working with climatologists for nearly half a century on how it works and its relations with economics. I have publications in refereed journals in various disciplines on these matters with google scholar citations, as well as highly cited books as well. I am identfied as a “mathematical economist” by Wikipedia and have published in highly mathematical eocnomics journals like the Journal of Economic Theory, as well as math and physics journals. I am slso one of the world’s leading experts on nonlinear complex dynamics in economics, something verified by the fact that I am the most cited person appearing in the Wikipedia entry on “complexity economics.”
So, buster, I have a public record on this. I know this stuff far better than you do. Your presentation of your toy model is a hilarious joke. Get it published, and maybe somebody other than the serially wrong CoRev will take you seriously.
Oh, I also note that if you think you are going to start a blog that will make any sort of substantial impact while operating under a phony name, especially one as hilariously embarrassing as the one you operate under, think again. All the top 10 economics blogs are run by people whose real names are well known, as is the case with this blog, which happens to be one of those top 10 ones.
CoRev,
OK, I shall add one more brief comment, since you have weighed in with being all impressed by Stryker’s fiddling with his simply toy model that he wants other people to waste time fooling with, even though the role of the Stefan-Boltzmann law and related matters he drags in are long and well established and integrated into the models underlying the IPCC estimates.
We get that when publications by others are dissed by Rick, when he and you want to you guys like to cite articles that you think support you half-baked points. So, here is the bottom line to Rick: if your toy model is so wonderful and insightful, how about you submit it to the journal you linked to, Geophysical Research Letters, and see if they will publish it. We all know what the answer to that is, and you will not waste your own time trying to do so because you also know what the answer is. Nevertheless, you have the nerve to show up here demanding we waste our time fooling with your worthless garbage.
Of course, CoRev is impressed. But this is a guy who never could get it straight to us what it was he did and which awards he received for his supposed participation in the Apollo space program. And, even if you, Rick, were to actually submit your stuf to GRL and get it accepted, you would not be able to tell us because then you might have to reveal your actual name. And that cannot be allowed!!!!!
Barkley, what an amazing example of a word salad response. What you showed nonsensical response is you don’t know nor recognize the equations for the basic physics of climate science.
I already knew this. That’s why I included the economic example for how poor the article’s Figure 1 was. To date no one has discussed the methodology used in my example. Since I used the same methodology used to create Figure 1, if the econ example is attacked so would Figure 1 be attacked.
Of course, along with Menzie, you probably accept my March 2100 estimate of inflation.
While we are talking about the articles figures, let’s look at Menzie’s claim of Figure 2: ” the good news regarding developments in climate change mitigation, particularly in costs of alternative energy production.” Is it really? Most thinking adults realize that the true costs of electricity generated from these cheapening sources is actually additive with the base-loads required to provide power reliably. when the Sun doesn’t shine or the wind doesn’t blow. Worse, these reliability issues also occur when too much Sun and wind occur and feed from these cheaper sources are throttled back or turned off.
https://debunkhouse.files.wordpress.com/2020/11/pv-1.png shows solar on a good day.
https://debunkhouse.files.wordpress.com/2020/11/pv-2.png shows solar on less than clear days.
Graphs are from this misinformation site (Menzie’s past definition): https://wattsupwiththat.com/2022/04/26/honolulu-hawaii-top-solar-superstar-in-the-usa/
I know that these costs are additive, because I am paying them. My electric bill from my cooperative source for electricity went up by 1/3 this year. What changed? The cooperative which prior only bought electricity decided to buy the hype associated with solar and took advantage of the Federal and sate subsidies to install their own solar farm to generate and supply some of this cheap electricity. They are in the process of adding another.
Look again at the above graphs to understand why the costs are additive and in my case adding 1/3 to my price paid.
Only the willingly ignorant want to add more of this cheap intermittent energy to the world’s grids, and they willfully ignore the additive nature of the costs.
I had an electric plan that was tied to the cost of natural gas. it has just about tripled in the past year. so I changed to a new plan a couple of months ago, that was not tied to the cost of natural gas. much cheaper.
Baffled, this comment is so dumb it’s not worth refuting. Those arguments have already been presented several times. Some day you and Macroduck will explain the technology used to separate put those ole natural gas electron delivered in your plan.
separate “out”
there is nothing to refute corev. what i made was a statement of fact. maybe you need to improve your reading comprehension. but i do have a cheaper electric plan today.
Baffled, of course your plan is cheaper than before. It was your selection priority of criteria. Customers pay for these unsubsidized improvements to harden supply.
Corev, you just can’t help yourself from saying something stoopid. Must be another clogged artery reducing oxygen flow to your brain.