With the release of personal consumption and income for October, we have the following picture of key series followed by the NBER BCDC (along with monthly GDP from IHS Markit, formerly from Macroeconomic Advisers).
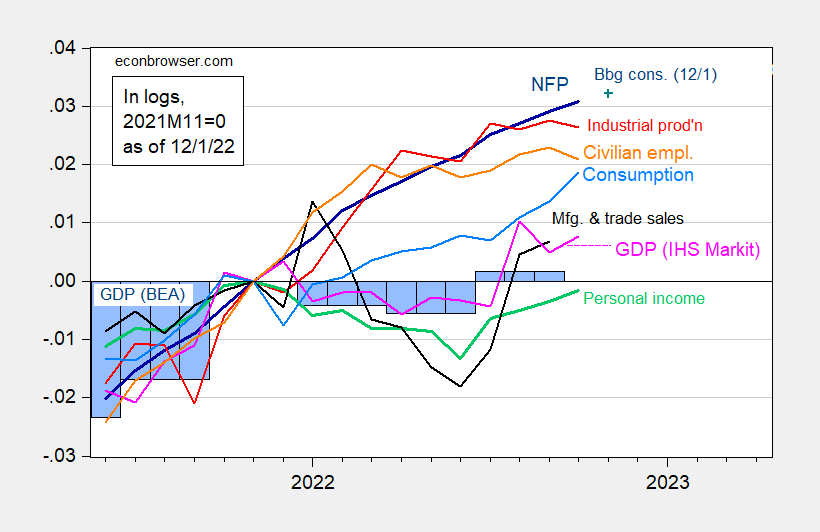
Figure 1: Nonfarm payroll employment, NFP (dark blue), Bloomberg consensus as of 12/1 (blue +), civilian employment (orange), industrial production (red), personal income excluding transfers in Ch.2012$ (green), manufacturing and trade sales in Ch.2012$ (black), consumption in Ch.2012$ (light blue), and monthly GDP in Ch.2012$ (pink), GDP (blue bars), all log normalized to 2021M11=0. Q3 Source: BLS, Federal Reserve, BEA, via FRED, IHS Markit (nee Macroeconomic Advisers) (12/1/2022 release), and author’s calculations.
Personal income excluding current transfers and consumption continued to rise. While Q3 GDP was revised up by 0.3 ppts SAAR, IHS Markit Monthly GDP rose in October as well:
Monthly GDP rose 0.3% in October following a 0.5% decline in September. The latter was revised lower by 0.4 percentage point. The increase in monthly GDP in October was more than accounted for by a solid gain in real personal consumption expenditures. Elsewhere, gains in October were recorded for nonresidential fixed investment, nonfarm inventory investment, and others, while declines were recorded for residential investment and net exports.
GDPNow as of today is for 2.8% q/q SAAR in Q4. Given the likely revisions in GDP and the evolution of GDO, it seems unlikely (still) to me that a recession occurred in 2022H1. A recession in 2023 however, seems likely given yield curve inversions and other predictors.
I am leaving this comment half an hour before the November jobs report is posted.
The most comprehensive report on actual payrolls for the lion’s share of workers is tax withholding as updated in the Daily Treasury statement. Since it is obviously not seasonally adjusted, the only reasonable way to measure is YOY. Different people use different measures. One good one, for example, is the 10 weeks average by Liz Ann Sounders at Schwab. Her measure, like all the others I have seen, shows maximum growth through last March and then a relentless decline. Sounders measure peaked at +13% in March, and when I checked last week was down to about +3%.
For the entire 3 month Sep-Nov period, withholding taxes are only up 3.5% YoY.
According to the establishment report, jobs increased by 3.6% for the 12 month period through October. Not exactly apples to apples, but that could only be justified if there were *no* wage increases at all during that period – as opposed to the actual 5.5% increase in non-supervisory wages.
That tells me that the household report, which is only up 2.8% for the 12 months ending in October, and only up 0.1% since March, has been telling the much true-er tale.
In the past when this has happened, job gains of under 100,000, or outright losses, in either the household or establishment reports have occurred +/-1 month.
Bottom line: tax withholding is telling us that a recession as measured by job losses is closer than recent establishment reports have suggested, and strongly implies that there will be major downward revisions when the final numbers for H2 2022 are reported late next year.
“Sounders” —> “Sonders.”
Autocorrect strikes again.
I noticed FRED is reporting nominal GDP for 2022Q3 which was 1.13% higher than it was for 2022Q2. Now the GDP deflator rose by only 1.05% q/q. So is it safe to say real GDI rose for 2022Q3?
BEA has the answer to my question:
https://www.bea.gov/news/2022/gross-domestic-product-second-estimate-and-corporate-profits-preliminary-third-quarter
It reports that real GDI grew by 0.3% (this is annualized) last quarter while real GDP grew by 2.9% (annualized) so their average growth was 1.6%. Of course as the economic data for 2022 has become a bit clearer, it seems all those RECESSION CHEERLEADERS have run and hid.