Here are the levels of headline and core CPI, versus forecasts and nowcasts.
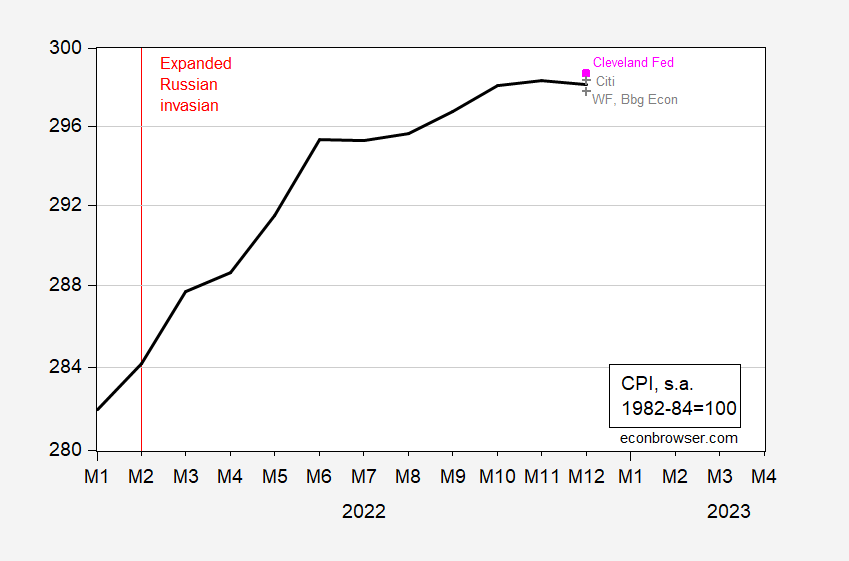
Figure 1: CPI level, 1982-84=100 (black), Cleveland Fed nowcast as of 1/11/2023 (pink square), high and low forecasts (gray +). Source: BLS via FRED, Cleveland Fed, Bloomberg (1/11/23), author’s calculations.
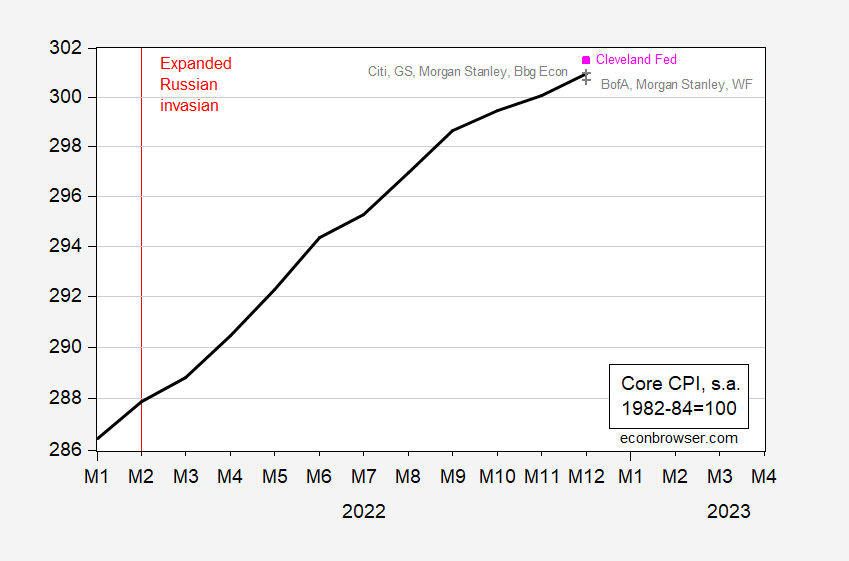
Figure 2: Core CPI level, 1982-84=100 (black), Cleveland Fed nowcast as of 1/11/2023 (pink square), high and low forecasts (gray +). Source: BLS via FRED, Cleveland Fed, Bloomberg (1/11/23), author’s calculations.
What does this mean for core inflation? In Figure 3 I plot the actual and implied inflation rates.
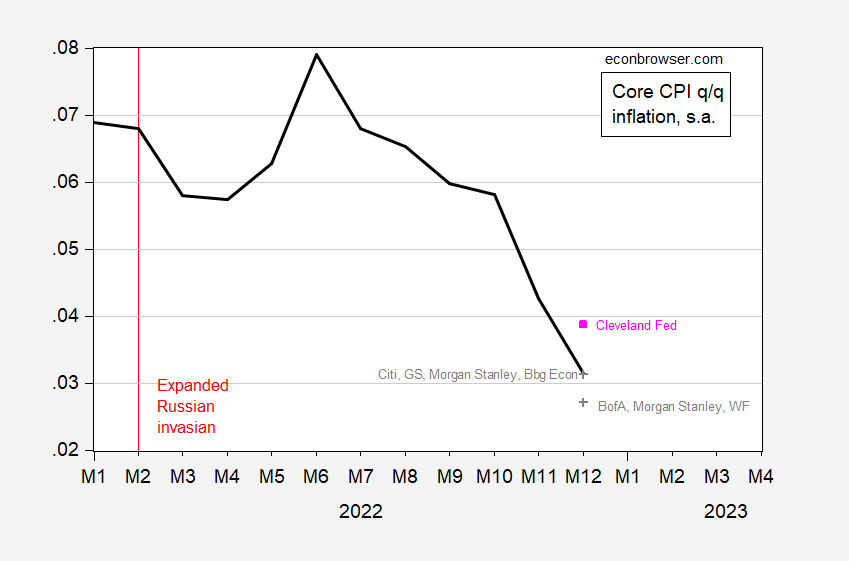
Figure 3: Quarter-on-quarter core CPI inflation rate, annualized (black), Cleveland Fed nowcast as of 1/11/2023 (pink square), high and low forecasts (gray +). Source: BLS via FRED, Cleveland Fed, Bloomberg (1/11/23), author’s calculations.
Actual q/q core inflation undershot the Cleveland Fed’s nowcast. In Figure 4, I show CPI vs. PCE q/q core inflation.
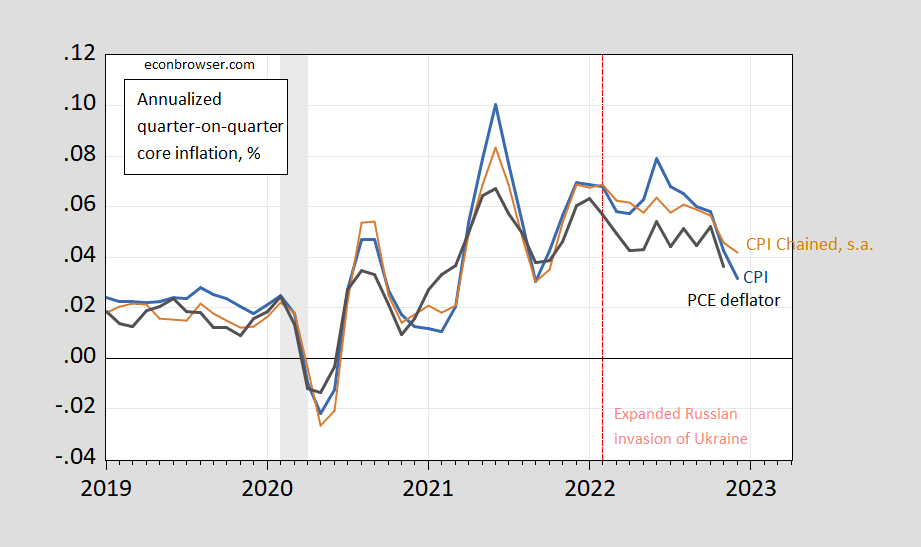
Figure 4: Quarter-on-quarter inflation of core CPI (blue), chained core CPI (brown), personal consumption expenditure core deflator inflation (black), all in decimal form (i.e., 0.05 means 5%). Chained CPI seasonally adjusted using geometric Census X13 (brown). NBER defined recession dates (peak-to-trough) shaded gray. Source: BLS, BEA, NBER, and author’s calculations.
This development seems to support the idea of a switch in the inflation regime (see this post). Although m/m CPI inflation rose, the Cleveland Fed’s nowcast for core PCE in December was little changed in response to the CPI release, and now stands at 0.32 ppts m/m.
As your 1st graph shows – headline CPI has almost a flat line from June 2022 to Dec. 2022. To be precise – over the 6-month period, CPI has risen by just over 0.9%. Annualized – actual inflation has been less than 2%.
MoM. Anecdotal, the price of a dozen eggs has decreased to $5.94 from $6.
YoYoY. headline CPI Dec 2022 – 6.5%; Dec 2021 7.0%; compounded two- year headline CPI [over Dec 2020] = 13.96%.
Flat.
Yes the relative price of eggs. Unless you are dumber than a Russian bot – you would know why. Ever heard of bird flu?
A few commenters have recently taken to citing very backward-looking price changes over arbitrary periods. I will happily join in the fun: The rise in CPI from March of 1947 is 1,350%.
There’s nothing special about a 908 month measure of price rise, any more than there is something special about your 24 month measure. But apparently, this is now fashionable, and I’m all about fashion.
Of course, there is a point to looking at more recent data – the past six months, for instance. That point is that changes in recent inflation trend are informative to policy makers. If inflation is slowing, then policy makers should consider whether additional rate hikes are necessary. The fact that headline inflation has been near target over the past six months is important for policy. Core inflation has stopped accelerating over the past 6 months, and has slowed over the past 3 months, but is not yet near target – also important for policy. Neither the 908-month price rise nor the 24-month price rise is all that important for policy.
While this was funny – be prepared for the normal whining ala Bruce Hall. After all – he is Steno Sue for Kelly Anne Alternative Facts Conway.
Gee, ProLiberalGrowth, you chided me for that same observation when the November CPI came out. Now you love change from a point in time. Of course, you still hate the January, 2021 to June, 2022 calculation because, well, just because.
https://fred.stlouisfed.org/series/CPIAUCSL
Do you not understand anything? Did you not read Blinder’s oped? OK clueless worthless wonder. Try reading that thorough mocking Macroduck laid on you. Or the most recent posts from our hosts?
Damn Bruce – why do you embarrass your mother with such absurdly stupid comments?
I think Dean Baker’s take on this is pretty good:
https://cepr.net/whipped-inflation-now/
“ the 0.3 percent rise in the core index should not be terribly troubling. The biggest factor pushing the core index higher was a 0.8 percent rise in both the rent proper index and the owners equivalent rent index, which together comprise almost 40 percent of the core index. ….
“We know the rent indexes will be showing much lower inflation in 2023, and possibly even deflation, based on private indexes of rents in marketed units. Research from the Bureau of Labor Statistics shows that these private indexes lead the CPI rent indexes by six months to a year. With inflation in these indexes having turned downward in the summer, we know that in the not distant future, the inflation rate shown in the CPI rent indexes will fall sharply.”
My only quibble is (1) how much further will OER and shelter rise? and (2) how quickly will they fall? I’m a little skeptical of using the new private monthly apartment rent indexes, when we have 30+ years of FHFA and Case Shiller house price indexes which tell a similar story (OER lags house prices by 12+ months). If we use house prices, it suggests shelter has somewhat higher to go first, and may not start to decline from peak until about mid year.
But the only previous time I can find in the past 60 years where the Fed raised rates in the face of already declining YoY inflation is Volcker in 1981. I see no reason why we should duplicate that result.
Thanks for Dean’s excellent discussion. I love his title
“Whipped Inflation, Now”
Harkens back to 1974 and Gerald Ford’s idiotic WIN buttons!
While WIN buttons were silly, WIN itself was not.
Pres. Ford was encouraging demand destruction targeting food and energy conservation. Actions proposed for consumers included carpooling, turning down thermostats, insulating houses, and starting their own vegetable gardens. Carpooling is still strong today and growing your own food is now common practice. Nobody wants an uninsulated house anymore and smart thermostats that conserve energy are state of the art.
The bottom line is that CPI inflation peaked one month after Ford presented WIN to Congress in October, 1974. It declined for the next 2 years from 12% annualized to 5% annualized in December, 1976 (Ford’s last full month in office). Like many of his generation who lived through WWII, Ford believed that collective action to conserve food and energy would be successful at reducing demand.
As a policy, Nixon’s wage and price controls (also based on WWII experience) were far less successful in reducing inflation. But that policy is not ridiculed today.
Instead, we have the Fed now raising interest rates risking a recession and millions of job losses. During the WIN program, the Fed reduced interest rates attempting to prevent rising unemployment which increased from 6% in October, 1974, to its peak at 9% in May, 1975. Unemployment did not get back to 6% until May, 1978.
The Fed should stop raising interest rates now, but of course it won’t and will over-shoot again. The working class will suffer the worst consequences as it always does.
Yes – unemployment did rise to 9% in early 1975. I agree with your closing statement. Lower interest rates – NOW!
We have reason to think that a slower pace of rise in the cost of shelter is baked in the cake, even if private rent data are sketchy as a forecasr of OER. Knowing that, we might want to look at ex-shelter measures of inflation. Here’s core sticky-price CPI, excluding shelter:
https://fred.stlouisfed.org/graph/?g=YG9f
The 3-month annualized pace of change is zero. Zero, if persistent, is too low.
Not that you need reminding, but the Fed prefers the PCE deflator over CPI in part because of the heavy weighting of OER in CPI.
https://www.bls.gov/news.release/realer.t01.htm
Real average hourly earnings for all employees increased 0.4 percent from November to December, seasonally adjusted, the U.S. Bureau of Labor Statistics reported today. This result stems from an increase of 0.3 percent in average hourly earnings combined with a decrease of 0.1 percent in the Consumer Price Index for All Urban Consumers (CPI-U).
Real average hourly earnings also rose from Oct. to Nov. Note however real earnings are still lower than they were in Dec. 2021.
Professor Chinn,
It may be interesting to show the graph of the core commodity CPI Index (FRED series, CUSR0000SACL1E) and core services CPI Index (FRED series, (CUSR0000SASLE).
The core commodity CPI index peaked at 168.02 for 2022m09 and has declined since then to 165.35, a decrease of 1.59%. December 2022 showed a decrease of 0.34%. Using dlog(CUSR0000SACL1E) c MA(1) MA(2) , the forecast for January looks like it could be about 165.48, or an increase of 0.08%. The model forecasted a decrease of 0.09% for December vs. reported decrease of 0.34%.
Core services inflation seems to be on an upward trajectory. The core services CPI index was at 379.76 for 2022m09 and is at 385.46 for 2022m12, or an increase of about 1.5%. Using dlog(CUSR0000SASLE,2) c d(Dum2020m04,2) MA(2) MA(3), the forecast for January looks like it could be about 387.71, or an increase of about 0.58%. The model forecasted 0.55% vs. reported 0.55%.
Weighting commodities and services, the forecast for 2023m01 is at 0.48%. The 2022m12 weighted forecast was at 0.40% vs. reported at 0.30%.
I wonder if core CPI will get help on the downside from commodity inflation for January. If not, core CPI could surprise on the upside.
Another model which does not split commodity and services forecasted 2022m12 core CPI at 0.34% vs. reported at 0.30%. This model forecasts core CPI at 302.33 for 2023m01 vs 2022m12 actual at 300.97, or an increase of 0.45%.
That was very informative! Thanks for doing the hard work.
Pgl,
Thank you for the comment.
You could build the picture and link. Pretty please?
Hi MD,
I don’t understand what you want. If I could post a graph, I would.
Are asking me or Professor Chinn?
You. Here’s a link to the picture, with services ex-shelter added, Q/Q annualized:
https://fred.stlouisfed.org/graph/?g=YGeH
Just below FRED graphs, on the left, is “Share Links”. That’ll do it.
MD,
Below is the best I can do for links. I don’t know how to link only one year’s worth of data; FRED seems to default to MAX on links.
The commodity curve looks like it has a bit of an inflection for November 2022. The MA(1) MA(2) model may be picking-up the inflection.
In his book, “Applied Econometric Time Series”, Walter Ender says that MA models sometimes are able to pick-up inflections.
https://fred.stlouisfed.org/series/CUSR0000SACL1E
https://fred.stlouisfed.org/series/CUSR0000SASLE/
Thanks to all of you for those excellent FRED graphs. This is why we blog!
AS,
The date controls are top right from the Fred graph, and can be sticky. It’s nice when they aren’t sticky and helpful with presentation.
The real motivation for bothering with FRED controls is that we commenters have limited ability to present data any other way.
Some good news on the climate change policy front:
https://www.msn.com/en-us/weather/topstories/cheery-climate-news-cancer-linked-ozone-hole-from-hairspray-and-acs-continues-to-close/ar-AA16932i
LIVING WITH CLIMATE CHANGE
The cancer-causing hole in the ozone layer that was at one time Eart That layer shields the planet from harmful ultraviolet rays linked especially to skin cancer, but also to cataracts and crop damage. Those chemicals included chlorofluorocarbons (CFCs) that were used as solvents and refrigerants, including in air conditioners. This ban is “saving 2 million people every year from skin cancer,” United Nations Environment Programme Director Inger Andersen previously told The Associated Press.h’s biggest environmental dilemma will have fully healed in about 40 years, a report out Monday shows. A once-every-four-years United Nations scientific assessment of the ozone has found continued recovery during the more than three decades after all nations agreed to stop using the refrigerants and aerosols that arguably made life cooler and hair bigger, but spewed chemicals that ate away at the layer of ozone in Earth’s atmosphere.
I saw this on a morning news show that also showed a clip of Donald Trump complaining that the limitations on hair sprays made it harder for him to do whatever he does to that ugly hairdo of his. Trump actually suggested that any aerosols he put into his apartment not affect the ozone layer. Seriously – does he never leave his place of residence at all? That itself would be great news.
I realize that there has to be a major fear campaign every so often, but it really seems odd that the ozone hole over Antarctica should have any impact on the rates of skin cancer over the rest of the globe. Now that is not to say that it would not have been a problem if the “hole” had spread (there actually was ozone over Antarctica, but at a very reduced level), but unless that UV radiation was bouncing around the troposphere, it’s hard to see any relationship with skin cancer rates.
https://earthobservatory.nasa.gov/images/49040/ozone-hole-through-the-years
Although that link was not updated after 2010, it’s unlikely that the ozone hole grew massively for a few years and then shrunk again. So, it might be interesting to know how 2 million people a year were saved except on the basis of speculation. There certainly are not any control groups who were exposed to the lower ozone protection while sunbathing in Antarctica for a few decades.
You may or may not recall the tanning bed craze a few decades ago resulting in leathery skin and cancer. But the exposure from those was different from natural sunlight.
Tanning beds use fluorescent bulbs that emit mostly UVA, with smaller doses of UVB. The UVA radiation is up to three times more intense than the UVA in natural sunlight, and even the UVB intensity may approach that of bright sunlight.
…
In 2007, the International Agency for Research on Cancer analyzed 19 studies on indoor tanning and the risk for melanoma. It concluded that people who started indoor tanning before age 35 had a 75% greater risk of developing melanoma. Since 2003, UV radiation from any source has been listed by the U.S. National Toxicology Program as a known carcinogen (cancer-causing substance). Currently, many government agencies caution against tanning.
https://www.health.harvard.edu/staying-healthy/is-a-tanning-bed-safer-than-sunlight
As I recall, the ozone hole grows and shrinks pretty impressively every year. In the bad old days, non-seasonal changes from year to year could be large.
Interesting how you feel the need to dismiss science as scare-mongering without any evidence. Kinda like the tobacco companies did. Kinda like climate change deniers do. Kinda like coal companies did with acid rain.
Kinda like you are unwilling to address science in an unbiased way.
Macroduck: C’mon! Cigarette smoking is good for you! (You could ask my dad, if he were still alive). Acid rain? Great for wildlife. Climate change? A good flood now and then is a plus! That’s Bruce Hall’s worldview for you.
“By the way, doctor: Is a tanning bed safer than sunlight?”
I think Brucie has pulled another Bruce Hall – not reading his own link. This discussion never dismissed the harmful effects from sunlight at all. It just said tanning beds can also be harmful too. Maybe Brucie spends a couple of hours tanning indoors after his bleach regimen. Trump certainly does.
Menzie says: ” A good flood now and then is a plus! “, but any flood is a WEATHER EVENT and NOT climate. It is this basic misunderstanding of science that has caused the climate catastrophe conundrum. It’s almost like focusing on a single item’s price increase, Y’ano like eggs, when discussing over all inflation.
It’s science and its meant to be questioned, not blindly believed.
CoRev
January 13, 2023 at 5:24 am
More evidence that the hole in the ozone has completely rotted CoRev’s excuse for a brain.
@ CoRev
You don’t think ocean levels rising from the melting of glaciers increases global flood rates?? CoRev, I want you to try something, Fill your bathtub to the rim of the tub with bathwater, right up all the way to the rim, then turn the water off when it hit the rim. Now take a black magic marker and write on your chest “melting arctic glacier” and get into the tub up to your neck in water. Now…… do you see all that water that just gushed out onto your bathroom floor?? It’s literally that “hard” to understand.
https://coast.noaa.gov/states/fast-facts/recurrent-tidal-flooding.html
Please, for the love of God, stay away from tutoring small children who would never recover from your influence.
A snippet from Moses reply to CoRev:
Compared to high tide flooding frequencies typical in 2000, 2020 was extraordinary. Flood days occurred 100 to 150 percent more frequently than in 2000 along the Northeast Atlantic and Eastern Gulf coastlines. Even higher percentage increases (more than 400 percent) occurred along the Southeast Atlantic (for example, more than a 400 percent increase in Charleston, South Carolina, with 14 days in 2020, compared to about two days in 2000). Percentage increases compared to 2000 were the greatest in the Western Gulf (more than 1,100 percent, or 22 days) in Bay Waveland, Mississippi.
Wait for it. CoRev is about to start screaming WEATHER, WEATHER, WEATHER. It is on par with the “Stop the Steal” babble from the other MAGA hatters.
I now see even more evidence of total misunderstanding of climate science. A ludicrously unrelated melting example and the obligatory snark from the peanut gallery.
An individual flood is a weather event. An increase in the frequency and severity of flooding is climate change. Pakistan’s disastrous flooding in Q4 of 2022 was the result of glacial melting, which is symptomatic of climate change.
You really need to adopt a less simplistic view of things. There is something more than weather in the world.
MD, how more confused can you be? Your example of blind belief is extraordinary. “An individual flood is a weather event. An increase in the frequency and severity of flooding is climate change. Pakistan’s disastrous flooding in Q4 of 2022 was the result of glacial melting, which is symptomatic of climate change.”
An individual flood, Pakistan’s disastrous flooding in Q4 of 2022, by your own definition is a weather event. Claiming weather events are caused by Climate change is similar to claiming inflation is caused by GDP change. Both are way too broad/wide ranging impactually to add meaning.
For example, reducing atmospheric CO2 has as much merit as reducing ENSO (la Ninas/el Ninos) in changing climate. They are both mostly nature driven.
Please stop displaying your ignorance.
When you think CoRev is the most dishonest if not stupid troll ever – he exceeds expectations as in this comment
CoRev
January 14, 2023 at 4:26 am
Macroduck has a very good point and what does CoRev reply with. Sheer BS. CoRev has never argued in good faith so why do we expect him to do so now?
Ole Bark, bark, please, please stop displaying your ignorance. You’ve already won the contest of who’s most ignorant. You’re only one upping yourself, or digging the hole deeper..
CoRev: I am sorry. Who are you addressing your remark to specifically?
@ Menzie
CoRev is addressing his remarks to something called “the ether” or “the great void”. CoRev calls it “bark bark” because he hears echoing dog noises in his head. Other concerned parties gave up listening awhile back.
Are you now inhaling hair spray with your daily dose of bleach? That would explain your latest babbling I guess. BTW – I have outsourced mocking your incessant stupidity to Macroduck.
BTW – I guess you did not look at your own link on CPI very carefully as it sort of makes Blinder’s point about the low inflation regime. Or are you jealous that JohnH and Princeton Steve have taken the lead in the 2023 contest for Dumbest Troll Alive. Brucie – we have faith that can win this time. So keep it coming!
Hey Brucie – I guess you did not read the end of your own 1st link:
In their 2010 report, the science advisers to the Montreal Protocol found that:
• Global ozone and ozone in the Arctic and Antarctic is no longer decreasing, but is not yet increasing.
• The ozone layer outside the Polar Regions is projected to recover to its pre-1980 levels some time before the middle of this century. The recovery might be accelerated by greenhouse gas-induced cooling of the upper stratosphere.
• The ozone hole over the Antarctic is expected to recover much later.
• The impact of the Antarctic ozone hole on surface climate is becoming evident in surface temperature and wind patterns.
• At mid-latitudes, surface ultraviolet radiation has been about constant over the last decade.
This confirms what my source had said. Yes – pulling a “Bruce Hall” is now in the Webster Dictionary for someone who fails to read his own link. Damn Bruce – this must be your forte!
“In their 2010 report, the science advisers ..” blah and more blah, until we see “The recovery might be accelerated by greenhouse gas-induced cooling of the upper stratosphere.” And might not be accelerated by GHGs because it might also be caused by fluorocarbons and …
But bias confirmation changes maybes/mights to absolutes.
That how modern liberal science works.
There’s ignorant and then Ole bark, bark proves he can top that.
Wait – you are now accusing Bruce Hall of being a left winger? This was Brucie’s link. Of course Brucie could not be bothered to READ his own link.
Hey CoRev – try to keep up with the conversation. DAMN!
“That how modern liberal science works.”
CoRev’s preK teacher keeps telling this little boy that 2 plus 2 = 4. CoRev does not believe her as after all arithmetic is a Communist plot. And of course modern medicine is wrong according to CoRev who still practices blood leaching.
MD,
Thanks for the tutoring.
I had not noticed the link button.
Not certain if this embed is correct from FRED
Embed did not work, so below is the link. Two different formats.
The m/m percent changes for core commodities and core services look a bit worrisome.
https://fred.stlouisfed.org/graph/fredgraph.png?g=YGkS
https://fred.stlouisfed.org/graph/?g=YGkS