Trump has indicated his desire for a weaker dollar. It looks like he’s getting it.
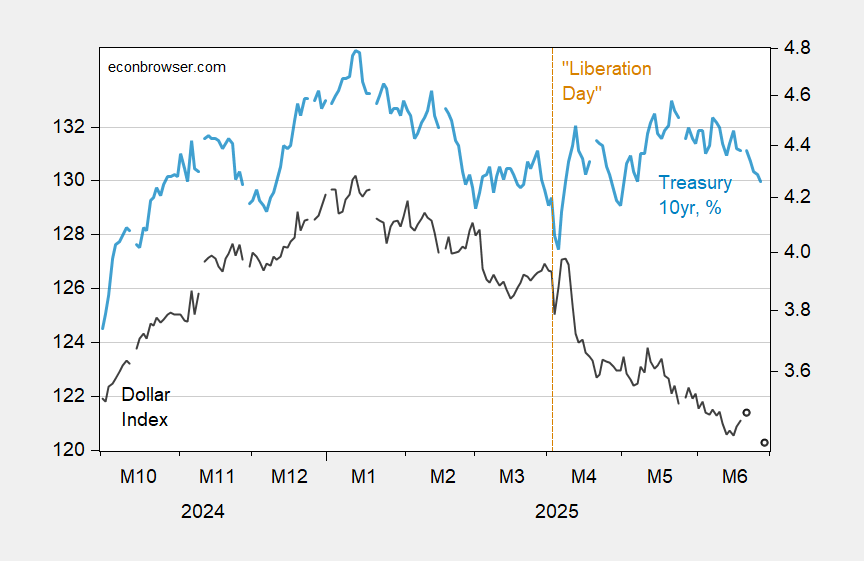
Figure 1: Fed broad dollar index, 2006M01=100 (black, left scale), Treasury 10 year, % (blue, right scale). June 27 observation for nominal dollar is estimated using observation on DXY. Source: Federal Reserve and Treasury.
The dollar has weakened, at certain points when the ten year yield has risen (suggesting an erosion of its safe haven status), and most recently has fallen with falling Treasury yields.
The broad dollar has depreciated about 7.6% from January 20th.
Bussiere, della Chiaie and Peltuonen (2014) estimate the long run pass through at about 0.35 for the United States, over the 1990-2011 period. Results from the earlier 2006 Fed survey, discussed here.
For the PPI for tradable industries, the pass-through estimate is about 0.3 for 2013-20 in Amiti et al. (2022), but 0.7 for 2021, suggesting the pandemic era exhibits different behavior.
For consumer price indices, Mattschke and Sattiraju (2022) argue dollar appreciation/depreciation has very little impact on PCE inflation. Pointing out that only about 10% of a core consumer basket involves imported goods.
This is useful to keep in mind insofar as an appreciating currency will not be offsetting upward price pressure arising from tariffs, in contrast to the 2018 experience. Given this, and an historically high effective tariff rate, the Fed should be concerned about inflationary pressures. (Of course, a sufficiently deep recession, which also seems to be in the Trump game plan, would obviate that worry.)
Okay, this is funny:
“BREAKING: Cuomo has fled the NYC mainland following its fall to socialist Zohran Mandani. Sources say he will form a new government on Staten Island with the goal of eventually reclaiming the entire city. Mandani has promised to purge all remaining Cuomintang on the mainland.”
Just a reminder – we’ve been back on debt-ceiling-watch since January 1, and the latest CBO budget review settled on mid-August as the earliest that default is likely, absent an increase to the debt ceiling.
U.S. Treasury 5-year CDS rates are up a little over 35% over the past 6 months, though down from the late April high:
https://www.worldgovernmentbonds.com/cds-historical-data/united-states/5-years/
That 35% rise probably represents both the possibility of a near-term default due to the debt ceiling and the rising risk of default under the management of the self-proclaimed “king of debt”. The felon-in-chief has, after all, declared bankruptcy – and so defaulted on debt – six times. He has defaulted on wage and other obligations, as well. It’s a habit he can’t seem to break.