There’s an argument being made that because of the zero lower bound, the standard nominal term spread is unlikely to be as accurate a predictor of recessions as it has in the past. A prominent example of this view circulating now is that forwarded by Deutsche Bank’s Dominic Konstam; his analysis indicates a 60% likelihood of recession (WSJ RTE), in contrast to the estimates obtained from the standard model, ranging in the low teens (see for example this post).
Konstam adjusts the term spread by using the residual from the regression of the 10 year-3 month spread on the 3 month rate as a predictor of recessions. This, it’s asserted, removes the bias that comes about from the fact that the short rate has been bound in recent years.
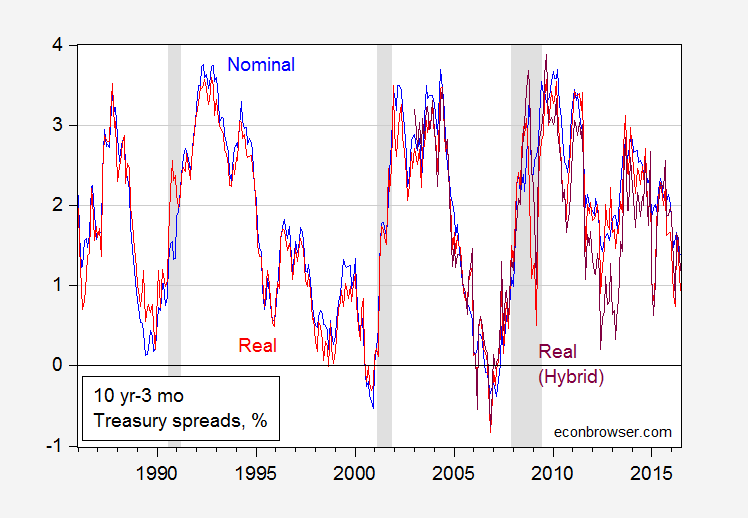
What is true is that the real interest rate, both at short and long horizons, is not bound, so in principle one could examine how the real spread covaries with recessions. Two problems arise: (1) the real rate is unobservable, and (2) for observable proxies for the real rates, the time span is short relative to the number of observed recessions. Consequently, formal analysis is not possible (or, more accurately, not advisable). Still, I think it is of interest to see whether the real spread predates recessions. This is shown in Figure 1.
Figure 1: Nominal ten year (constant maturity) yield minus three month bond yield (secondary market) (blue), nominal ten year minus ten year expected CPI inflation minus three month yield adjusted by one year expected inflation (red), and TIPS ten year minus three month yield adjusted by one year expected inflation (purple). NBER defined recession dates. Source: Treasury yields from FRED, expected inflation from Cleveland Fed, NBER, and author’s calculations.
I’ve plotted the series for the period of the “Great Moderation”; it’s not possible to go much earlier, as the expected inflation series only goes back to 1982.
Observations:
- A yield curve inversion need not precede a recession — in the 1990-91 recession both curves nearly invert, but do not.
- The nominal and real curves have covaried substantially over the entire sample, with some divergence in 2012-13.
- All measures of the 10 year-3 month term spread remain positive.
It would be inadvisable to take too much from these correlations. However, it would seem that an unconstrained measure of the slope of the yield curve is not too different from the constrained version, at the moment (or — more accurately — as of June 2016).
Update, 8/7 1AM Pacific: Peak Trader observes that recessions are usually preceded by elevations in the Fed funds rate, to wit:
Every recession, since WWII was preceded by a substantial increase in the Fed Funds Rate, except the 1990-91 recession, which began a substantial decrease a year or so before the recession after a substantial increase in the mid/late ’80s.
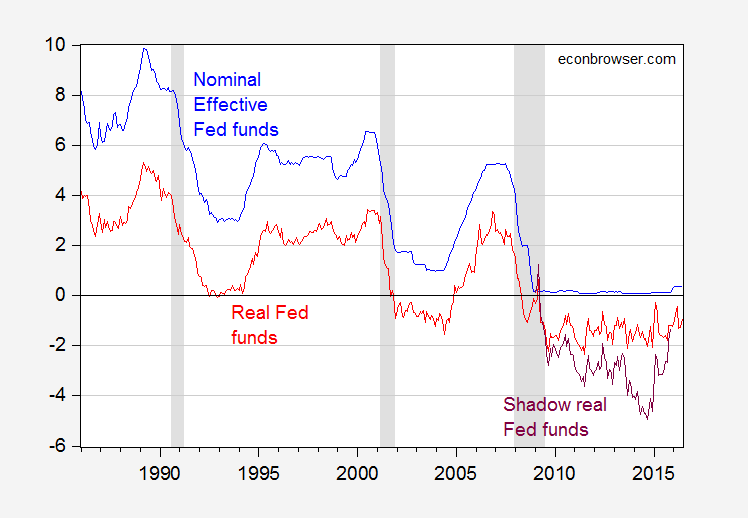
Figure 2 depicts the nominal Fed funds, and two measures of the real, including shadow real Fed funds.
Figure 2: Nominal effective Fed funds rate (blue), nominal Fed funds minus one year expected inflation (red), shadow Fed funds minus one year expected inflation (purple). NBER defined recession dates shaded gray. Source: Fed via FRED, Cleveland Fed, Wu-Xia/Atlanta Fed, NBER, and author’s calculations.
While the change in the nominal Fed funds — and even real Fed funds — should give little cause for concern, the real Wu-Xia shadow Fed funds rate has risen quite precipitously. I would say that this development alone should give pause for thought for those advocating continued monetary tightening. On the other hand, Peak Trader omitted one observation — there was a 2.5 percentage point increase in the Fed funds rate in the 1994-95 period not followed by a recession.


Sorry Menzie, could you clarify? How exactly is Konstam adjusting the 10y3m spread? What residual is he using?
Ernie: My understanding from secondhand sources — I don’t have the study — is that he transforms the spread by using the residual from a regression of spread on short rate. This is supposed to purge the spread of bias due to the ZLB — but I don’t see it.
Every recession, since WWII was preceded by a substantial increase in the Fed Funds Rate, except the 1990-91 recession, which began a substantial decrease a year or so before the recession after a substantial increase in the mid/late ’80s.
This expansion is the fourth longest in U.S. history entering its 85th month. The expansion in the ’60s was 106 months, in the ’80s, it was 92 months, and in the ’90s, it was 120 months.
Never increase the Fed funds rate and you will never have a recession? That was easy.
Actually, you’ll end up with a unnecessarily much worse recession and a steep reduction in living standards.
You can praise the Fed later for working in the future economy preempting inflation and maintaining price stability.
without inflation the real estate market will suffer. the current racket with real estate commissions at 6% hurts real estate, because outside of the bubble years, most appreciation with real estate basically kept up with inflation. but the inflation made the cost of the loans deteriorate with time. the attractiveness of residential real estate is enhanced by inflation. we have seen what happens to the economy when real estate prices stop rising, and especially when they fall. this has been a driver in the feds decision to keep rates low and stoke some inflation.
The Greenspan Fed may have achieved a rare “soft-landing” in 1994-95. I think, the Greenspan Fed did a remarkable job helping to smooth-out business cycles and maximizing growth.
I like regressions, but I see no underpinning economic theory for why a narrowing yield spread occurs before recessions. And why this is true more for the US than other economies. Without at least a causal hypothesis to explain empirical correlations, the speculation doesn’t add much.
Most credit is extended by the lender borrowing on the short end to fund long-term loans. So when the yield curve flattens, lenders restrain credit, causing consumption and investment to decline. But two caveats to the obvious. First, long-term future expectations are rarely so much worse than the near-term than the yield curve inversion is due to falling long-rate. So rising short rates due to the central bank is almost always the cause. Second, is that banks are very slow to raise their deposit rates with Fed Funds rates, so banks don’t tighten most of their lending when the central bank is raising rates.
But in the US, much more credit is from non-bank sources than in other nations. These non-bank lenders have cost of funds that are contractually tied to benchmarks which move very closely to the Fed’s rates (such as repo financing to 30-day LIBOR rate). I have seen nothing that makes me think that non-bank lenders are looking at the ‘real’ yield spread, or care if the spread tightens due to higher short rates versus lower long rates. It is the simple arithmetic of the long investment yield minus the cost of funds. As that spread approaches zero, non-banks stop lending.
Kent: Just to clarify, I didn’t run any regressions; Konstam did.
No theory underpinning the relationship? Better tell Estrella…Here’s his paper, published in the Economic Journal in 2005.
However when looking at the 10-Year Treasury Constant Maturity Rate (DGS10) minus the 3 Month Treasury Constant Maturity Rate (GS3M) on FRED, there is an inversion before 1990. Also a deeper inversion when using the 10-2 spread. Also using the secondary market rate on FRED for the 3-month (DTB3), there does seem to be an inversion in May 1989: https://fred.stlouisfed.org/graph/?g=oGg
Kent: “I see no underpinning economic theory for why a narrowing yield spread occurs before recessions.”
The narrowing spread is not a cause, but a symptom of future recessions. One simple theory is that bond traders are looking at economic indicators and anticipating a slow down of the economy. They are anticipating that the Fed will lower rates in response to the slow down. Therefore bond traders want to lock in current higher rates by buying longer term bonds. Increased demand for long bonds lowers the yield on long bonds which flattens the curve.
This is a quite simple model. It assumes that bond traders have some skill in anticipating future recessions. The empirical evidence suggests this might be the case.
Rising rates before recessions is a natural part of the financial cycle. It means people are reacting to the signal of rising inflation and trying to contain overheating. The central bank, commercial banks and capital markets tend to be tighten at the same time for the same reason. Success is a soft landing or mild recession; failure is letting the overheating going on so long that the effort to contain brings on a financial crisis.
Historically a flattening yield curve is created by short rates rising more than long rates rise.
Normally both rise through most of the flattening cycle — often long rates peak well before short rates peak.
But this time the flattening is being caused more by long yields falling.
I suspect that this difference means that the flattening yield curve does not have the same implication as it has had historically.