Since Friday’s employment release, [1] there’s been a surge in articles discussing the possibility of a recession.
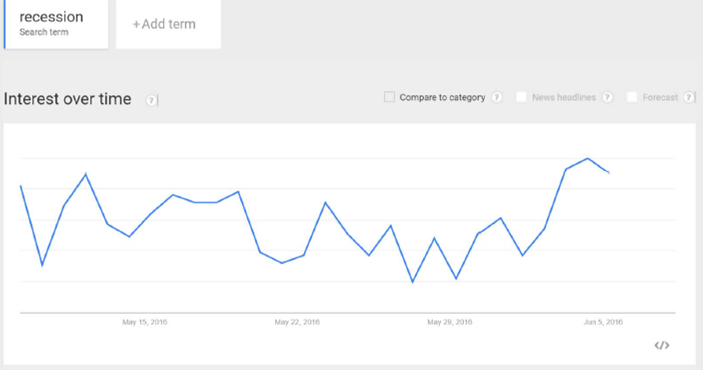
Figure 1: Google Trends index for “Recession”, last 30 days, in Business and Finance category. Source: Google, accessed 6/7, 11PM Pacific.
Time for a look at some key indicators the NBER Business Cycle Dating Committee [1] has looked at in the past.
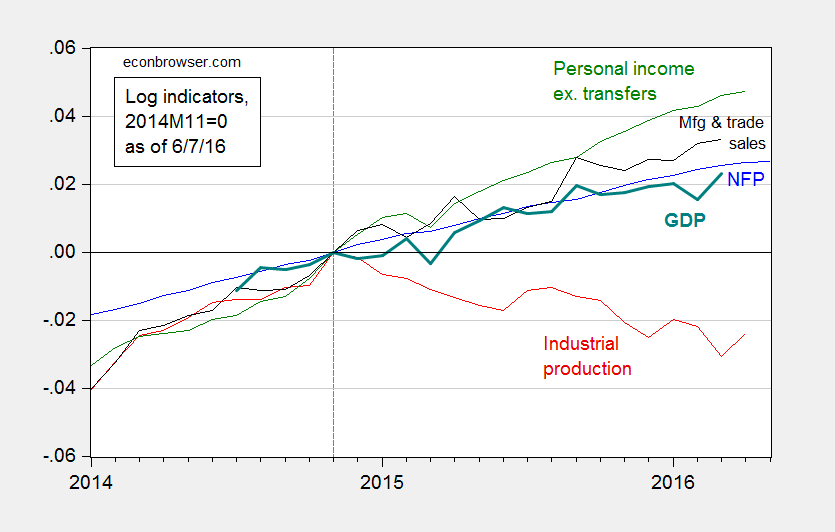
Figure 2: Log nonfarm payroll employment (blue), industrial production (red), personal income excluding transfers, in Ch.2009$ (green), manufacturing and trade sales, in Ch.2009$ (black), and Macroeconomic Advisers monthly GDP series (bold teal). Source: BLS (May release), Federal Reserve (April release), BEA, Macroeconomic Adviser (May 17), and author’s calculations.
While most series are still rising, as of latest reported observations, the decline in industrial production is worrisome. (Employment is rising, but as Justin Fox points out, a principal component measure of the labor market has been declining for a while).
The broadest measure of economic activity is GDP. Figure 3 presents the BEA series, and the Macroeconomic Advisers and e-forecasting monthly series, for comparison.
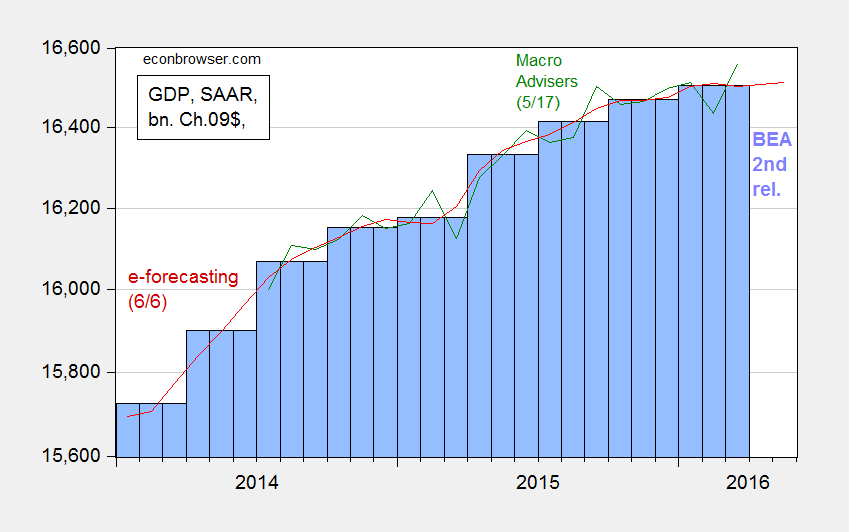
Figure 3: GDP as reported by BEA (blue bars), Macroeconomic Advisers (green line), and e-forecasting (red line), all in billions of Ch.2009$, SAAR. Log scale. Source: BEA (2016Q1 second release), Macroeconomic Advisers (5/17), and e-forecasting (6/6).
What’s obvious here is a flattening out of these series, although Jim’s recession indicator index still fails to call a recession as of the 2016Q1 advance release. Despite the implied acceleration in GDP growth according most nowcasts of 2016Q2 GDP (see Jim’s post), count me worried.
I take some solace in the fact the yield curve has not inverted in the 6 months to one year prior to today, where an inversion of the yield curve has typically been a useful predictor of recessions (see this post, based on Chinn and Kucko (2015)). This point is shown by Figure 4.
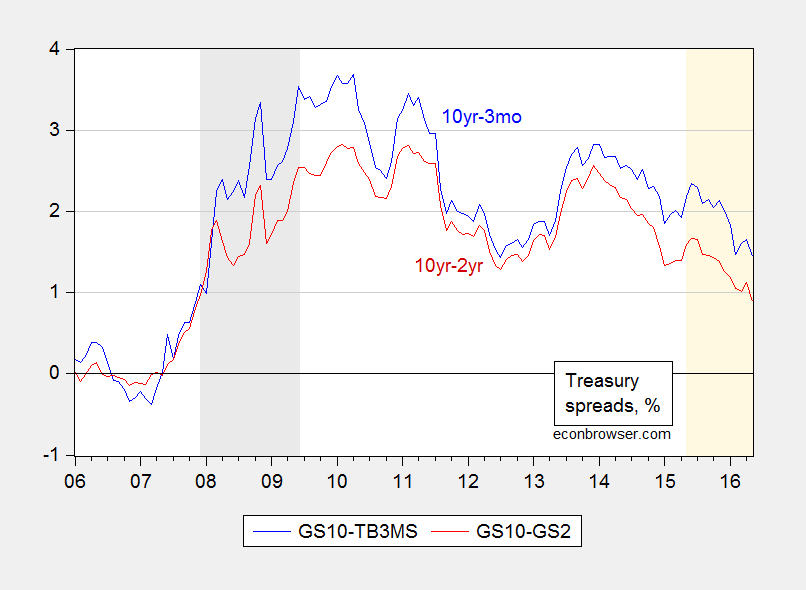
Figure 4: Ten year-three month Treasury spread (blue), and ten year-two year Treasury spread (red), in %. NBER defined recession dates shaded gray. Light tan shaded area pertains to the last year. Source: FRED and author’s calculations.
Note no inversion over the last year, denoted by the light tan shading; of course, the last 8 years has been an atypical period with short rates at the zero lower bound. In these conditions, it’s unclear whether the yield curve remains an accurate predictor given that the spread is being driven by changes in the long rate (see Fatas).
Despite the conflicting nature of the data, now does not seem the time to raise policy rates.
Menzie, I agree with the yield curve inversion point—indeed, it is a commonly relied-on indicator among financial market participants, as our in-house recession probability measures also embed this measure (our preferred best-fit model, however, enters the UST spread with a 12M lag; we use monthly data). Two nuances may be worth noting: (1) During the Jan/Feb recession scare, there was a notable divergence between signals from financial market indicators vs economic indicators. During that period, our probabilities estimated using a multivariate model based on financial indicators spiked as high as 0.49 (before coming down again more recently), while a multivariate model based on economic fundamentals only came up to 0.16 (it has also fallen since); (2) We typically introduce the effects of inversion using the spread on the yield curve. But with the short end of the curve potentially influenced by the ZLB, it is unclear whether we will see inversion this time round even if the curve gets pretty flat (I’ve been told that previous instances of U.S. recessions typically saw inversion from rising short rates as much as, if not more than, falling long ones). That said, the spread (I’m looking at the 10-1) has definitely fallen to levels significantly lower than those reached in Jan this year. It may be interesting to explore whether the ZLB may be a factor in messing up the otherwise reliable yield spread signal.
You need to be careful. The BLS tried out new seasonal adjustment schemes during their one week of monthly “surveyness”. IMO, that led to incorrect figures. Based on a total of non-BLS survey’s, April had 200,000 jobs created and May 120,000 jobs created. This leads toward a average of 160,000, more in line with ADP. While slower than last year, not that slow.
I think the BLS needs to brought to the carpet and apologize. They were outright lazy for handling these untested adjustments.
I looked at the Fed’s Labor Market Conditions Index. It sends a bit worrisome message when viewed in terms of recession probability over 12 months ahead as it rises to 42% in May. I used a probit specification to estimate it. Find the relevant figure in the link below.
Link: http://i.imgur.com/onuwlVp.png
Having worked in the automotive industry, I consider this a leading indicator of recession: http://wardsauto.com/datasheet/us-light-vehicle-sales-summary-may-2016. So, at the moment, I wouldn’t be hitting the panic button. However, there is certainly one sector that is in recession already and that may prove to be a problem in the near future.
The Fed report in May stated: The drop of 2.3 percent for mining in April reflected substantial cutbacks in oil and natural gas extraction as well as reductions in coal mining and in oil and gas well drilling and servicing. The index for coal mining has fallen nearly 40 percent over the past 12 months. The increase of 5.8 percent in the output of utilities was its largest since February 2007, when it leapt 6.2 percent. In April, electric utilities and natural gas utilities expanded 5.4 percent and 9.3 percent, respectively. https://www.federalreserve.gov/releases/g17/current/
Business Investment is Falling Sharply Just as It Did During the Last 3 Recessions
https://research.stlouisfed.org/fred2/series/W790RC1Q027SBEA
As Keynes said: “There is, however, another characteristic of what we call the Trade Cycle which our explanation must cover if it is to be adequate; namely, the phenomenon of the crisis — the fact that the substitution of a downward for an upward tendency often takes place suddenly and violently, whereas there is, as a rule, no such sharp turning-point when an upward is substituted for a downward tendency.
“ANY fluctuation in investment not offset by a corresponding change in the propensity to consume will, of course, result in a fluctuation in employment. Since, therefore, the volume of investment is subject to highly complex influences, it is highly improbable that all fluctuations either in investment itself or in the marginal efficiency of capital will be of a cyclical character. ” The General Theory, p. 314.
Have you guys done any posts or essays on negative interest rates? Strongly feeling like this is the tempest in the teapot of the looming end of the business cycle. Thoughts or places where I should further look?
Specifically worries about the global deflationary spiral which it could potentially be entangled with.
Check out my Damodoran’s post on negative interest rates back in March on his blog. He raises fascinating points. http://people.stern.nyu.edu/adamodar/