For instance, Goldman Sachs presents two forecasts for Q2 growth (SAAR): one for advance, and one for final. As of 7/19, the forecast of the advance release was -29.0%, and final was -33.0% (Seasonally Adjusted at Annual Rates, SAAR). Something to remember when contemplating the near future.
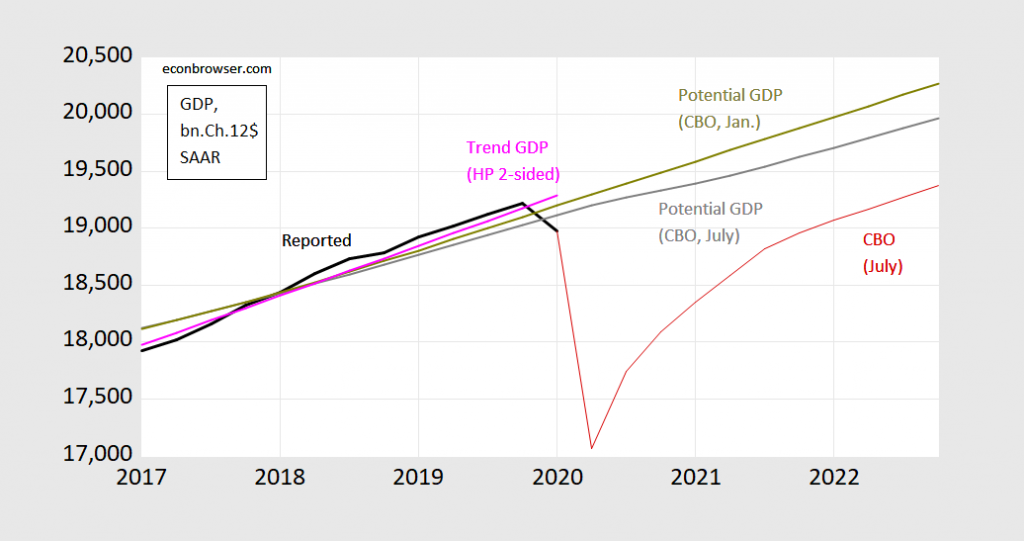
Figure 1: Real GDP (bn Ch.2012$, SAAR) (black line), potential GDP CBO estimate from July 2020 (gray line), from January 2020 (chartreuse line), HP filter (pink line), and CBO July 2020 projection (red line). Source: BEA, GDP 2020Q1 3rd release, and CBO, An Update of the Economic Outlook (July 2020), [data], Budget and Economic Outlook (January 2020), and author’s calculations.
In other words, not only is potential GDP an estimate; so too, to varying degrees, are all the GDP figures associated with each release (advance, 2nd, 3rd). It’s just that usually, the revisions are expected to be relatively small. This is not the case as the recession deepened after Lehman Brothers collapsed, and not the case for 2020Q2.
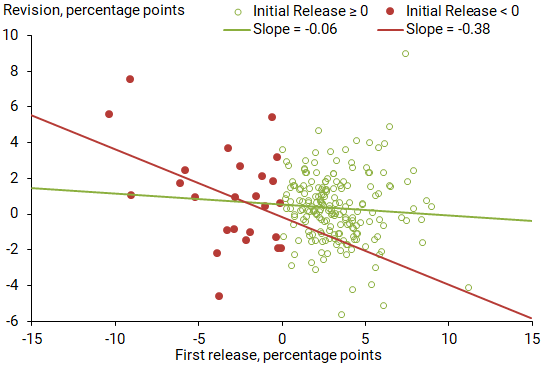
In a recent SF Fed Economic Letter, Òscar Jordà, Noah Kouchekinia, Colton Merrill, and Tatevik Sekhposyan (“The Fog of Numbers”) provide some guidance on what to expect going from the advance release to subsequent, relying upon a familiar macro-relationship, Okun’s Law, which all economics undergrads learn. They show that particularly when the GDP growth rate is negative, revisions are more predictable, as shown below.
However, there is also a relationship to changes in unemployment. As the authors note:
It is generally difficult to predict revisions in real time, partly because any information that one could use to predict revisions is also available to the statistical agencies that are mandated to produce such data. We find this holds true: there is limited scope to improve on the advance release—the BEA does its job very well. However, some economic relationships appear to hold true more precisely with revised data than with the advance release of real GDP growth. One such relationship is Okun’s law, which suggests that real GDP growth will decline about 2 percentage points for each percentage point increase in the unemployment rate.
Our model based on these three components contains useful guidelines for what may happen in the second quarter of 2020 and beyond. We find that changes in the unemployment rate amplify the revision. For every percentage point increase in the unemployment rate in a quarter, the model suggests that GDP growth will eventually be revised down by 1.7 percentage points. On the other hand, a 1 percentage point decline in the advance release of GDP growth is associated with a subsequent ½ percentage point increase of final GDP growth. Thus, these two components pull real GDP growth revisions in opposite directions. Why? The more the advance release of GDP growth diverges from what Okun’s law predicts, the more tension that exists between these two components. The revision will reflect this tension.
In addition, we find robust evidence of seasonality in the revisions. Second quarter revisions are typically positive, amounting to about 1 percentage point increase in the most current vintage of the data relative to the advance estimate. Although our model explains only 16% of the variation for all data revisions, its ability to explain the data more than doubles to about 35% when the advance estimate of real GDP growth is negative.
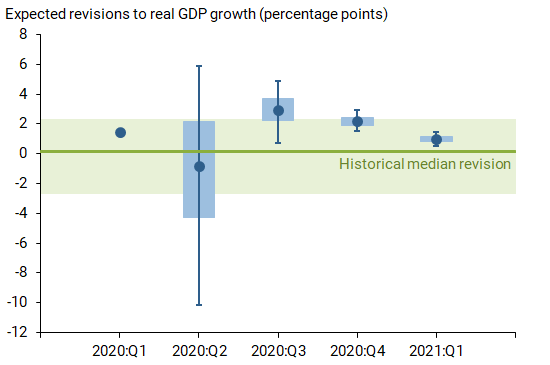
This implies that we should expect revisions of the following sort:
For a discussion of the importance of data revisions, see this 2019 post.


And all of you people thought that donald trump was against government funded health care!?!?!?!?!
https://www.nytimes.com/2020/07/22/upshot/vaccine-coronavirus-government-purchase.html
Damn it, when am I ever gonna get you people to read a little bit?? What a misunderstood mammal the orange creature is. At moments like this, I want to cuddle him and tell him “it’s ok” if he dates his progeny. If we minimize the branching off of and dissemination of bad genes, what harm could it do??
100 million vaccines is far from enough but at $20 a piece, at least we are not breaking the bank. Let’s see – world population is near 7 billion and we likely need 2 vaccines per person so 100 million is only 1.4% of what we need. Only a dimwit like Bruce Hall could make this arithmetic work.
My understanding is that it was specifically for USA citizens usage (or at least we would be at the head of the queue). But I confess I didn’t bother to do the math there. If we took a conservative estimate (conservative on how far the vaccine would stretch) you would have one dose for roughly every 3 and 1/2 Americans?? Maybe if you took “low risk” citizens (under age 18) and those already infected (and therefor assumably immune) and subtracted that out it works out pretty well?? Maybe not perfect but not too bad I don’t think.
As the immune response of older people is much weaker you need around three time more vaccine per person, the 30 million are most likely shots for young people, it could mean that we are actually talking about 3-4 million immunized older people or 10 million younger.
OK – Pfizer made a deal with the US. Did the German partner make its own deal with Germany too?
Here’s my problem with MAGA America 1st deals. Suppose the folks at Oxford come though before this Pfizer research. Does that give the Brits to exclude us from their vaccine? I would hope we would do this on a global scale but Donald Trump does not play well with others.
I’ve been of late citing a lot of the excellent work by Brad Setser (see Econospeak) who is arguing the GILTI aspects of that tax cut for the rich has encouraged us to import biopharma products from abroad than to make them locally. It is interesting argument and Brad’s sources have noted how Pfizer plays this game. Even if Pfizer developed some miracle drug here, the profits magically end up in some tax haven with the jobs sourced to places like Ireland. So much for America 1st.
That not America First, that is the US dealing with a foreign company
“OK – Pfizer made a deal with the US. Did the German partner make its own deal with Germany too?”
My understanding is that the German company BioNTech provides more of the basic know-how while Pfizer provides the production facilities and production related know-how. As the German government is invested in BioNTech, it is a relatively save bet that there is a deal.
Menzie,
for those of us who do not live in the US and use the Seasonally adjusted ANNUAL rate could you also put in what you call the Yr/Yr estimate please.
Not Trampis: When citing other people’s forecasts, I can’t generally do because I have to calculate it (or approximate it – unless they did log-differences for growth rates). I can certainly do it for my forecasts where I have the level of the series.
Another problem, NT, is that the seasonally adjusted part is not clearly obvious how it is done sufficiently to make a correction for what you want, mate.
Than you have useless stats mate.
do you Yanks wonder why no other nation ever use annualised numbers?
It should not be to hard to get the annual rate
It is not hard to get an annualized rate. It is hard to get the seasonally adjusted annualized rate if you are not privy to the formula.
How dare you impugn America’s integrity!!! You act as if 46.1% of Americans elected a complete buffoon to lead our country. Oh wait a second…… Ok, Not Trampis is right, we SUCK. We SUCK bad.
Did I mention America’s McDonalds makes really awesome cheeseburgers??
A cheese burger is not a hamburger!
Why you yanks have an electoral college is a complete mystery to those of us who elect parties on a majority basis!
Perhaps you should have votes on an annualised basis!!
Sorry, Not Trampis, it is easily possible for someone to become PM of OZ, even if the party led by somebody else got more votes than their party did. You live in a parliamentary democracy, and that is in effect like the electoral college: the party getting the most seats can easily have fewer votes in total. Come on. Did you think we are all so ignorant, mate?
And that is not even dragging in the possibility of forming coalition governments, where the person ending up on top could well come from some party that really got very few votes.
BTW, a recent example of somebody ending up on top without getting the most votes in a parliamentary democracy is probably Netanyahu in Israel.
It has happened here.
Israel has proportional voting which makes for absurdly large coalition government.
What idiot came up with the electoral college?
by the way I do agree on SA problems.
Hard to get that correct when this is a 1 in 100 year pandemic!!
and believe it not not I am a fan of yours Barkley
I’m trying to inject some humor into this. Hopefully you’re not being serious. No system is perfect is it?? Haven’t you guys had some hick-ups with your “One Nation Party”?? Get yourself some Cooper’s Sparkling Ale and calm down. Geez I thought I was the bad guy on this blog.
I’m fully open to you poking fun of some of America’s issues, but let’s not pretend Australia has cornered the market on perfection.
Well, at least the Aussies have cleared up that racism problem. Math is still hard for them, though.
If you are ever in LA, try a Fat Burger. Best burger chain on the planet.
Not Trampis, addressing the last part of your question, “the Yr/Yr estimate”, i’ve found that those calling themselves economists have two ways of computing that figure; first, from the end of a given quarter ie, 2019 Q4, to the end of the same quarter in the next year, ie, 2020 Q4, or alternatively (which is the correct way), which would be comparing the entire GDP from one year to the entire GDP from the next…you can imagine with the estimates that we’re now seeing, those two methods would produce dramatically different results, with the first method actually ignoring what has happened to our domestic product over the past few months..
rjs: My experience: from 4th quarter to 4th quarter is q4/q4, and from a quarter x to quarter x in two consecutive years, y/y (unless the data are *annual* in which cases y/y is based on the annual values).
This is an interesting editorial. More questions should be asked about the Justice Department having all the power in an investigation of a president, when that President is the boss and employer/hirer of the leadership of that same Justice Department. It has obviously become a major problem. Now, we know for all the jaw-flapping the GOP does on government power, they won’t weaken presidential powers when we have a Republican president. So, let’s go ahead and “get it done” when we have a Democrat President in Office. Frankly, I don’t see how a President needs to bring in ICE agent Nazi brownshirts into major cities with no warning and no request—maybe the legal requirement might be, that federal agents cannot be sent in without either a Mayor’s or a state Governor’s formalrequest and or BOTH needed to have a formal request, before federal agents can legally be sent in.
https://www.nytimes.com/2020/07/23/opinion/trump-presidential-powers.html?action=click&module=Opinion&pgtype=Homepage
Apparently he is sending a contingent of thugs to Seattle. As a person who lives here, I am baffled about what that will accomplish. There is not much going on here since CHOP disbanded. We have a homeless and vagrant problem, but so does everywhere these days. Are the Trump thugs going to beat up homeless people?
the thugs are sent in for propaganda purposes. trump needs a battle to fire up his base. when the thugs arrest and attack protestors, they fight back. then trump says “see, we need to be here to put down the violent protestors”. it is straight out of the totalitarian playbook. trump has taken on a scorched earth approach between now and the election. he is not worried about how to deal with the post election world. a second round of trump will be the end of the democracy we have enjoyed for the past couple hundred years.
This is very interesting. Menzie is always rightly and correctly referring to “time lag” on here. This is actually a very underrated topic in public policy and in surface level politics. Why?? Because it is very often the case, 98% of the time, that “Joe Six Pack” “Joe Q. Public” does not tie in how economic policy effects him or how it helps him, because of the time lag of policies effects he doesn’t associate in his mind the policy results with the correct specific policy.
https://www.politico.com/news/2020/07/23/gap-unemployment-heres-why-379267
I am wondering how many economists and/or professional forecasters are putting things like this in their models or graphs?? If I was doing ANY kind of national (or arguably even state) economic analysis—I would be trying my damndest to include this in my model. This actually very much ties into Menzie’s post above as it relates to how unemployment moves GDP revisions downward. I don’t dare guess where 3rd quarter GDP is going to fall right now—but I will say this, my guess is most of the 2nd quarter GDP revisions, are apt to be down—maybe not large amounts—but I think they will kick downward.
https://www.washingtonpost.com/national/a-very-dark-feeling-hundreds-camp-out-in-oklahoma-unemployment-lines/2020/07/20/44d59cb6-c77a-11ea-a99f-3bbdffb1af38_story.html
https://www.youtube.com/watch?v=mfNErmpwErw
https://twitter.com/USDOL/status/1286277417972236289
I hear that May consumption numbers were just amazing though. Look those “record” May consumption numbers up. It’ll be something you tell your grandkids about. They may think you’ve gone senile when they see photos of this era, but you tell them it’s a “record” for consumption, see?? You’re “getting this”, I can tell.
The Advance estimate isn’t even an estimate.
This is because the advance estimate does not have all the data in it and thus projections are needed unless you yanks have changed things recently.
Please say you have.
give the advanced ‘estimate away and rely on the next one like we do down under mind you we do have a much better Stats bureau. Indeed we are forutante to have one of the best in the world but have yet to get a monthly CPI. We only have quarterly releases
Not Trampis: Well, for Australia, while the expenditure side of GDP doesn’t estimate guesses, the income side does (due to taxation data). https://www.rba.gov.au/publications/bulletin/2013/mar/2.html
Not Trampis, we now have advance economic indicators published by the census bureau a day before the GDP release which provide close estimates of international trade in goods, wholesale inventories, and retail inventories of the 3rd month of the quarter…durable goods inventories are published during the week before the GDP release, leaving only nondurable goods inventories and 3 construction spending figures of the 3rd month of the quarter subject to BEA “projections”
the big revisions two months out are usually due to personal consumption of services (47% of GDP), because the final quarterly services survey follows two months later…
https://www.calculatedriskblog.com/2020/07/q2-gdp-forecasts-probably-around-35_24.html
as highlighted on calculated risk. 35% annualized rate, or about a 10% decline from Q1. this does not seem unreasonable. there has been a decline from Q1, because we ran much of the quarter without economic concern about the virus. the crash occurred in the last month. in Q2, the crash had already occurred, with some slight recovery from the depths, but the economy basically stayed stalled over the entire quarter, with no really good pops but many continued shutdowns. texas tried to reopen, for instance, but i do not think it was much of an economic success. and since it led to the current exponential spread, probably long term the too early reopening made the economic response to the trump virus even worse.