Typical reporting of overall economic output is based on the expenditure approach — that is measuring spending on final goods and services. There are however three approaches — the income and value added in addition to expenditure — which up to depreciation should be equivalent. What do the expenditure and income approaches indicate?
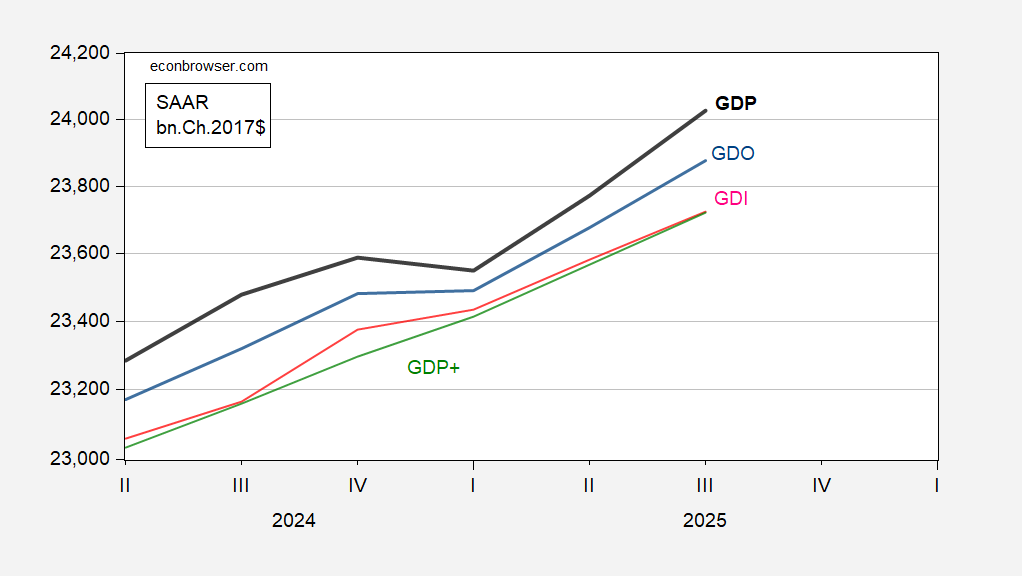
Figure 1: GDP (bold black), GDI (red), GDO (blue), and GDP+ (green), all in bn.Ch.2017$, SAAR. Source: BEA, Philadelphia Fed, and author’s calculations.
Currently, GDP is 1.3% higher than GDI (in log terms). Historically, on average since 1987, the ratio has been 0.3%. That’s using latest vintage data, rather than real time. Rule of thumb is that using the average of the two series (Gross Domestic Output, arithmetic average of GDP and GDI) has proven a better measure of GDP in the sense the revised GDP tends toward initial GDO.
There is also a wide dispersion of estimates for Q4 (i.e., nowcasts) GDP (from expenditure side). GDPNow is at a high of 5.4% q/q AR growth, while St. Louis Fed “News” nowcast is at essentially zero. GS tracking is at 3.4%, and in one note attributed the difference from GDPNow estimate to, in part, the fact that drag from the government shutdown is not directly incorporated in the latter. The NY Fed nowcast is close to GS tracking, where the NY Fed is a top down process vs. Atlanta Fed’s bottom up approach. (Forecast dispersion in the January WSJ economic survey is discussed in this post.)
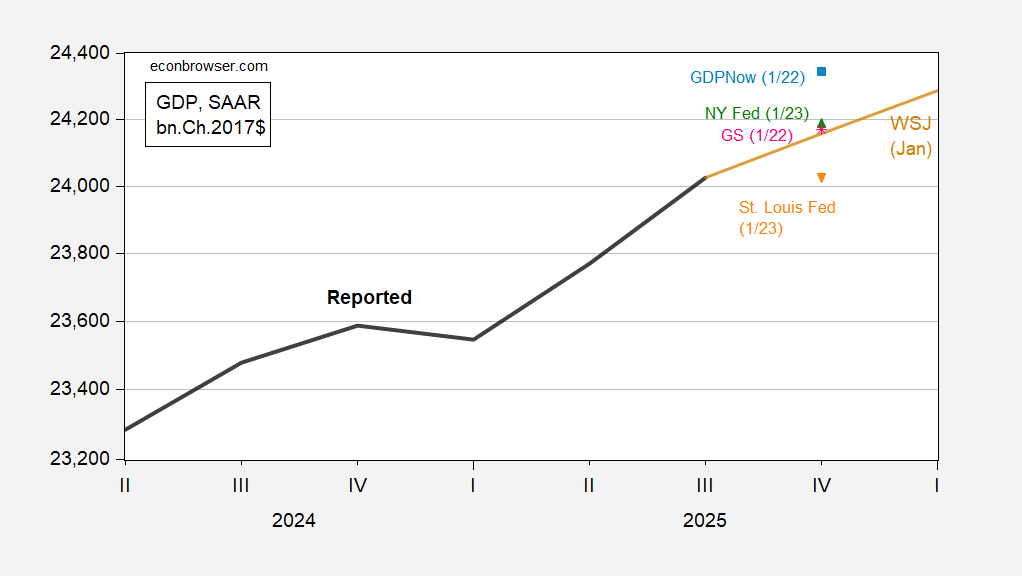
Figure 2: GDP (bold black), GDPNow of 1/22 (light blue square), NY Fed of 1/23 (green triangle), GS tracking of 1/22 (pink*), St. Louis Fed of 1/23 (orange inverted triangle), and WSJ January mean forecast (brown line), all in bn.Ch.2017$ SAAR. Source: BEA, Atlanta Fed, NY Fed, Goldman Sachs, St. Louis Fed, January WSJ economic survey, and author’s calculations.
Finally, where are we going? A popular indicator proxying for aggregate demand* is final sales to private domestic purchasers, a.k.a. “core GDP”. This is a much smoother series, with Q4 q/q AR growth nearly a percentage point and a half below that of GDP: 3.0% vs 4.4%.
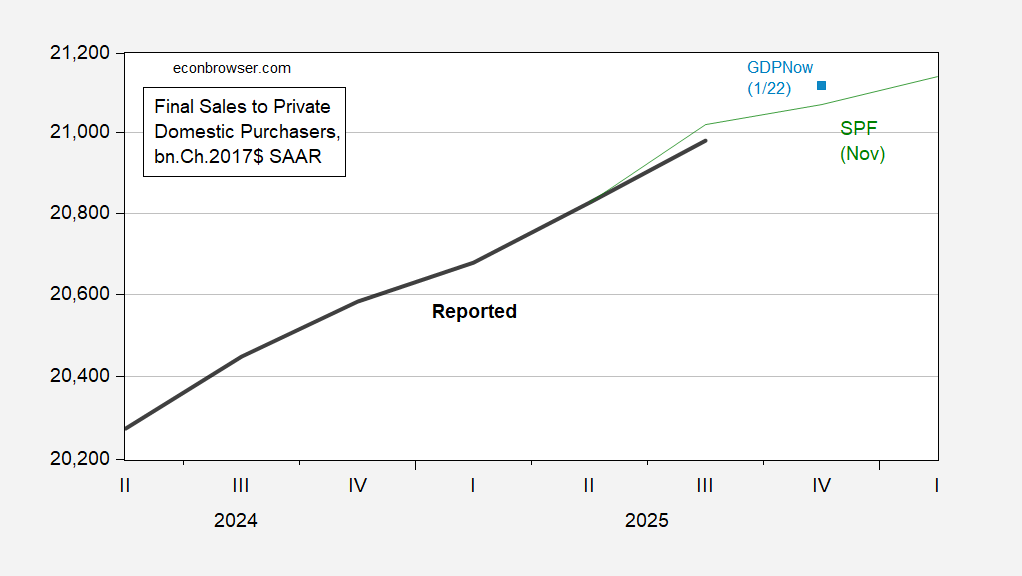
Figure 3: Final sales to private domestic purchasers (bold black), forecast from November Survey of Professional Forecasters (green), and GDPNow of 1/22 (light blue square), all in bn.Ch.2017$ SAAR. Source: BEA, Atlanta Fed, Philadelphia Fed, and author’s calculations.
Nowcasted “core GDP” growth for Q4 is 2.6%, which compares unfavorably to the 5.4% for GDP (but is still a respectable pace, not consistent with recession).
* In the simple Keynesian Cross model, aggregate demand need not equal income ( = GDP) except in equilibrium. Then in principal final sales equals GDP (i.e., no unintended inventory accumulation). Final sales to private domestic purchasers takes that idea, and strips out foreign demand/supply, and government spending activities, so in principle one has aggregate demand on the part of domestic agents.
On a related topic, how is China doing?
China is hinting at a 4.5% to 5% target range for growth this year, after reporting that the 2025 target of 5% was achieved. The official announcement of the 2026 target is due in March:
https://www.scmp.com/economy/economic-indicators/article/3340889/china-set-gdp-growth-range-providing-policy-flexibility-2026-sources
The report of 2025 GDP results included data for Q4, which shows a slowing to 4.5% growth; a weak year-end base is part of the problem for 2026:
https://www.scmp.com/economy/economic-indicators/article/3340360/chinas-gdp-rises-5-2025-us-trade-war-fails-knock-economy-course?module=top_story&pgtype=homepage?module=inline&pgtype=article
The IMF recently raised its estimate for Chinese growth to 4.5%, citing reduced trade tensions with the U.S.:
https://www.scmp.com/economy/china-economy/article/3340419/imf-raises-chinas-2026-growth-forecast-45-citing-us-truce-and-stimulus-roll-out
The IMF cannot deviate much from China’s own estimate, but wlis shading to the low end of China’s official range before China releases its new target. (Notice that the felon-in-chief turned his anger on Canada, but not China, in response to the new trade opening between the two countries, good for our autocratic adversary, but not for our democratic allie.)
China’s population decline accelerated in 2025, helping to account for slower output growth. Marriages hit a record low in 2024, but picked up in 2025, so the population drop may slow, but that wouldn’t do much for the work-age population for some years. In the longer term, China’s population is expected to fall by a third to a half by 2100. Ya can’t fight demographics:
https://www.populationpyramid.net/china/2050/
By the way, there is always a question about the reliability of China’s economic data. Some like it:
https://www.federalreserve.gov/econres/notes/feds-notes/is-china-really-growing-at-5-percent-20250606.html
Some don’t:
https://rhg.com/research/after-the-fall-chinas-economy-in-2025/