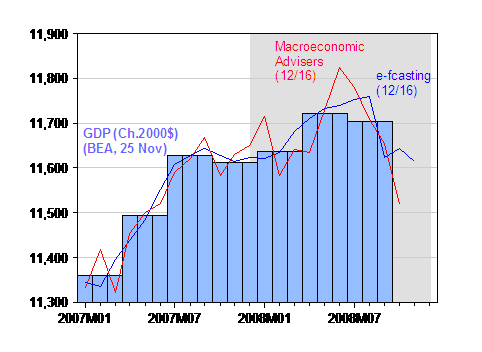
High frequency estimates are falling, while consensus forecasts are for a turnaround in 2009H2. First, consider two estimates of GDP released today.

Figure 1: GDP (light blue bars), GDP from e-forecasting, 12/16 (blue), and from Macroeconomic Advisers 12/16 (red) in Ch.2000$, SAAR. NBER defined recession dates shaded gray (assuming recession has not ended by 2008M12). Source: BEA, GDP release of 25 November, e-forecasting 12/16 and Macroeconomic Advisers [xls] 12/16 release.
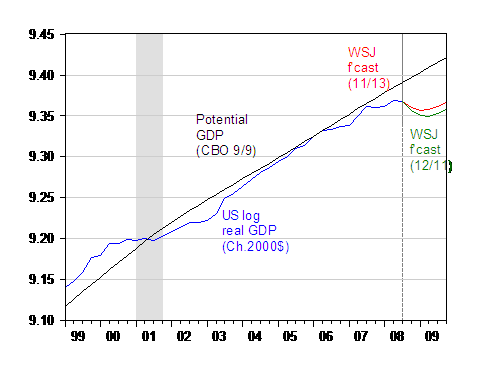
The WSJ forecast consensus suggests substantial declines in output continuing through the second quarter of 2008.

Figure 2: Log real GDP, from 25 Nov 08 preliminary release (blue), potential GDP (black), WSJ mean forecast from November survey (red), from December survey (green). Source: BEA NIPA releases [link], CBO estimates of 9 Sep 08 [xls], WSJ survey of forecasters from October and November [link].
Notice that the trajectory has shifted downward since last month’s survey. My guess would be further downshifting next month, given that we’ve had no good news regarding output indicators, either of a contemporaneous nature (manufacturing output) or leading (purchasing managers indices, etc.).
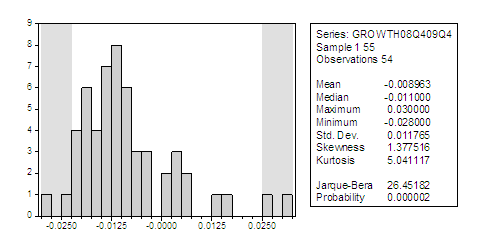
There is, interestingly, a considerable skew in distribution of forecasts. The trajectory of GDP under the mean forecast for the five quarters growth 08q4-09q4 is very similar to the trajectory implied by the high estimate (after removing the two regularly “high” forecasts of MacroEcon Global Advisers and Parsec Financial Management), while the trajectory implied by the low estimate (after removing the two lowest forecasts) is substantially below the mean trajectory (implying an 8.2 ppts of GDP output gap, rather than the 6.4 ppts. implied by the mean forecast). This phenomenon is shown by the skew in the histogram of 08q4-09q4 growth (this is not q4/q4 growth, since 08q4 growth is included).

Figure 3: Histograms for forecasts for 2008q4 through 2009q4 from December survey. Shaded area denotes excluded forecasts for discussion of hi/lo forecasts. Source: WSJ survey of forecasters December [link].
Note the mean growth rate of -0.9% (SAAR) is above the -1.1% median growth rate…
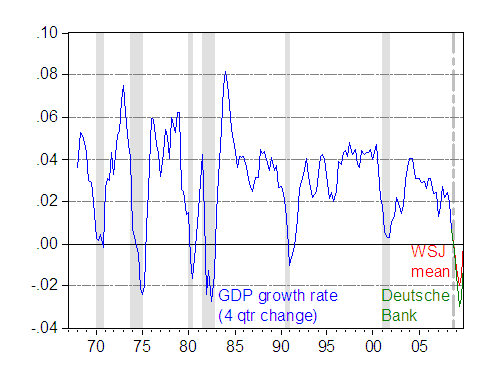
A Digression: I was recently talking to a reporter who asked me how this recession would compare to previous ones, and specifically whether it’d be worse than the 1981-82 one. That spurred me to check how the forecasted changes in output would compare to the past. Well, the mean (not median) forecast would say it’ll be the worst since 1981-82. The Deutsche Bank forecast (which is not the most pessimistic, but rather the 13th from bottom in 55) would say it looks like the worst since 1957 (and vying for top position in the post war period).

Figure 4: Growth rate of real GDP (Ch.2000$) (blue), mean WSJ Dec. forecast (red), and DeutscheBank forecast of 8 Dec. (green), calculated as 4 quarter change in log levels. NBER defined recession dates shaded gray. Shaded gray dashed line is the start date for last NBER-defined peak. Source: BEA GDP release of 25 Nov., [link], Deutsche Bank, Global Economic Perspectives, 8 Dec. 2008, and author’s calculations.
I’m curious. What type of stimulus package do these forecasts presume? Is that an important source of difference among them?
Don: All these forecasts are conditional upon forecaster expectations regarding the likely stimulus package. However, variation along this dimension should have little impact on the short horizon forecasts (08Q4 and 09Q1). I suspect the greatest variation in even in the longer horizon forecasts regards the strength of the monetary stimulus, how the financial system reacts to Fed interventions to unfreeze the credit markets, the impact of further writedowns on bank behavior, and how the rest-of-the-world economy evolves, rather than the stimulus package.
Thanks, Menzie. For what it’s worth (2 cents?), here are my own forecasts, without benefit of any formal model. The short run result will depend on the timing and size of the stimulus package and the extent of the current account leakage. If the trade deficit does not close materially, the stimulus will provide only a very short term benefit and we will end up in worse straights than we are now, only with a bigger foreign debt. Based on a prompt stimulus package of $800 billion or more and my best guess as to the response of the external balance, the economy will appear to recover somewhat this summer, but this time next year, it will be on its way down again. If the deficit improves, Europe (and especially Germany) will suffer a bigger downturn than the U.S. If the external leakage is egregious, Congress will take action and China’s economy will suffer more than apace relative to Europe or the U.S.
BTW, my U.S. (informal) dollar forecast was a very close relative to the model you presented awhile back.