The economy is slowly improving.
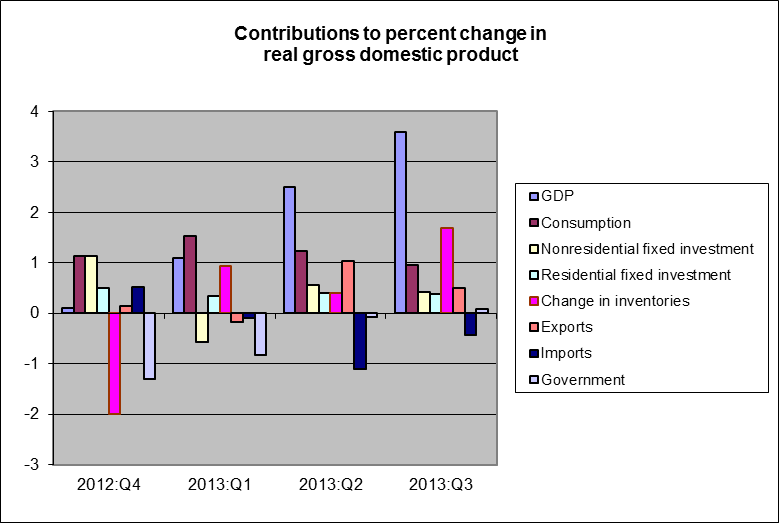
On Thursday the BEA announced its revised estimate of U.S. real GDP. The initial estimate had been that the economy grew at a 2.8% annual rate in Q3, but that has now been revised up to 3.6%. Unfortunately, most of the gain came in the form of more inventory accumulation. Fourth-quarter production was higher than originally estimated, but final sales are now claimed to have grown at only a 1.9% annual rate, a little weaker than the original 2.0% estimate.
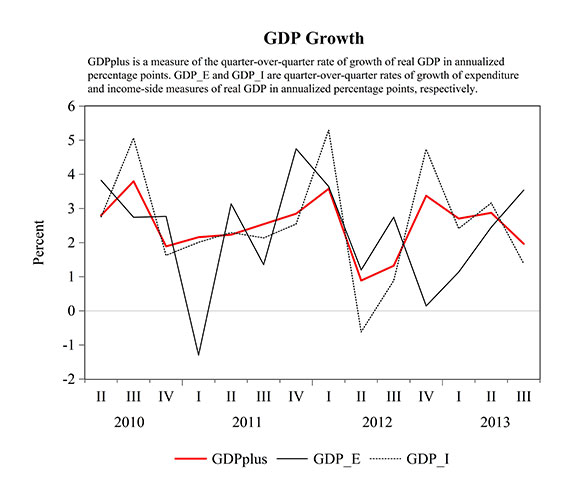
Moreover, the added detail in the new release gives us the first look at a second way to estimate overall growth. We usually calculate GDP by adding up expenditures on all domestically produced final goods and services. In principle, we should be able to arrive at the same magnitude by adding up the incomes earned by all Americans. In practice, when the BEA collects data from different sources, the estimates turn out to be different, and the difference between the expenditure-based estimate and the income-based estimate is simply described as a “statistical discrepancy.” Since we don’t have a good theory for what the statistical discrepancy represents, it’s a good idea to look at both measures. While the expenditures-based measure (the one officially reported) registered real GDP growth of 3.6%, the income-based measure suggests growth was in fact only 1.4%.
One approach is simply to use an average of the two estimates, namely, to conclude that GDP (even including the inventory accumulation) only grew by 2.5% during the third quarter. Some new research by Aruoba, Diebold, Nalewaik, Schorfheide, and Song (2013) proposes something a little more sophisticated. Their inference of true GDP growth (which they call “GDPplus”) is plotted as the red line in the graph below. This tends to track the income-based GDP measure (dotted line) more closely than the expenditure-based measure (solid line), and estimates U.S. real GDP growth to have been about 2.0% for Q3.
 |
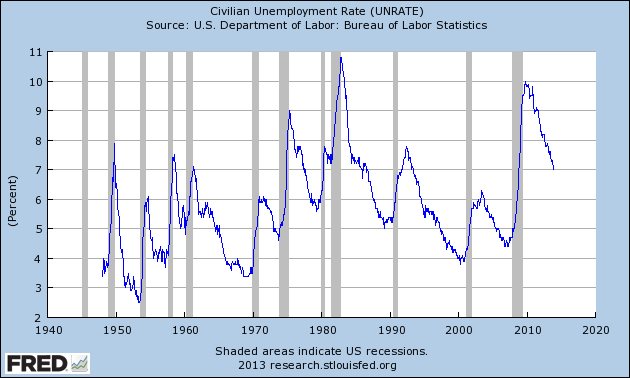
Despite the sluggish growth of real final sales, the labor market continues to improve. The Bureau of Labor Statistics reported on Friday that nonfarm establishments added 203,000 workers on a seasonally adjusted basis in November, and have averaged almost as much over the last year. Job growth was enough to bring the estimated unemployment rate (based on the BLS’s separate survey of households) down to 7.0%. While still quite high by historical standards, a 7% unemployment rate is back within the range of values that have characterized other extended episodes in recent U.S. history. For example, unemployment was 7% or higher from December 1974 through June 1977 (a period when the year-over-year PCE inflation rate averaged 7.0%) and also from May 1980 to December 1985 (with an average inflation rate of 5.5%). There is nevertheless clearly still a lot of slack in the U.S. economy, with PCE inflation over the last year of only 0.7%.
 |
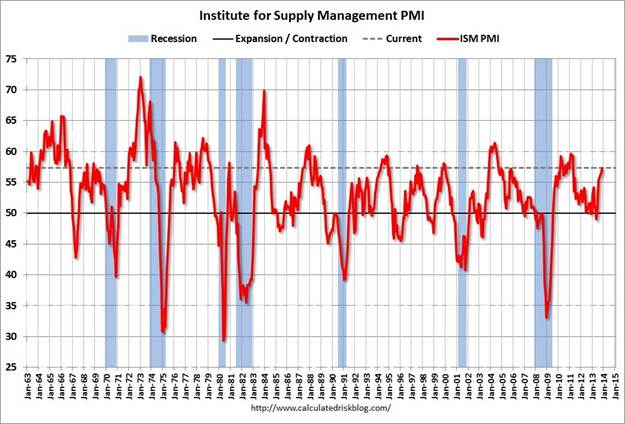
But there have been some other indicators that are unambiguously positive. The Institute for Supply Management released a value for their manufacturing PMI that was up to 57.3, an unusually high value for that indicator indicating widespread reports of improving business conditions.
 |
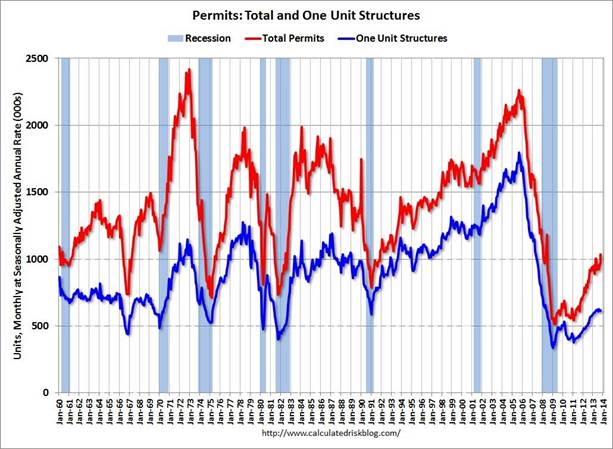
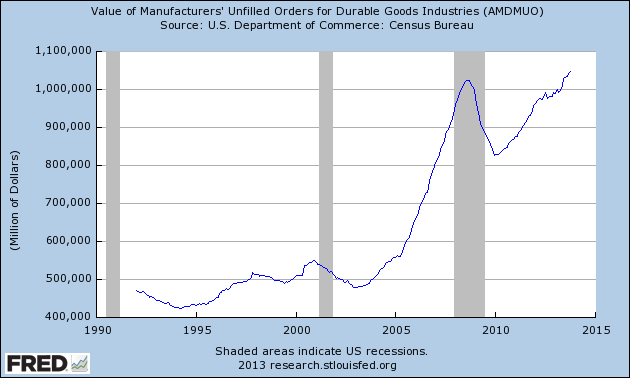
The most recent data on new housing permits and unfilled orders for new durable goods also paint a picture of a recovery that continues to gain momentum.
 |
 |
To sum up, the true growth rate of the U.S. economy was probably less than 3% for the third quarter, but could turn out to be above 3% for the fourth quarter.
Thank you. That was one heck of a mathematical paper!
I became increasingly annoyed at the Philadelphia Fed because when you try to compare GDP+ to other measures over time you get stuck with links to just GDP+, etc. That’s not what people want to see. So it’s really interesting to look at other advanced stats – like in baseball, WAR, UZR, etc. – but they don’t mean much if you can’t say this is what that means by comparison to past estimates.
JDH “…most of the gain came in the form of more inventory accumulation.”
and then further down:
“The Institute for Supply Management released a value for their manufacturing PMI that was up to 57.3, an unusually high value for that indicator indicating widespread reports of improving business conditions.”
Taken together, don’t those two statements suggest that businesses are overly optimistic about economic conditions? I would have thought an improving ISM index value coupled with unexpected decreases in inventories would have signaled improving economic conditions. No?
Upvoting 2slugbaits question. I’m curious about that too.
I’m with 2slugbaits too.
printing 85.5 billion a month can buy a hell of a “recovery”
On the labor market – I’m stuck on the fact the employment/population ratio is still only at its level reached in October 2009: 58.6%. Yes – the unemployment rate is down to 7% but note that the labor force participation ratio is also down to 63%. If this is labor market improvements, it is glacially slow.
US GDP growth was uprated to 3.6% in Q3. (Once again we see huge revisions from the initial estimates, in this case of 2.8%, suggesting the whole reporting system is essentially worthless.)
http://www.forbes.com/sites/maggiemcgrath/2013/12/05/us-economy-growing-faster-than-previously-thought/
Growth of 3.6% is by no means modest–if we believed it as fundamentally true and sustainable, it would suggest a pretty robust economy.
For the last four weeks, US product supplied (oil consumption) is up 5.6%. Oil consumption is normally a coincident indicator for GDP. If we assume that oil consumption rises at a pace of 0.6x GDP growth, then oil consumption alone would suggest GDP growth of nearly 10% in Q3. This, of course, is absurdly high, but product supplied does suggest a quite strong Q4 or Q1, as I had earlier stated. As a result, inventory build may be associated with an anticipation for increased sales for the current or next quarter.
You can find weekly product supplied (‘Total’ line) here: http://www.eia.gov/dnav/pet/pet_cons_wpsup_k_w.htm
2sb’s point is valid (I think I made the same point in the last post on Q3 GDP).
It could still be a good thing though, if the inventories drive down certain prices and therefor drive up the buying and savings capabitiliy of certain income groups. If profit margins are high, prices can come down without too much cost. Maybe the inventory build up is happening because prices aren’t coming down as fast as they should. Maybe prices haven’t come down enough because companies are testing elasticity of demand and don’t want to miss out on high marginal profits.
Equilibrium inventory investment this expansion is running $50 billion (annual rate in constant dollars). This is a rock solid number as these things go, quite in line with the average level of inventory investment in the prior expansion of $48 billion. In Q3, inventory investment surged to $116.5 billion. The actual flow must, and always does, realign with the desired flow. Only the timing is in question. $66.5 must be worked off for actual to realign with desired. A one percentage point increase in real GDP is $158 billion, or $40 billion per quarter. Spread evenly over the next four quarters, this amounts to 4/10ths of percentage point reduction in real GDP growth. Were the adjustment to take place in two quarters, it would knock 8/10ths off the headline GDP number in Q4 and Q1. Generally, the adjustment is front-loaded, and tapers over the course of a few quarters until actual and desired realign.
Real final sales (GDP=final sales plus inventory) rose 1.6% over the last four quarters. A fair number for underlying growth is more on the order of 2%. Though this is below the 2.3% during 2011 and 2012, the expansion is getting long in the tooth. It is not easy for overall growth to get far out of line with consumer spending. Given the ongoing need for household deleveraging, at best consumers can’t spend much more than the increment to disposable income. Real disposable income is rising 1.8%. Round this up to 2%. This is the core number from which inventory adjustment will take its toll. Hence, plus or minus 2% overall growth is the expectation for the next few quarters. Plus or minus 3% per the consensus is highly unlikely.
Steven,
A few days ago, the WSJ had an article that analyzed the weekly US (liquids) product supplied numbers versus annual numbers. The reporter noted a growing gap between the two data sets (weekly being higher), and the reporter wondered if this might be due to underestimating product exports. I tried and failed to find a link to the article.
In any case, someone recently pointed out the recent sharp decline in Louisiana’s natural gas production numbers, and I thought that the combined Texas + Louisiana year over year change in gas production was interesting (see info below).
As I have mentioned before, Citi Research estimates that current US natural gas production is declining at about 24%/year (this would be the year over year decline in US natural gas production if no new wells were completed in 2014). This implies that we need about 17 BCF/day of new gas production every year, just to maintain current production. Or, over a 10 year period we would need to put on line a total of 170 BCF/day of new production, just to maintain current production.
Overall US natural gas production has basically been flat since late 2011, but we have seen some material regional declines, e.g., combined Texas + Louisiana marketed gas production fell by 6% from August, 2012 to August, 2013 (EIA).
Based on the Citi estimate, the industry would have to replace the current gas production from all of Texas + Louisiana times six, over the next 10 years, just to maintain current US natural gas production. In other words, Citi Research estimates that we need to put on line the productive equivalent of all of Texas + Louisiana gas production about every 19 months or so, just to maintain current gas production.
The economy may be doing better, but the improvement is to a significant extent enabled by extremely low interest rates. Even oil production is enabled by the very low interest rates, because oil producers can borrow cheaply, and because demand is held up by the low interest rates keeping the monthly payments on cars and homes low. I am seriously worried about what happens when interest rates rise–quite possibly as QE is tapered down, or if the US should not be able to agree on a budget enters shutdown again.
If interest rates rise, I think the direction of oil prices is down, as is oil production. See my post http://ourfiniteworld.com/2013/11/15/whats-ahead-lower-oil-prices-despite-higher-extraction-cost/
JBH and all,
The yoy rate of real final sales per capita has grown at just 0.8-0.9% for three consecutive quarters, which historically has coincided with recessions; but this rate is now the post-2000 avg. trend rate vs. ~0% for the post-2007 rate.
IOW, the 13-year trend of ~0.8% annualized is the norm, which is historically recessionary.
Imports (trade) are (is) recessionary.
The yoy real change of non-residential investment less private employment has rapidly decelerated to, or below, real final sales per capita, which has historically occurred prior to, or at the onset of, recessions and the bottoming of the U rate.
I can hear it now, economists claiming that the US is steadily growing with low inflation, improving labor conditions, and soaring profits. They will leave out the bit about 6 million workers leaving the labor force causing the U rate to fall from 11% to 7%.
Inflation is decelerating because debt service, high structural unemployment, high energy costs, and no real wage gains are significantly restraining final demand and the ability for firms to raise prices.
The “steady growth” is only “growth” if one compares the rate to the standard in the debt-deflationary regimes of the 1930s-40s, 1880s-90s, 1830s-40s, and Japan since 1998.
Record profits to GDP have been driven primarily by lack of net employment and wage gains, soaring deficits to GDP (gov’t and household dissavings), a massive increase in corporate borrowing to buy back shares, and the central bank printing hundreds of billions of dollars’ worth of bank balance sheet profits at a record share of GDP.
None of these conditions is “normal” nor sustainable.
Stock prices are again discounting 3-4% real GDP growth and profits out to 2023-25, not unlike in 2007 and 2000, only the economy is structurally weaker today than 6 and 13 years ago.
Will “Equilibrium inventory investment” have a marginal impact on Accelerating Inventory?
Bruce, I don’t think we’re worse structurally than we were 6 years ago. A lot of private sector debt has been written off and refinanced.
(We probably don’t have to worry about public interest rates because higher rates would bankrupt us and crash the economy, demanding lower interest rates.)
Around 95% of the Bush tax cuts were made permanent and the Republican House has restrained spending so that it is down for the first time in years. Were it not for the huge wedges put in place by the Obama administration, such as the Democrat Socialized Medicine plan and the massive crony capitaliam, the economy would be booming.
The size of the variance in product supplied suggests to me that it’s probably for real. Misplacing 1 mbpd is a pretty large amount, but don’t let me vouch for the reliability of EIA data.
In natural gas, the Marcellus has shown some real strength in production growth recently, and operators are reporting considerable enthusiasm for the still-nascent Utica as well. Meanwhile we see on-going production declines in the (unconventional) Haynesville, the Gulf of Mexico, and conventional onshore. Current natural gas prices are insufficient to maintain gas production beyond the Marcellus and the associated gas plays in the Permian and Eagle Ford.
Gail –
It’s hard to make sense of the claim that as costs rise (interest rates go up), oil production declines and oil prices decline. This would produce a quite tortured looking supply-demand curve, I think.
Personally, I am of the view that the US, at a minimum, appears to be toggling back into price inelastic demand mode (we need another 60 days’ data to make that statement a bit more firm), and I think we could see a bit of a bidding war for oil by end Q1 to end Q2 2014. Chinese demand has been all but moribund, but I think the Chinese economy will be stronger by mid-2014. (I personally think it’s been in a slump since Q1 2013.) Thus, if the US consumer is willing to fight to hold oil consumption, and the Chinese are demanding substantially more, then I think we could see a significant rally in oil prices in the March to July time frame.
By the way, congratulations on the interview in Zero Hedge.
Steve, you know anythig about the likely impacts of the big Australian find?
Never mind Steve, I see that it’s actually old news.
@aaron: “I don’t think we’re worse structurally than we were 6 years ago. A lot of private sector debt has been written off and refinanced.”
aaron, non-financial corporate debt to GDP is at a secular record high, a growing share of debt added in the past two years to buy back shares to reduce float and pad earnings/share, which occurred in 1999-2000 and 2006-07. The interdependency of financial and non-financial corporate debt as a share of GDP is not unlike in the 1830s-40s (state banks and canals), 1880s-90s (banks and railroads), late 1920s (banks and utility and industrial firms), and Japan in the 1980s (banks, insurers, and industrial firms).
The result is an unprecedented GLOBAL debt/asset bubble, which implies that structural risks are higher than in 2007-08, and at any time in history.
Jeffrey –
In today’s STEO, US oil consumption is up 3.1% in the last three months compared to the same period a year ago. For the last month, the number is 400 kpbd versus 1064 kbpd in the Product Supplied report.
That’s a big discrepancy, and I don’t know the reason.
Notwithstanding, a 3.1% gain is a big number. US oil consumption is growing in volume terms twice as fast as Chinese consumption.
Bruce: In discussing economic growth, the conventional number is real GDP. Not per capita. Converting to per capita adds little to the discussion. Were we talking levels over a long period of time, per capita would be far more germane. My numbers and yours converted to per capita are basically equivalent in terms of informational content regarding growth.
It is evident from context that I am referring to expansions. I do so for a very important reason – because we are in one. It would misconstrue rather than clarify to take, say, the last decade’s growth and make comparisons to explain what is going to happen the next year or two. Real GDP grew 1.7% over the past 10 years through last quarter. In the current expansion from 2009:2, growth has been 2.3%. For the purpose of understanding what is going on right now, that 2.3% is a better starting point. Taking growth over the last 3 quarters borders on cherry picking, which is frowned on in scientific circles, in the boardroom, and is all too common on this website.
Your 13-year trend (2000:3 to 2013:3) runs from what is virtually a business cycle peak to a mid or late-expansion endpoint. It includes two recessions. Only part of one expansion. And the deepest recession since the 30s. Annualized growth over your time frame of 1.8% is then biased by your choice of time frame. Were you to approach it in a different way, for example, and state that trend growth is falling at the rate of 4/10ths of a percentage point per decade, I would have no objection. However, the annualized drop in trend is so small it is not important for the next year or so, the horizon I was addressing. While 0.8% (per capita) or 1.8% (full) may be a reasonable estimate for the trend going forward – because the long-term drift is indeed downward according to the data – that hardly makes it “recessionary.” While flying at a low altitude makes it easier for a shock to cause the plane to crash (economy to dip into recession), there are strong papers in the literature counter to the view that low-flying necessarily equates to “recessionary.” That low growth in the final year of an expansion can and has preceded recessions is a fact. But low growth is neither necessary nor sufficient. Year-over-year real GDP growth was 2% or less in 2011:1, 2011:2, and 2011:3 with no recession following. Similarly a couple quarters during the prior expansion.
There is a richer thing going on beneath the surface. When the economy has been blasting along at 4%, imbalances build up. Historically, these have been accompanied by inflation which induces Fed tightening which induces further slowing and an eventual recession. This standard pattern is not on the surface evident in the aggregates today. In other words, current period yoy growth is no good predictor of recession unless embedded in a context of underlying structure, increasing imbalances, and something endogenous to trigger the imbalances to unwind (e.g. yield curve inversion). The current inventory imbalance will unwind naturally, and degrade growth for a time going forward. That was the point of my post. But the unwinding of inventory does not of itself imply recession.
I do not comprehend “non-residential investment less employment.” This is a new concept. (When introducing such a thing, normal procedure is to give a bit of explanation before proceeding.) Always willing to learn something, I looked at the data. First, yoy real non-residential investment had this pattern at business cycle peaks: 7.2% in 1973:4, 4.0% in 1979:4, 3.1% and accelerating rapidly in 1981:3, -1.4% in 1990:2, 5% in 2000:4, and 5.1% at the recent peak. Plant and equipment is “never” a predictor of recession . Which of course is well known to business cycle analysts. For these same cycle peaks, real non-residential investment (yoy %) minus private sector payroll employment (yoy %) was: 3.2%, 1.3%, 1.5%, -2.8%, 3.6%, and 4.3%. So, neither is this strange variable a predictor. Now, in your statement you compared this variable to real final sales per capita . What per capita has to do with anything I do not know. But making that comparison, here is real final sales per capita (yoy %) at these peaks: 1.9%, 0.9%, 0.8%, 1.4%, 1.7%, and 1.1%. At only one cycle peak has investment less employment growth been below per capita final sales growth!
There is a reason for this. It has to do with time. Investment is future oriented and has momentum until present-oriented consumer spending collapses. Then only belatedly dragging investment down with it.
Steady growth is steady growth. The exact empirical number may and will change over long stretches of time as underlying structural change take place. Steady growth may have been 3 percent a couple decades ago, and 2% today. No argument there. I believe today’s baseline (your “steady growth”) is on the order of 2%. I gave the reason for this in my original post. Real disposable income growth, taking the past 3 years as a sufficiently long horizon not contaminated by the early recovery period, is 1.8%. Disposable income is the red wheel barrel. [From the William Carlos Williams poem – “so much depends on a red wheel barrel.”] This 2% (1.8%) just happens to be your 13-year number. But this is more or less by coincidence, with emphasis on the “more.”
Without dissecting your statement about normal profits – which contains two important nuggets of truth – let’s go straightaway to the stock market proper. It’s at a record level. And the underlying fundamentals (more than just the conditions you cite) indeed imply the level of the market is neither normal nor sustainable. So far so good. Yet it is a far stretch to say the market is anticipating (discounting) 3-4% real growth out to 2023-2025. A metastudy of the literature would find the market may have a one-year horizon. Two at the outside. But no one in the business would ever say the market has a ten-year horizon. The data do not bear this out.
Hans: It is not clear what you are getting at by your question. What I mean by equilibrium inventory investment (a flow) should be clear from my original post. It is the flow that matches businesses’ desired flow, the flow that maintains a modestly growing stock so that businesses in the aggregate have just the right amount of inventories on hand to meet sales expectations for the current and immediate next period. They compare the opportunity cost of a lost sale at the margin, because of not having an item in stock, with the debt, equity, and operational costs of putting that next, say, auto on the lot. In an accounting sense the OC includes lost good will, damaged reputation, dented customer satisfaction, outright loss from missing the sale, expected future profits lost because that customer may buy again in the future from the competitor who did have the product they were looking for, etc. If this opportunity cost is deemed greater than the cost of carrying the inventory, then inventory will be added to. Otherwise not. The businessman’s judgment in this regard will depend on a sales forecast. This forecast will take cognizance of local conditions and national. In particular – and I want to emphasize this – business cycle turning points present the greatest risk. Especially the upper turning point.
This reflects on the economics profession. If forecasters could get forecasts reasonably right, the businessman could hire the forecast in the same way he or she hires a lawyer or accountant. For a small additional cost of doing business, inventory could then be better managed. Alas, it is relatively easy to predict trend growth during expansions. You can usually use a straightedge. But like unruly children, cycle peaks make all the trouble. Trouble that all too often for businesses ends in bankruptcy.
The reflection on the profession proper, in turn, re-reflects on this blog. One of the values of this blog is the extent to which it iterates toward better forecasts by informing readers. There are of course other values. These tend to be of a longer-term nature and policy oriented.
Now for the second aspect of your question – accelerating inventory. The equilibrium level of inventory investment I posited in my original post is empirically based. It is a dynamically moving number, though the movement is at a snail’s pace. And it specifically applies to expansions. As long as the expansion goes on, actual inventory investment will mean revert to the level I cited. Since actual inventory investment has gotten far above desired, there will be no acceleration of inventory. It will be a deceleration and drop until actual and desired align. Hope this answers your question.
Aaron: I have asked myself the question you implicitly posed. To wit, is the economy structurally better or worse off today than it was during the crisis? The first thing I would say is there should be no facile answer to this. Your parenthetical remark evidences that you have not thought this through. Let me deal with that remark first.
You imply that interest rates are going to stay low because if they were raised they would (in your words) crash the economy and that would take them right back down again. Your stated premise leads to a negation of its possibly happening. Such reasoning is logically in error and all too common. Do you understand that you envelop a period of 3 years or so (at a minimum) before rates will ever get high enough to crash the economy (slow it perhaps but not crash it). Then another year goes by before rates fall back to their original level. Yet, who of us can foretell what developments will occur over the next four years so as to give any weight at all to your hypothetical scenario of how things could unfold? This is not textbook stuff. It is real world. It is one thing to claim that if interest rates get high enough, they will crash the economy, and then as demand slumps rates will come down. This we know happened roughly ten times the past 65 years. But it is another thing entirely to posture this happening in the immediate and relevant future. The logical fallacy is that of a red herring. It distracts us. To the point, the very structure you ask about is sure to modulate the level and timing of the hypothetical you lay out.
First things first then. Exactly what is the economy’s structure today? How does it compare with the past? Or to keep with your post, how does the structure of the economy today compare with that at the time of the crisis. To answer this you must understand structure. You will not come close to understanding with textbook reasoning. We are in a very different place today than anything the textbooks describe. Let me illustrate a part of how I think about structure by an analogy. Over the past 100 years, all recessions can be lumping into one of two bushel baskets. Those precipitated by massive credit bubbles (1929 and 2007), and the rest which had their proximate cause as yield curve inversion. If you buy this division, there are only two comparison points – the Depression and today. What is the differentiating variable between the two? (There are many, but I am invoking thought as to what might be the main one.) Arguably it is monetary and fiscal policy. Both are polar opposite of policy in the 30s.
When a great credit bubble occurs, concomitantly there are massive real sector imbalances. These by definition need to be worked off. At the time the economy turned in ‘33, the market process was less impeded than it is today. Since the peak of the current crisis, the Fed has held the most important price in the economy – the price of credit – at its minimum minimorum. That’s the first clue as to how disabled the mechanism is by which the old structure can move to its new (moving) optimum. The second element is debt. Household debt has indeed fallen as a proportion to GDP. But not by a lot. And mostly it’s because mortgage foreclosures have simply wiped debt off the books. Still this is a small plus for today’s structure versus that of 2008. But towering above this is the federal government’s debt, gone pell-mell in the other direction. Jointly – and this is what is important – public plus private debt is at an historic high. This aspect of structure is manifestly worse. It is all the more so because of the leverage ratio this higher level of debt implies. And the danger resides in the greater susceptibility to shock at any moment as well as down the road. The global financial position is in some ways better, but in some ways worse than 5 years ago. All of this is part of structure. Structure encompasses real and financial.
Then there is the labor force. Proportionately fewer in the labor force today to support day-to-day consumption and the considerably expanded welfare state. The latter is another aspect of structure that is worse. Fewer to support the greater burden of debt, too. No matter what you read or what you think, one way or another that burden must be both carried and eventually dealt with. Next, the country is more divisive today than in 2008. Do not think that just because social conditions are not a variable in macro models they are not important to the economy proper. You can point to a shift out of construction and finance – the two most bloated sectors – into wherever. This is visible. But few grasp the increasing capital malinvestment inherent in in today’s artificial rate environment. On this score, there’s been little change. We’ve just swapped housing malinvestment for a different sort.
Next, the trade deficit. The annual balance on merchandise trade as a proportion of GDP is 4.1% today versus 6.1% at the height of the crisis. But what fundamentally in the structure has really changed in regard to US competitiveness? My cautionary note is that this numerical comparison hides an ocean of reality. I cannot think of a thing America has done this past 5 years to make us more competitive in a sustained way. On the contrary, the US has slipped in international rank on many indices. China is flexing its muscle. The dollar has slid in terms of its reserve currency status though not in terms of its trade-weighted value. The globe looks on the US less favorably since the crisis. The long vaunted US capitalistic system is less of a model for other (developing) countries now. Military spending is being ratcheted back, and that’s being applauded. But a more perspicacious view must hold both short and long-run simultaneously in mind and weigh the probabilistic impact of the next geopolitical crisis on the scales along with the current numbers on defense spending. The NIPA accounts aren’t of much help with this.
Finally Obamacare. What was apparent to those of us who thought deeply about this domestic policy change back in 2010 is now (no surprise) playing out. The American public is still clueless about the major shock that’s coming. That being the cancellation of 2 to 3 score million employer sponsored health insurance policies in 2015. With joint premium and out-of-pocket increases on the order of 75% hitting household budgets, and then more to come. This will devastate the non-health portion of disposable income expenditures on an order never seen before outside of major recession downturns. All this and more is the warp and woof of structure.
My judgment is the economy’s structure is in worse shape today than ever. Most likely far worse. If this is so, and given that monetary and fiscal policy are for all intents and purposes out of ammo, the next shock when it comes – and we can be certain in this more-leveraged, more-prone-to-financial-contagion global economy one is coming – the next crisis could easily be worse than the last. And then reflect. Do you know of even one national leader who commands the public’s respect and has comprehensive enough knowledge to manage this?
JBH, thanks for the detailed and thoughtful reply. The per-capita metric is critical because of the demographic component of the Long Wave (LW), which is the structurally deterministic force entraining the secular conditions to which we must respond and adapt, whether or not we know the forces exist or are determining our responses.
Moreover, the best data available indicate that long-term growth of value-added output after price effects is a function of the rates of population growth and the capitalization of labor such that multifactor productivity is sustainable at a rate after price effects of population/labor force growth and its capital replacement. Therefore, the population metric is critical to the understanding of long-term growth determinants that are cumulative over the course of two or more generations. What we enjoy today in terms of per-capita material standard of consumption and well-being is a result of labor productivity increases, wage gains, savings, capital formation, and increasing energy density and techno-scientific sophistication and complexity of production of the past 40-80+ years. If per-capita growth today is not sufficient to replace labor subsistence and its necessary capital replacement, real GDP per capita will cease growing, which in turn implies no growth of capital formation, investment, production, employment, purchasing power, and savings. If an economy is not growing vs. its growth of population, it is in decline.
See John Hussman and Robert Shiller’s data for the implicit 10-year correlation to future returns basis current valuations.
Also, the “wealth effect” is a dubious notion refuted by Fed economists themselves; it should be replaced with the “wage effect” or “production effect”. Equity market bubbles historically result in LESS growth thereafter and CONSUMPTION of excess rentier gains. Financial bubbles act as a vacuum for savings and as claims on future labor, production, profits, and gov’t receipts.
During LW debt-deflationary regimes, as began in 2008 (and in Japan in 1998, 1929, 1893, and 1837), the typical inflationary or reflationary imbalances do not occur. That is, price and wage inflation does not accelerate nor does capacity utilization exceed 80% such that central banks must tighten reserves and banks commence a liquidation cycle typical of a business cycle progression. IOW, the yield curve does not invert ahead of business cycle contractions of a debt-deflationary regime as occurs during inflationary and reflationary regimes of the LW.
We won’t see a yield curve inversion before the next business cycle contraction.
@JBH: “My judgment is the economy’s structure is in worse shape today than ever. Most likely far worse. If this is so, and given that monetary and fiscal policy are for all intents and purposes out of ammo, the next shock when it comes – and we can be certain in this more-leveraged, more-prone-to-financial-contagion global economy one is coming – the next crisis could easily be worse than the last. And then reflect. Do you know of even one national leader who commands the public’s respect and has comprehensive enough knowledge to manage this?”
We agree. What you well describe is what keeps me awake at night. There are no desirable (politically palatable) solutions (of which the top 0.01-0.1% to 1% would approve) to problems that we are not permitted to recognize publicly as a society.
Referring to your mentioning Obamacare, your point is further buttressed by the fact that the US spends $9,200 per capita and . . ., wait for it, $24,000 equivalent per household, for “health care”, when the median US household income is $50,000, and $45,000 for 70-75% of households. With or without Obamacare, “health care” costs are destroying the health of the US economy, households, gov’t budgets, and the future prosperity of the bottom 90-99% of US society who are not direct beneficiaries of the net flows to the insurance and medical services industries.
http://www.thepurplehealthplan.org/
Oh well, keep it short : now is the time for some tapering.
Hi, and welcome to you, Janet !
Is “JBH” really James D Hamilton??
Isn’t the middle initial wrong?
Nick G: No, JBH isn’t me.
Professor Hamilton,
Shouldn’t you clarify this?? JBH is saying things like ” The equilibrium level of inventory investment I posited in my original post is empirically based. “. This was in his first comment, so it was clearly intended to convey the impression that he or she is in fact you, the co-author of this blog.
For a while, I thought you were saying that we were on the brink of financial disaster, which is JBH’s message! As you managed to call the Great Recession stock market bottom, I was considering selling stocks!
Seriously, this person seems to be impersonating you – it very much seems called for to clarify who’s who.
hmmm. Maybe that’s too strong – JBH seems to be referring to his first comment, not the “original post”.
Well, still seems misleading…
Nick and jdh, I have had similar misunderstandings with jbh. Professor Hamilton, you may end up with a few odd viewpoints attributed to you, at your own peril!
hmmm. Maybe that’s too strong – JBH seems to be referring to his first comment, not the “original post”.
Well, still seems misleading…