Is growth really collapsing?
Reader Steve Kopits doubts the veracity of the current reading on Chinese GDP growth. He writes:
The oil stats say China’s growth has been decelerating for a year, and current GDP growth is in the 0-3% range. Is there another historical example of a major GDP driver like China growing at 7.5% and the currencies of its major vendors collapsing? Do we really believe China’s 7.5% reported GDP growth? In volume terms, that would be as much as 10% GDP growth in 2005. And in 2005 there were all sorts of stories in the press about China’s booming energy sector, housing, manufacturing, luxury goods, exports, infrastructure, etc. Most of what I read about China lately is air pollution, ghost cities and South China Sea tensions. [Are we] sure this economy is growing at 7.5%?
Well, I cannot claim to be an expert on Chinese national accounts, although I know enough to say the level is probably off, and that the composition is probably mis-measured. But I am not sure the mis-measurement is any greater than it was in earlier times, so I am dubious q/q annualized real GDP growth is in the 0-3% range. Here is some data and econometric evidence to buttress my assertion.
First consider what is the reported q/q real GDP growth (non-annualized in the figure below):
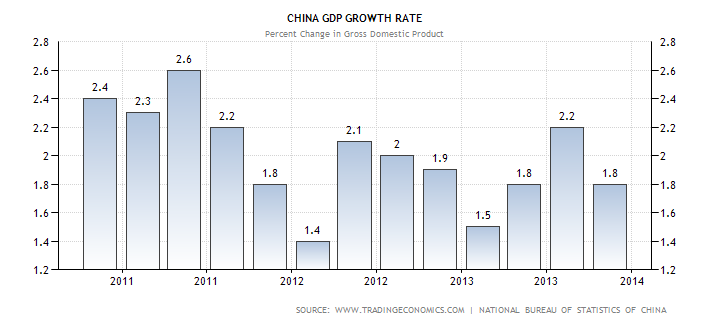
Figure 1 from Trading Economics, accessed 1/28/2014.
Note that 1.8% q/q is equivalent to 7.4% SAAR (specifically, 1.0184 = 1.074).
Now, what about the indicators like electricity that we referred to in the 1990’s?
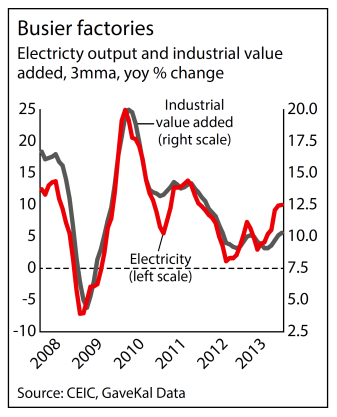
Figure 2: Industrial product and electricity. Source: China Economic Quarterly 17(4) (December 2013), GK Dragonomics.
Trends in these indicators are not consistent with a near zero growth. China economy watchers typically look at a variety of indicators now. One popular summary measure is the Li Keqiang indicator (thus coined when he was the vice premier), which is a composite of electricity production, rail cargo shipments, and loan disbursements. Here the evidence also seems counter to the argument of 0-3% growth.
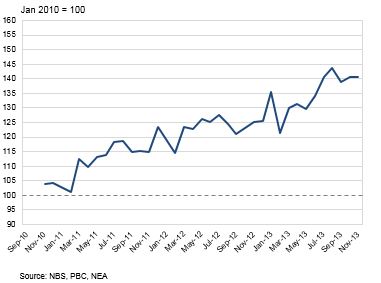
Figure 3: “Li Keqiang” index. Source: World Economics, accessed 1/28/2014.
PMI’s throught 2013 indicated continued growth, although the first reading for 2014 indicated a possible contraction in industry output (the Markit/HSBC measure indicated contraction while the market expectation of official measure is just above 50). [1], [2].
Now it’s possible that the relationship between the Le Keqiang indicator and GDP has broken down. However, John Fernald, Israel Malkin, and Mark Spiegel, economists at the San Francisco Fed, have recently assessed this proposition in “On the Reliability of Chinese Output Figures” (March 2013). They concluded:
…the 2012 reported output and industrial production figures are consistent both with alternative Chinese indicators of the country’s economic activity, such as electricity production, and trade volume measures reported by non-Chinese sources. These alternative domestic and foreign sources provide no evidence that China’s economic growth was slower than official data indicate.
The figure below highlights this relative stability in the relationship.
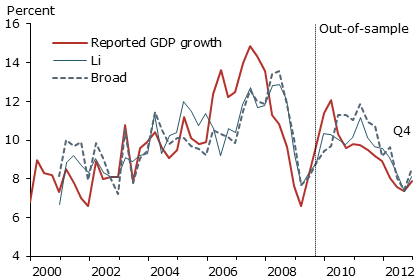
The authors also assess the correlation with a broad index which includes an index of consumer sentiment, construction of new floor space, an index of raw materials usage, air passenger volume, and the nominal value of new residential real estate construction.
So we have some confidence that through 2013 growth continued. Now, it is conceivable that q/q output growth in the first quarter of 2014 could drop to 0-3% (annualized). It’s important to remember, however, that the manufacturing PMI applies to only part of the Chinese economy; the weighted average of the manufacturing and non-manufacturing PMI is still above 53, so forward looking indicators (which can be wrong) still point to expansion.
For more on Chinese GDP, and why we expect — and want — some slow down in growth, see here.
Addendum: Here is a up-to-date graph of the growth rate in the Li Keqiang index. Note that each institution uses slightly different weights (SF Fed uses principal components).
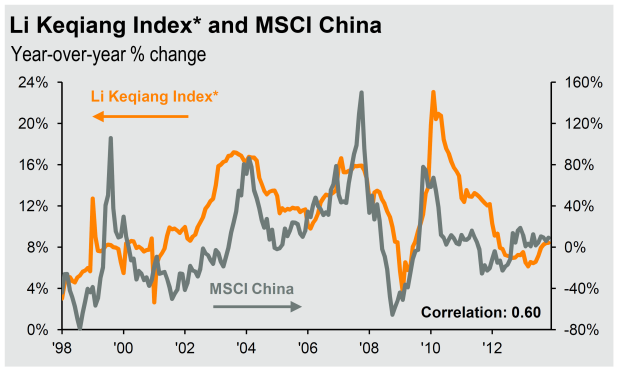
Figure 4. Source: JP Morgan Asset Management, Market Insights: Guide to Markets: Asia, 1Q2014.
Looks like positive growth when expressed in terms of first derivative.
A few thoughts.
The assumption is that the government provides accurate figures in good times, but in bad times, growth is officially pegged at 7.5%. Fernald et als numbers come from March of last year; most of the slowdown would have come later.
The Li Keqiang index looks like it’s declined since the middle of last year.
But, reported electricity consumption remains solid.
I don’t know. If you said China was in recession, I’d believe it. We’ve had three episodes of financial instability in the last year. How many other countries have had three episodes without a recession?
But who knows? Maybe the good times continue to roll on, that two-power-plants-a-week, an-airport-in-every-town pace. But it’s not there in the press. Maybe the western press has become biased against China (there are Chinese who think that). Perhaps China needs better public relations. (They do, as a matter of fact.)
But I don’t feel the heat of an economy adding as much in volume terms as it did in 2005-2007. I don’t see it in oil prices, coal prices, iron ore prices, gold prices, the Baltic Dry Index, or the strength of the Australian or Brazilian economies. I don’t see it in the strength of regional SE Asian economies. I no longer hear, “Well, if you haven’t been to Shanghai in two years, you wouldn’t recognize it.” I do see L’Oreal discontinuing a product line there and Revlon leaving China. If everyone has piles of money to blow, you’d think spending on cosmetics would be surging–even weak companies should be making money.
And it seems that a huge share of GDP in China is investment, and a lot of that investment has gone to real estate, in fact to real estate for which, at this point, it’s not clear that there is underlying demand.
So I don’t know. Maybe everything is fine. But it doesn’t feel like 2007. There is no excitement, no sense that “you have to be there”, when the statistics say that we should feel that.
Now, don’t get me wrong. I’m a huge Sinophile and I think Xi’s proposed reforms are breathtaking. He has truly laid out the Great China vision–not great militarily, but as a city on a hill, a place which others envy and hope to emulate. I think China has a very bright future. But right now, the country seems to be in a kind of doldrums, and I can’t square what I read in the press with the numbers as they are reported.
Steven,
What do you think of the argument that shifting from capital investment-led growth to consumption led growth will be too difficult, and that China will stagnate like Japan?
I think converting to consumption-led growth could be hard. But Jim and Menzie are far more qualified to speak about that than I am.
And no, I don’t see China stagnating like Japan, at least not for a long time.
Steven Kopits: I think you misunderstand why I included the Fernald et al. graph; it was to show the stability of the relationship between GDP and the Li Keqiang index. I include in an addendum at the end of the post a plot of the growth rate of the Li Keqiang index as calculated by JP Morgan which incorporates as recent data as possible. To me it seems to signal continued growth.
Well, OK. Li Keqiang is the Premier of China. He preferred an index based on various factors specifically because he felt official GDP was overstated in some cases, that growth was smoothed, as Jack Welch might say. So the very purpose of the index was to compensate for the issues that I have raised here. On the other hand, once the components of the index are known, and known to be tracked, there is an incentive to massage those as well. So the components of the index are not necessarily more independent than the summary GDP data. But the very existence of the index underscores the concerns I have mentioned.
In any event, more data is certainly better. But if you’re trying to convince me that China’s hot, hot , hot, well, I don’t see it right now.
Here’s the original Economist story: http://www.economist.com/node/17681868
Steven Kopits: I’m not saying Chinese GDP growth is hot hot hot. I’m just saying it doesn’t seem to me that the indicators are consistent with 0-3% q/q annualized growth in 2013Q4, which I think was your original assertion.
“Most of what I read about China lately is air pollution, ghost cities and South China Sea tensions.”
Since when has news paper articles about a country ever been a reliable guide to that country’s strength? It sounds a bit like the people who think the number of rapes is greatly increasing because that’s what the tabloids write about.
The reason why there are fewer articles nowadays about chinas growing economic clout is probably that it’s part of the new normal, i.e. it’s not news. Like how a hundred people dying in a plane crash will get far more attention in the media than the fact that roughly 34 000 die each year through traffic in the USA. Car deaths are simply something that we’ve come to expect
That said the blogpost was very interesting, so thanks Menzie!
Hi Menzie,
If the main issue surrounding Chinese growth is that GDP figures can be somewhat overstated, and that other indicators such as the Li K may not be as reliable as thought, then you should look into our Sales Managers’ Index for China.
Our independent and free research provides the earliest and most complete overview of all sectors of the Chinese economy on a monthly basis. Whilst Chinese growth figures may be disputed, our Index shows strong economic growth in China over the past year – although it’s clear that the rate has cooled recently.
http://www.worldeconomics.com/SMI/China-SalesManagersIndex.efp
Thanks for an interesting read and discussion.
Regarding oil consumption, note that both the US and China slipped into net oil importer status, long before either country showed a production peak, because of rapid increases in domestic oil consumption.
Based on EIA data, from 1949 to 1970 (when US crude oil production peaked), US net oil imports increased at 10.9%/year. From 1970 to 1977, US net imports increased at 14.2%/year. Production from the North Slope of Alaska began to come on line in 1977, and consumption began to fall a couple of years later, contributing to a temporary decline in net oil imports.
From 2005 to 2012, Chinese net imports (total petroleum liquids + other liquids, EIA) increased at 9.8%/year, which is actually below the long term rate of increase in US net oil imports from 1949 to 1970. However, note that Chinese oil production has been flat to down for three straight years, through 2013. As noted above, when US crude oil production peaked in 1970, it contributed to a significant spike in the rate of increase in net oil imports. My point is that even if the rate of increase in Chinese oil consumption is moderating, this could be offset by flat to declining domestic production, resulting in a continued relatively high rate of increase in net oil imports.
As I have occasionally noted, at the 2005 to 2012 rate of decline in the ratio of Global Net Exports* of oil to Chindia’s Net Imports the Chindia region (China + India), alone would theoretically consume 100% of Global Net Exports of oil in only 16 years. What I define as Available Net Imports, or Global Net Exports less Chindia’s Net Imports, fell from 41 mbpd in 2005 to 35 mbpd in 2012.
*Top 33 net oil exporters in 2005, EIA data
Jeffrey,
Platts thinks Chinese oil consumption is falling 2% year over year. That suggests falling imports.
Perhaps China is waking up to the enormous external costs of oil (pollution, security, etc), and to the enormous benefits to their economy of reducing consumption and imports.
The “ghost cities” that Steven mentions is one of the reasons for the high Chinese GDP growth rates in earlier years. True that the Chinese have capitalized on their abundance of labor and exploited exports, but they also knew that the Western press would love the story of a “ghost city” government waste driven GDP. China is beginning to come back to earth because ultimately the government runs our of “shovel ready jobs” (ask President Obama).
The demise of China is over-played just as the previous growth numbers were exaggerated.
Oh, Menzie, thanks for the post. Excellent topic and discussion.
US export data is gathered at the US port of export and US exports to China are up roughly 25% y/y in nominal terms as of November, which is the fastest pace since 2011. That should give at least some pause to the China growth bears.
In hindsight, China’s stats have proven accurate and even understated for the past 30 years. Mark Mobius, who has billions invested in both China and Canada, claims that Chinese stats are every bit as good as Canada’s. Hardly surprising, given that the country is run by engineers – just as Thorstein Veblen predicted the USA would be by now.
Posts like the above go far beyond the data they rely upon to paint an alarming (though link-baiting) picture. Their mere abundance suggests that the “China’s dodgy stats” meme never grows old. Why, The Economist has predicted 53 “hard landings” for China’s economy in the past 38 years. Makes you wonder about both motivation and competence, donnit?
Kopits is OBSESSED with oil.
True enough, Anon. It’s what I do for a living. I inform the M&A and product line strategies for companies like GE Oil & Gas, Baker Hughes, KBR, FMC, and ITT, among many others. In our firm, Douglas-Westwood, we will provide commercial due diligence on perhaps 15 oil and gas services transactions with a total value of $20 bn in the typical year. Pretty much all the private equity firms active in oil field services rely on us. People place billion dollar bets on our analysis, and it’s been pretty good. In terms of macro supply-constrained forecasting, no one is better. Not the IEA, not the EIA, not Goldman, not Barclays (better in some categories), not any of the majors, not Citi. And that’s because we have an elaborated supply-constrained model which explains the past and predicts the future better than any forecasting group out there. We have something they don’t.
Having said that, supply-constrained models are valid only over a particular section of the supply/demand curve. If the key customer for oil drops out for non-oil based reasons (for example, a financial shock or an overheated real estate sector), then pricing can revert to a demand-constrained regime, and then we’re back on Citi’s turf.
So it’s very important to know how things could play out. In this China is key. China has been setting the oil price, although at present the US appears to be the price setter again.
Now, China could be in three different phases of its business cycle:
1. A slowdown, which started a year ago and is more or less bottoming now, with a likely recovery from around mid-year. In this case, the oil price is near bottom with significant upside potential in H2.
2. China is stilling growing nicely, but may be entering a downturn now. In this case, the oil price could ease materially, indeed, could see a mini-plunge into the $90s for Brent. This is what Citi has been arguing–that supply is going to swamp demand.
3. China is going along just fine and will continue to go along just fine. In that case, the apparent slowdown in Chinese oil consumption is likely to be an artifact, perhaps an inventory shift or some kind of misreporting. If so, I would expect China’s oil demand to catch up to its pro forma growth level. Again, this is bullish.
So, two of three scenarios are OK, and one is potentially pretty bad.
Now, as you may recall, I noted that Hess has reduced capex by 30% over two years, and Hess is ahead of the pack due to the strong arming of Elliott Management. If the industry followed this trend, then upstream spend from just the publicly listed oil companies would fall by $80 bn over the next two years, with most of this being felt by Houston and Aberdeen. That has implications for valuations, exits, entries and strategies. And that’s at $107 Brent. Now, if Brent falls to $95, then I dare say capex is going to seize up in the industry. And the oil companies’ capex is the oil field service companies’ revenues. Get it?
So, this is not an academic debate for me. It directly influences the advice I give my clients. My value, in part, is to see things before others do. To do that, you have to be obsessive, and you can’t always take numbers at face value.
Here’s an article on capex compression from today’s WSJ: http://online.wsj.com/news/articles/SB10001424052702303277704579348332283819314?mg=reno64-wsj&url=http%3A%2F%2Fonline.wsj.com%2Farticle%2FSB10001424052702303277704579348332283819314.html
And here’s an interview with me reassuring the industry on potential oil price downside, but cautioning on limited upside and cost escalation: http://www.drillingcontractor.org/analyst-shale-oil-wont-threaten-deepwater-but-rising-costs-oil-prices-might-27629
supply-constrained models are valid only over a particular section of the supply/demand curve. If the key customer for oil drops out for non-oil based reasons (for example, a financial shock
I’d say your model is too simple. Right now oil is more expensive than many equally good or better alternatives, but their pace of development isn’t fast enough to have a really noticeable impact. Those alternatives are growing exponentially from a relatively small base, which means that their early growth appears small, but later growth will surprise oil sellers.
Customers will drop out for *oil*-based reasons – the alternatives are cheaper and better. And, they will continue to get cheaper and even better. Tesla is a perfect example: they’re better and cheaper than their premium sports sedan competition, and they’re moving down-market.
The average Tesla S costs $95,000 and has a 250 mi range. In these respects it’s neither cheaper nor better. Certainly, the Tesla is beautiful, but 20k unit sales doesn’t move the needle much on nearly 16 m US vehicle sales over the past year.
kopits, compared to other high end vehicles, tesla probably is better. and 250 mile range is not bad. I drive a Honda crv that cannot go 250 miles on a tank of gas in the city! regarding tesla, they also have indicated within a couple of years producing a much more affordable car in mass-so change is coming down the pipeline and may hit you like a ton of bricks in its abruptness.
Steven,
The Tesla Model S is much better, and much cheaper than it’s luxury competitors.
For $70k you get 0-60 in 4.2 seconds, and better handling and luxury.
And, the gas savings can reduce the effective price of the car from $70k to well below the $30k price tag for all new cars. That’s because most luxury cars get terrible MPG – one owner, Mr. Baer, did the math on his Model S, which cost $78,000 with the options he chose. After the $7,500 federal tax credit and the $4,000 tax credit from the state, the car was $67,500.
“I had a (Porsche) Cayenne before this that got maybe 15 miles to the gallon—so I’ll save myself about $6,000 a year in gas,” he says. “It will cost me about $3,000 to charge the car for six years. It’s not really as expensive as people think it is.”
The new status car: Tesla – It’s happening in the parking structures at Gold Coast high-rises, in front of the Lycee Francais school in Buena Park, in suburban garages and in the reserved spaces at hospital parking lots: The usual suspects—BMW, Audi and Lexus—are being replaced by the Tesla Model S.
The Model S, which began delivery late last year and lists for about $70,000, comparable with other luxury sports cars, is a sleek, all-electric sedan that blends sports car zip (0 to 60 in 4.2 seconds) with a luxury car feel. The motor is three times as efficient as a gasoline engine and produces zero emissions.
This isn’t your father’s midlife crisis car. “It’s a game-changer,” says Joel Baer, a 44-year-old commodities trader from Deerfield. “Forget that it’s electric, it’s still the best car I’ve ever driven—the best handling, the fastest, the quietest and with the most storage.”
“It isn’t just for the nutty environmentalist like me,” says Ron Saslow, 47, chairman and CEO of Chicago-based dental instrument manufacturer Hu-Friedy Mfg. Co. LLC. He’s a Model S owner and an early adopter—he bought Tesla’s debut car, the Roadster, for $100,000 in 2008.
“This car can substitute for virtually any car in (the luxury) category,” he says. “The people who have BMWs or Audis or Mercedes sedans are the ones who are starting to switch over.”
http://www.chicagobusiness.com/article/20130810/ISSUE03/308109994/the-new-status-car-tesla?r=2772E0130356F3W
Shell is pulling out of their Alaskan project:
http://www.rigzone.com/news/oil_gas/a/131346/Shell_Stops_Alaska_Program_in_Year_of_Hard_Choices?
Another way to look at China’s growth is by looking at changes in their CO2 emissions. In 2012 they were up by about 3%, following years of double digit increases. Even if you normalize for hydro power coming back on aafter a severe drought in 2011 — a 23% increase in production — you only get to about 4.5%. Maybe there’s some additional fudge factor for cheating on reports of coal-fired plant emissions, but it’s still hard to get from 4.5% to 7.8%. I would assume that the same would be true this year. So how does an economy where they are building fossil-fuel fired plants as fast as they deploy alternative energy grow that much faster than emissions?
Here is my observation you can average into the “wisdom of the crowd”. I travel to 3 or 4 cities in China 2 or 3 times a year. It definitely seems that China is slowing, but not necessarily in a bad way. Less chaos. I am no longer terrified that a taxi ride will include the thump-thump of the car rolling over small children too slow to jump out of our way.
With regard to the C02 emission trends, I wonder if some of the government imposed vehicle changes have a measurable impact. All cars in Wuhan and some other cities are now powered by natural gas. Probably more significant is the disappearance of scooters with 2-stroke motors from some major cities and their replacement by electric scooters. That is a lot of very dirty scooters that are no longer on the road.
These changes are obvious to the casual traveler. China seems to be taking air quality seriously and I expect that that will eventually disconnect C02 emissions from the rate of growth.
“All cars in Wuhan and some other cities are now powered by natural gas. Probably more significant is the disappearance of scooters with 2-stroke motors from some major cities and their replacement by electric scooters …”
As in the US, the major Chinese vehicular air pollution problems are from trucks, not cars. But i am in Wuhan now, driving. I have been in Jingzhou (last week) and I live in Hangzhou, and get to cities in Zhejiang and Liaoning regularly. The claim that all cars in Wuhan … are now powered by natural gas is … I am trying to think of a term … let us say, self-evidently mistaken, both as to air quality and at the gas stations. In Wuhan, in jingzhou, there seem to be far more gasoline powered scooters than in Hangzhou, but the predominant use of electric scooters in Hangzhou and other cities is not a new phenomenon. Perhaps the numbers of gas powered scooters in Wuhan is dropping. Ok, good. “Taking air quality seriously” beyond the PR and wishes of the environmental departments, will be evident when the trucks with no pollution controls at all are off the streets, and Beijing begins to enforce the air pollution regs for the power plants to the west.
I don’t see any special reason for Chinese leaders to lie about their GDP. Chinese want to have a work, make money and increase their level of life, they are not interested in statistics. Foreign investors want to pay low salaries and they don’t care about Chinese GDP. So I think 7,5% grow is probably real.