OK, nothing about birthers, but some comments on truths held deeply, but unjustifiably, by certain types of people.
An Econbrowser reader (Rick Stryker, also an anthropogenic climate change denier, so consistent after a fashion) concludes in comments to this post by Jeffrey Frankel:
1) That some recovery, although disappointing, followed the stimulus is not an argument that the stimulus was responsible
2) The composition of GDP, particularly G, is inconsistent with the stimulus having been effective
3) The composition of the stimulus itself is inconsistent with the stimulus having been effective
4) A typical modern new-Keynesian model that works through expected inflation does not provide a believable mechanism through which stimulus could have operated
Well, point 1 is hard to argue against. Granger causality is not the same as causality. Pretty hard to prove anything causes anything using this criterion. Alternatively, one could flip the question around, and restate the the null hypothesis. Consider Figure 1; notice that ARRA spending is exactly at the same time as the recovery’s beginning.
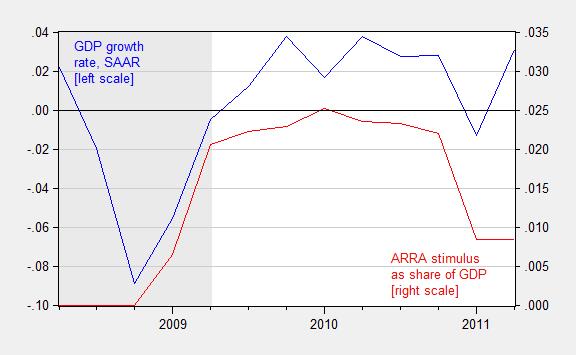
Figure 1: Quarter on quarter growth rate of real GDP, annualized (blue line, left scale) and sum of total receipt effects (reversed) and total expenditure effects from the ARRA, as a share of nominal GDP, 2008Q2-2011Q2. NBER defined recession dates shaded gray. Growth rate calculated as log first difference. Source: BEA via FRED and BEA 2013Q3 3rd release, NBER, and author’s calculations.
I think that reasonable people would say the burden of proof lies on those who assert the beginning of the recovery is due to anything, anything (Fed balance sheet expansion, TARP — both implemented six months earlier –, sunspots, or the return of Ancient Aliens) but the policies implemented by the Obama Administration.
On point (2), the assertion that the pattern in G doesn’t match the beginning of the recovery is just plain wrong. Inspect Figure 2. Notice the red bar, which is growth accounted for a NIPA sense by government consumption and investment spending.
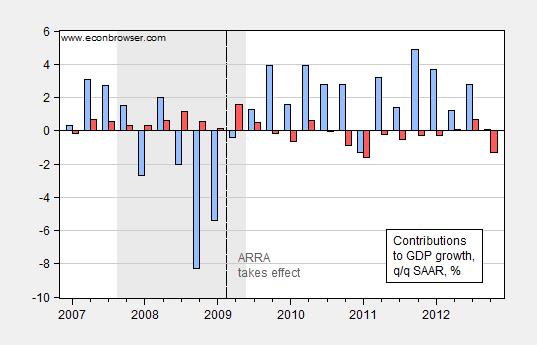
Figure 2: Quarter-on-quarter growth in GDP (blue) and accounted for by government consumption and investment (red). Source: BEA, 2013Q4 advance release.
Government consumption and investment spending accounted for 1.56 ppts of growth in 2009Q2. In economic (not accounting) terms, the impact is bigger, after taking into account multiplier effects (growth resumes going into 2009Q3). Of course the commenter’s focus on government spending on consumption and investment was predicated upon this specious argument:
When you look at the composition of the stimulus, it’s mostly temporary tax cuts and transfers. But Friedman’s permanent income hypothesis and similar ideas suggest that temporary tax cuts are saved rather than spent. Transfers also have very little multiplier effect. And it appears that the transfers to the states were not spent either but rather saved in the sense of allowing states to reduce borrowing.
That assertion is, once again, just plain wrong, on several counts:
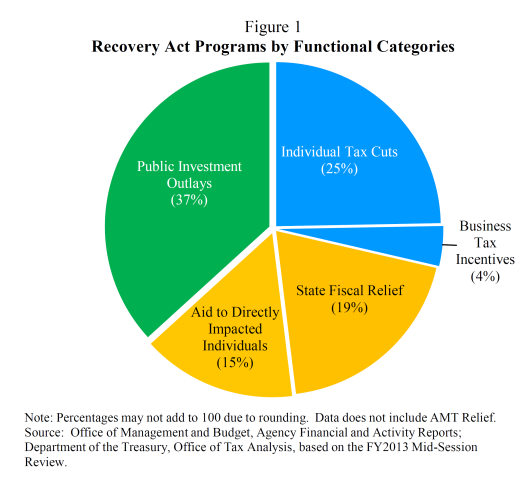
Figure 1 from CEA (2014).
Well, first, 56% of total expenditures were investment and transfers to states [1]. (The calculation omits AMT relief; if one includes it, the majority of expenditures are still in investment and transfers to states; see Table 3.) If one wants to define 44% as most, well one can (and some people do) define up as down.
It’s also important to remember why there was such a large tax component in the stimulus — it was at the insistence of Republicans; the relatively small spending on investment arose in part because so many critics of stimulus believed the recession would be short lived, e.g. Ed Lazear
Second, the assertion that temporary tax and transfer changes had little effect is based upon the Friedman permanent income hypothesis. This, I’ll remind readers, is not gospel, and in fact most DSGE’s I know of include a sizable share of households that are rule-of-thumb (a la Campbell-Mankiw) or hand-to-mouth consumers, exactly because in the absence of such agents, the models “do not fit” the data. One reason that this assumption works is that there are numerous liquidity constrained consumers, who do not behave as if they are completely intertemporally optimizing (not surprising to anybody who’s attempted to estimate an Euler equation for consumption!).
Third, the assertion that Federal transfers to the states were merely used to saved by reducing borrowing flies in the face of anecdotal evidence, the fact that states face balanced budget requirements, and empirical evidence, which indicates high impact on economic activity [2] [3]. Multiplier estimates by the CBO are in concurrence with that view (Table 2 of CBO (2014)).
Once one transcends intro macro, the argument that the composition of spending militated against the stimulus having an impact (point 3) falls apart, and Figure 1 is relevant.
Finally, with respect to expected inflation, it’s actually quite interesting how expected inflation rose after Obama’s election (and the probability of stimulus legislation increased), and continued to rise with the actual passage. This observation is shown in Figure 3.
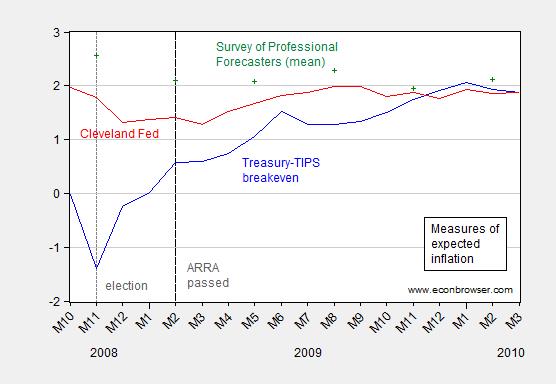
Figure 3: Inflation breakeven from difference between five year constant maturity Treasury yields, and five year constant maturity TIPS yields (blue), Cleveland Fed measure of five year expected inflation (red) and Philadelphia Fed average five year expectations of inflation (green +). Source: Federal Reserve Board via FRED, Cleveland Fed, Philadelphia Fed, and author’s calculations.
Treasury five year breakevens rose from 1.5 ppts, from 0.6% to 2.1% within the year of passage of the ARRA. The Cleveland Fed measure rises from 1.4% to 2%. Survey measures indicate a smaller increase, but once one takes into account the dramatic decline in energy prices toward the end of 2008 and into 2009, it is even more remarkable how much inflation expectations rose. I’m not saying the NK DSGE interpretation of how fiscal policy works is the only plausible one (and recall there are different types of NK DSGEs), but for me the movement in inflation expectations works in the right direction for the NK DSGE interpretation.
I find it interesting that the same people who cite results from a CBO report (evaluating say, for instance, the impact of the minimum wage) then dismiss assessments from the same CBO. In any case, here is the CBO’s assessment of the American Recovery and Reinvestment Act’s impact — specifically what GDP would have been in the absence of the ARRA. The midpoint of CBO estimates is shown as blue; the CEA “model” estimate is very similar to this midpoint series (see Figure 5, here, for graph showing deviation from baseline/counterfactual).
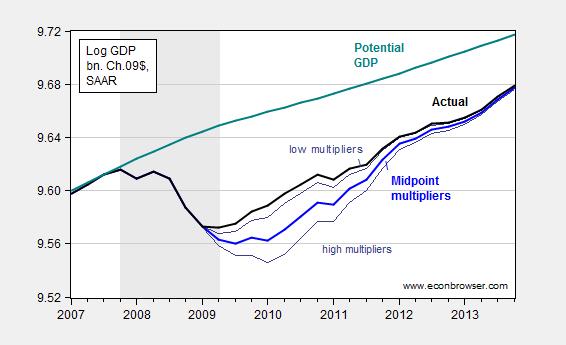
Figure 4: Log actual GDP (black), midpoint of CBO counterfactual of no stimulus (blue), high and low estimates (gray), and CBO estimate of potential GDP (teal), all in billions of Ch.2009$. Estimates presume no monetary policy tightening in response to fiscal stimulus. Source: BEA 2013Q4 advance release, CBO1, CBO, Budget and Economic Outlook, February 2014, and author’s calculations.
In other words, the range in the consensus implies some impact of the stimulus, not zero.
Because I know that some people will disbelieve what I write just because it’s coming from me, I’m going to quote from a vehement critic of the Administration’s policies, but somebody who understands macroeconomics — Doug Holtz-Eakin of the American Action Forum, and formerly Director of the CBO (via C-SPAN coverage of NABE, about 24 minutes in):
It’s pretty tough to throw a trillion dollars at the U.S. economy, and not do something, and so the whole notion that somehow this had no effect is badly misplaced.”
More discussion of fiscal policy and multipliers here, while a survey of recent thinking on fiscal multipliers for The New Palgrave Dictionary of Economics is here.
Menzie As I just said in other comments, the real question is how to reconcile your belief that stimulus matters when fiscal spending declined after 2009 only to see rGDP growth increase? If want to use your charts, how do you explain Fig 1 after 2011? Or is internal consistency only a restriction you apply to others? Then perhaps after that we can discuss (yet again) the game theoretic view of fiscal/monetary policy. Yes, I know we’ve been down that road many times before, and maybe I’m naive, but I hold out that it will eventually sink in for you.
Yes, you are naive, but for other reasons. You clearly don’t hold your own beliefs about the world to the same standard that you hold beliefs of others that you desperately wish are not true. You can snark up your comments all you want, but we know how much a fool you look like when you deny all the big facts and hone in on little inconsistencies that amount to nothing. I *know* you’ll never come to your senses. That’s one big difference between us.
A Jones — what a childish, silly post. One thing for sure—you are well in touch with YOUR inner fool.
I think you are making a mistake in logic here. Your argument is that since after 2009 economic growth continued despite the retreat to austerity (and the Fed ending the QE I program in 2010), economic growth continue at rate GDPr, therefore stimulus could not matter. First, empirically, most of the Fiscal stimulus and automated Government counter-cyclical spending (UI, food stamps, etc.) peaked in 2010. In addition, partially reversing its previous turn to austerity, Obama worked a deal with the lameduck Pelosi Congress and McConnell’s Republicans to cut the payroll tax and extend the Bush tax cuts for two more years, in December 2010. So there was additional stimulus in 2011 and 12 as the result of this action. Further, I don’t think CBO or Menzie, Krugman, or Wren-Lewis make the argument that the economy would not have eventually turned to growth unless there has been a stimulus, but rather the recession would have lasted longer, been deeper, and caused more permanent damage to the labor force along with a lot of unnecessary misery. Rather, that the New Old Keynesian argument is that GDPr would have been higher and the return to full employment and real wage growth would have happened by now if both the Fiscal stimulus had been greater and longer in duration and if the FED had not curtail its QE1 program in the Spring of 2010. It would have made up for the loss in of $1 trillion dollars in demand that the collapse of the housing bubble caused as housing investment spending collapse and consumption based on the housing wealth effect changed to deleveraging to eliminate debt.
sherparick I think we need to settle on the fact first. So, what is your preferred measure of fiscal stimulus? Then we’ll check how it moved and when.
There a multiple economic forces, and all recessions end. The fact that the economy had upward movement after the stimulus ended only means that there were also other factors involved. Not hard at all to reconcile those facts. Very hard to reconcile the timing of the stimulus and the subsequent immediate improvement, however.
But if you admit the stimulus wokred, then Lucas, Barro, Prescott and so on are then overly influential, as the real world is more complicated than their abstracted models admit to. And admitting that will be devastating to Ayn Rand cultists and their ilk….
It’s not just that the ARRA ended, it’s that fiscal spending is now lower than what it was before ARRA. So if you conclude that fiscal spending helps push GDP up, then the oppossite must be true and we should have seen and equal and opposite drop in GDP after 2009. Your explanation is that “other factors” are the reason GDP didn’t drop. I agree that lots of things will influence GDP but to claim “other factor” precisely when the evidence doesn’t support your hypothesis is not an explanation, it’s an ex-post rationalization. If we all claimed “other factors” like that all hypotheses would be true.
Well the whole point of a multiple regression model is that you can understand the impact of multiple independent variables simultaneously. Those people who have studied this in-depth, which Menzie cited in the last post in Table 6, use models that control for a variety of these other factors. Even after controlling for the later drop off in spending, QE, state and local factors and so on, there is a large impact on GDP from the stimulus.
Now there are real problems with over fitting these models, endogeniety and so on, but you certainly can measure the impact of these “other factors” and they have done so. The only way this effects hypothesis testing is by very well known problems, that have plausible fixes.
Not that I disagree that with the stimulus not having an effect (and wishing it had been double its size), and since I am not an economists I cannot do the mathematical modeling to examine the issue, but I believe a NK monetarist would argue that it was the Fed’s actions in December 2008 (when it kind of realized the economy was really sinking like a stone and the inflation hawks were for a moment speechless) which were the primary cause for the arresting the Great Recession/Lesser Depression in the summer of 2009. http://www.federalreserve.gov/newsevents/press/monetary/2008monetary.htm
However, if the FED, Bernanke, and the NK monetarists want the credit, they also get the blame for helping stagnate the recovery in winter of 2009-2010, when they were already looking for the exit door back to conventional tight money at the first sign of “green shoots.” http://www.federalreserve.gov/newsevents/press/monetary/20091216a.htm. And much like 1937, the Fed’s tightening occurred just as the Obama administration, even before the Tea Party Congress election of 2010, made its turn to austerity and lost the boost to employment provided by the Census and support in Recovery Act for state and local caused the recovery to decelerate in the late Spring of 2010, as can be seen in the chart on employment, by the crook in the employment chart. http://1.bp.blogspot.com/-ijU6PH-8dt0/UV7FocJzo7I/AAAAAAAAZtM/WUPGUOPBf9g/s1600/EmployRecMar2013.jpg
Menzie you wrote this line’
“Consider Figure 1; notice that ARRA spending is exactly at the same time as the recovery’s beginning.”
Exactly is a high standard. I note that the recovery demonstrated by Figure 1 shows it began at the end of 4 quarter 2008, the same as the start of 1st quarter 2009.
I also note that you show ARRA spending beginning at the same time. But as the fact pointed out, the bill was not signed until Feb 17, about half way after the quarter began. Yet, you show spending beginning Jan 1. Should the chart showing ARRA spending Jan 1 at 0, until Feb 17, then sloping up.
Is the spending line between Jan 1 and Feb19 a phantom and does that change the “exactly” to something more like approximately.
Another question. Since timing is important to your analysis, would it not be informative to add an overlay to Figure 1 of TARP? Perhaps it would show that it was responsible in large part to the to the timing of recovery. When discussing the immensely complex issue of economy and recovery, I find separated single issue answers falling into the thought of a hammer to which all problems can only be seen as a nail.
Ed Hanson: I somehow feel we have had this conversation before. This is a conventional time series graph. The observation for 2008Q4 is zero, the observation for 2009Q1 is about 0.007, and a line is inserted to connect the dots. This does not mean there was actual spending in 2009M01; if the frequency of the data were monthly, then you could interpret the data as you do. This is the convention I use, and I thought the same convention used by most sentient individuals. If this convention confused you, I apologize.
Menzie
I didn’t spend all that time making my Menzie Tape Measure so to not understand your convention. Next time read my comment, don’t just assume. The dates I listed are true to your chart and convention. So if you choose to read it again. the point is simple, your “connecting the dots” show spending from ARRA when it was not spent, specifically from Jan. 1 to Feb 19. It goes to the heart of your “exactly”
Read this, charts and graphs are used properly to inform not misinform. When it is certain that connecting the dots misinforms, those dots should not be connected.
And where is the TARP chart?
Ed
Menzie writes: “I think that reasonable people would say the burden of proof lies on those who assert the beginning of the recovery is due to anything, anything (Fed balance sheet expansion, TARP — both implemented six months earlier –, sunspots, or the return of Ancient Aliens) but the policies implemented by the Obama Administration.”
QE was shown to have effects and is contemporaneous with the ARRA. Why is all of the explanatory power attributed to ARRA (i.e. there’s no monetary offset)? That is not to say that ARRA was worthless (as some here have claimed) but it certainly casts doubt on it being the sole savior of the economy. There’s no reason to cast aspersions at your critics.
Tom: Nothing I have written, plotted, or cited, implies that QE1 (which starts more than six months before the end of the recession), nor the Fed’s encounter with the ZLB, had no effect. In fact, I have numerous posts on the efficacy of quantitative/credit easing. My point is there is (at least) as much evidence in favor of fiscal policy efficacy as for unconventional monetary policy efficacy.
‘I think that reasonable people would say the burden of proof lies on those who assert the beginning of the recovery is due to anything, anything (Fed balance sheet expansion, TARP — both implemented six months earlier –, sunspots, or the return of Ancient Aliens) but the policies implemented by the Obama Administration.’
Because there’s never been a recoveryd from a recession without fiscal stimulus?
Relying on Friedman without understanding Friedman is a sign of being infested with somebody else’s bad ideas. Friedman’s permanent income idea requires access to credit – utterly. It is utterly obvious that a credit-constrained consumer is not going to behave in accordance with Friedman’s hypothesis. Missing the relevance of that problem means missing a lot. Stryker wrote as if he understand economics, but he doesn’t. He merely understands how to argue for his own pre-existing point of view in truthy-sounding economic jargon.
As to the argument that monetary policy rather than fiscal policy accounts for the onset of recovery, well that’s one of those pundit notions that’s going around right now. Hard-core GOP types claim “stimulus failed” without explaining why. Their pundit-sympathisers who want to maintain some claim to credibility have taken to making the monetary policy argument and it looks like they are winning some converts. Monetary policy very quickly ran into a zero-bound problem. It was common during 2009 and 2010 to see negative numbers as estimates of the funds rate needed to provide adequate stimulus. Bernanke told Congress that monetary policy alone couldn’t do the job and supported doing “some of everything” when it came to fiscal policy, because the need was so great.
The idea that monetary policy alone accounts for the timing and pace of economic recovery needs more than hand-waving for support.
Kharris–how would a credit-constrained consumer (deeply in debt) respond to the tax cuts and increased transfers in ARRA? Are you suggesting they would spend most of it on consumption? Or, would they use it to pay down debt, in which case the impact on consumption would be very small? And if not in debt, I don’t understand how tax cuts/transfers prevent smoothing consumption.
I don’t know if you have the data handy, but what’s the integral of the actual – midpoint estimates? Eyeballing it, I’m getting something like $400b at the peak, with the peak lasting about 1.5 years, and then some narrower bits at each end. That’s a total income multiplier of about 1. Recall that a lot of published multipliers are >1 at peak, let alone integrated. So that’s pretty modest, if I’m in the ballpark.
More to the point, even CBO estimates that the effects have totally worn off by now.
The question isn’t whether the multiplier is > 1, the question is whether benefit > cost over a variety of horizons and for a variety of discount rates. (Why a variety? Because people have different ages & social welfare functions. That matters.)
Salim: I obtain an aggregate multiplier for all provisions (government consumption and investment, tax reductions, transfer increases) of about 1.05 for CBO midpoint estimates. Recall that in a static Keynesian framework, the multiplier for government transfers should be smaller than that for government spending on goods and services (holding constant mpc, etc.), so this aggregate multiplier seems plausible.
I agree that benefit vs. cost makes sense as a criterion. That’s what Holtz-Eakin is getting at (although I disagree with his weighting scheme). But my point is a more narrow, technical one – does fiscal stimulus affect GDP. Believe it or not, that is what some people still dispute.
‘Friedman’s permanent income idea requires access to credit – utterly.’
Really? Where does Friedman say that?
Off topic blog feedback: this comment scheme is harder to follow than the old one.
Greenpeace Co-Founder : There is no evidence that humans are the dominant cause of climate change, or that climate change is even happening.
Menzie is having trouble keeping up with what Leftist Central Command (LCC) requires him to think. This is the Co-Founder of Greenpeace here….
Keep in mind that Prof. Mark J. Perry, an Economics Professor of considerably higher stature than Menzie Chinn, has correctly identified global warming as a religious doctrine, blindly followed by its adherents.
“Stature” is not relevant. Menzie backs up everything he says with evidence. And the evidence is clear that climate change is caused by humans and the stimulus worked.
There are other things which liberals were wrong about, but not these two things. For example, the creators of public housing projects did not take into account social network influences, which led to more problems than the cheap housing helped. But on these two topics, the left was right, and the right was wrong.
I’m curious what evidence there is for Perry’s high stature? Note that he’s a professor in Flint, not Ann Arbor…
“Very hard to reconcile the timing of the stimulus and the subsequent immediate improvement, however.”
Nobody seriously thinks the stimulus had zero impact. But the question is, was it worth the cost? Was the growth in govt revenues so great that we could pay back the stimulus debt plus interest in a reasonable time frame? If yes, why would we ever stop stimulating?
Fiscal policy makes sense at ZLB. That appears to happen about once a century.
How do stimulus failure deniers reconcile that a large chunk of the stimulus package was tax cuts and their believe that government multipliers give larger economic returns than individuals spending their own money?
Here is the problem that Liberals, Menzie, and Krugman stay away from. We spent $800 billion on stimulus. If we are generous and assume that unemployment reached 10% instead of 11% due to the stimulus package, this means that approximately 1 million people were saved from unemployment. That means the federal government spent $800,000 per almost-unemployed person to keep them off of unemployment. This is as inefficient as you can get! It is no wonder that Conservatives don’t think the stimulus worked – while unemployment probably declined slightly due to the stimulus, it came at an enormous cost!
Next time, let’s just pick 1 million unemployed people by lottery and give each of them $800,000.
Anonymous First, ARRA was not just trying to lower the unemployment rate from 11% where it would have been without the stimulus (conditioned on assumptions based on late 2008 data) to 10%. The stimulus was also supposed to return the economy to normal employment levels by 2014. Second, the ARRA dollars were spread out over three years, not one year. Third, the ARRA stimulus was not $800B; it was $710B. Fourth, 1% of the labor force is not one million workers; it’s around 1.5 million. So with the right numbers, let’s redo the arithmetic. If you look at the infamous Romer-Bernstein chart and integrate the two areas under the two curves from 2009 through 2012 and take the difference of the integrals, you will see that ARRA was projected to recover about 6.3 million job years. So $710B / 6.3M job years = $113K per job year. This is actually a conservative estimate because the Romer-Bernstein analysis actually included a job growth differential out through 2014 rather than the 2012 I used here. Anyway, how does $113K per job fair with the total economy. At the end of 2012 nominal GDP was ~16.5T with roughly 145K employed workers. So average GDP per job = $16.5T / 145K = $113.8K per job year. Lordy, Lordy! Imagine that. But if you think about it for more than 2 minutes it should be rather obvious why that’s the right answer.
http://daviddfriedman.blogspot.com/2014/02/a-climate-falsehood-you-can-check-for.html
topic for your next post: shaming global warming alarmists for spreading lies such as “97% of global warming scientists believe in AGW.”
Friedman appears to be arguing that the author lied because instead of saying “”Cook et al. (2013) found that over 97% endorsed the view that the Earth is warming up and human emissions of greenhouse gases are the *main* cause.”” he should have said “”Cook et al. (2013) found that over 97% endorsed the view that the Earth is warming up and human emissions of greenhouse gases are *an important* cause.”
Is this really an important distinction?
anonymous,
“If we are generous and assume that unemployment reached 10% instead of 11% due to the stimulus package, this means that approximately 1 million people were saved from unemployment. ”
it is statements like this which make it extremely difficult to have rational discussions with you. do you truly believe that without stimulus we would only have had 11% unemployment, only 1% beyond the actual number? can you even back this statement up? what you really believe but don’t have the courage to say is you believe the stimulus probably caused additional unemployment! and you probably believe we would have performed even better without TARP?
My own rather simplistic model says that the effect of crowding out (about a 20 bp rise in the 10-year rate and a ~5 bp rise in the 3-month rate) was tiny*, but the impact on unemployment and RGDP was significant: The effect of the ARRA
* In fact, in a follow up, it is likely the Fed offset the impact on interest rates.
Anon& Lazy, ignore KHarris. He’s a hit and run commenter, motly full of hot air and ad homs. I doube he will even come back.
Darren and anonymous Climate was last weekend’s issue. Menzie didn’t support his own references when they were questioned. Let it go.
Menzie, ARRA? The fact that its results even need to be supported says it wasn’t politically successful, and that after all is all that concerns Democrats. I don’t doubt we will lots of politically driven drivel until the election.
Jeff
if you conclude that fiscal spending helps push GDP up, then the oppossite must be true and we should have seen and equal and opposite drop in GDP after 2009.
This comment tells me that you might be misunderstanding how fiscal stimulus works, so that might be the root of the problem. Fiscal stimulus is not supposed to be a forever deal. Yes, if you withdraw fiscal stimulus too soon, then the economy will be prone to slip back into recession. But once private consumption and investment (ignoring NX) return to normal strength, then failing to scale back the stimulus will overheat the economy and push up inflation. And in most NK models higher inflation expectations will increase aggregate demand. Despite your professed belief in the wisdom of the markets, your comment suggests that deep down you really don’t believe that markets are capable of returning to equilibrium. That’s the only way your comment about permanent need for stimulus makes any sense. If you really believed the economy was self-equilibrating, then you would not have said that a drop in fiscal stimulus would have reduce GDP by the same amount. Keynesians believe the economy will also return to an equilibrium; however, Keynesians also believe that the return will be unnecessarily slow and that without government fiscal policy it is possible that the economy could find itself in a low output equilibrium.
I hope this helps clear things up.
SlugsAnd how do you define C and I “returning to normal,” because most Keynesians and NK will point to the output gap. And the output gap was and still is significantly positive from 2010-2013. Thus, according to Keynesians and NK, the fiscal multiplier is greater than one, thus a drop in fiscal spending is projected to lower rGDP just as an increase in fiscal spending is expected to raise rGDP. So I ask again (with more clarity) why was there an increase in rGDP growth after 2009 at a time when the output was positive and fiscal spending declined to pre-2009 levels?
Jeff Other things equal, a negative fiscal innovation would reduce real GDP. But other things are not equal. For example, real GDP is simultaneously determined by an AD curve and a short-run AS curve. Fiscal policy only works on the AD curve. Meanwhile, other things have been going on. For example, consumers have shed a lot of debt because they increased savings during the nadir of the recession. Note that government dissaving (i.e., deficits) enabled private consumers and firms to save more and deleverage debt. As a result, consumers are in a better position to spend today than they were four or five years ago. And firms have increased investment in equipment as old capital wears out and depreciates. There’s also be some improvement in net exports. The point is that in most cases the economy will tend to get better all on its own, just as you or I will eventually recover from a cold or flu. Simon Wren-Lewis has been pressing this point pretty hard. The argument for Keynesian stimulus isn’t that the economy won’t recover without it, but that with stimulus it will recover more quickly and is less likely to find itself stuck at a low output equilibrium. As with a cold or the flu, the fact that you will eventually recover does not mean you shouldn’t also take measures to improve your recovery. And it’s certainly not a reason for you to decide against a seasonal flu shot to inoculate you against getting the flu. None of this means less fiscal stimulus isn’t still hurting the economy, only that it doesn’t mean real GDP growth must therefore be negative. It just means that a partial equilibrium analysis is not the same as a general equilibrium analysis.
Salim I think you have a point about the new format making it a little harder to follow the threads. It makes it easier to respond to comments, but it also makes it harder to follow the entire thread. I’m not sure how to fix that. Maybe some color shadings to differentiate comments and replies? Maybe an option to collapse and expand replies under the original comment? I dunno. But you have a point.
As for the commenting, a selectable “read” flag, or even a simple option to read new (an internal already read flag) would be helpful.
Menzie,
I didn’t know that the stimulus has been upgraded to the status of scientific consensus, so that it’s possible to be a stimulus denier. Was there an international scientific meeting I missed?
Anyway, I should have known that my comments would land me in the penalty box yet again. As usual, you are completely wrong. I guess I’ll have to set you straight by getting into a lot of detail, just as I was forced to do in the recent global warming alarmism and minimum wage controversies.
I don’t know what the diversion about Granger causality is all about other than to divert from a simple fact. To argue that because Y followed X in time, therefore X caused Y is simply a logical fallacy. The exact nature of the timing doesn’t matter. And there is no requirement for me to demonstrate anything just because I pointed out this fallacy. Jeffrey’s original post clearly committed this fallacy.
The composition of GDP is not consistent with the stimulus having worked. And neither is the composition of the stimulus consistent with stimulus having worked. Since these two points are related, I’ll deal with them together.
A necessary condition for stimulus to be effective is that government spending G must go up from what it otherwise would have been. Otherwise, there is nothing to get multiplied, even if you believe multipliers are greater than one. I find your bar chart a very curious defense since it shows that other than Q2 2009, the contributions of government purchases to GDP growth were small or even negative. The numbers below are from the BEA in 2009 $:
2009Q1: 0.15% 2009Q2:1.56% 2009Q3: 0.48% 2009Q4: -0.17% 2010:Q1 -0.63% 2010:Q2 0.61% 2010: Q3 -0.07% 2010:Q4 -0.87%
How are these small or negative contributions of G to GDP increases consistent with an effective stimulus? When you look at the posted chart, you can see that government spending in general contributed more to percentage point growth of GDP in 2007 and 2008, when there was no stimulus.
But we can ask a more pertinent question. Was that 1.56 percentage points of growth in 2009:Q2 due to the stimulus? And was all or a good percentage of the government spending during 2009-10 attributable to the stimulus? No, it was not. How do we know? Fortunately, the BEA has published data estimating how much of ARRA spending went into different categories. Thus, we have estimates from the BEA of how much of ARRA showed up in Federal purchases, how much went to tax cuts, and how much went to transfer payments.
Menzie has made a lot of the 1.56 percentage points government spending contributed to GDP growth in 2009:Q2. How much came from the ARRA? When you look at the table I linked to, you can see that total ARRA spending was 177.7 billion in 2009:Q2. How much of that large number went to federal government purchases? $1 billion dollars. Yes, you read that right, $1 billion dollars!
Now, if you look at the table you can see where the stimulus went. Only a small part of the total ARRA went to federal government purchases each quarter. Most of it went to tax cuts and transfers to the states. And when you look at the transfers to the state, you can see almost all of it is clearly labeled as transfer payments: medicaid, unemployment programs, etc, just as I asserted.
Of course, to be fair, it’s possible that the medicaid transfer payments and the educational transfer payments recorded in the table might have been diverted to state and local government purchases rather than transfer payments. The medicaid transfer payments might have allowed other state medicaid funds to be used for purchases, for example. But we don’t have any evidence that that diversion happened. If you look at real state and local purchases over 2008, you will see that they generally climbed, going from 1836.9 billion (2009$) in Q1 2008 to 1846.6 billion in Q4 2008. Here is state and local spending from the BEA for 2009 and 2010:
2009
Q1 Q2 Q3 Q4
1860.4 1877.1 1877.4 1870.6
2010
Q1 Q2 Q3 Q4
1836.5 1832.8 1818.5 1795
State and local spending went up in the first couple of quarters of 2009, consistent with 2008, but then began stalled and then collapsed in 2010 . But if you look back at the ARRA table, you’ll see that when medicaid and education transfer payments were climbing in 2010, the BEA ARRA data shows that the states were cutting their purchases. So, ARRA funds were not being transferred to purchases. If anything, it’s the other way around: states were transferring purchases to even more transfer payments or reducing borrowing, to the extent that they are allowed to do that. States seems to be behaving just like consumers: they cut their spending or reduce borrowing in a downturn even if they do receive a temporary revenue increase.
As I mentioned, when you look at the BEA data, you also see that investment contributed significantly to GDP growth from the Q4 2009 to Q3 2010. The contributions are 4.05 ppts, 1.77ppts, 2.86ppts, 1.86 ppts. What does stimulus have to do with this?
One final point: on the temporary tax cuts component, Menzie argues
“Second, the assertion that temporary tax and transfer changes had little effect is based upon the Friedman permanent income hypothesis. This, I’ll remind readers, is not gospel, and in fact most DSGE’s I know of include a sizable share of households that are rule-of-thumb (a la Campbell-Mankiw) or hand-to-mouth consumers, exactly because in the absence of such agents, the models “do not fit” the data. One reason that this assumption works is that there are numerous liquidity constrained consumers, who do not behave as if they are completely intertemporally optimizing (not surprising to anybody who’s attempted to estimate an Euler equation for consumption!).”
While not Gospel, I’ll remind readers that the ineffectiveness of temporary tax cuts for stimulus is a widely accepted enough view that Romer and Benstein themselves acknowledged in their original ARRA document The Job Impact of the American Recovery and Reinvestment Plan that the multipliers for temporary tax cuts are less than or equal to one.
The increase in expected inflation shown in your graph is not unusual in a recovery. The increase in the survey of professional forecasters is small. The TIPS data looks bigger but that just reflects technical factors as noted by Krugman. If you are brave, you will put up a chart showing UK treasuries minus UK TIPs, which will show that UK expected inflation behaved exactly the same way as expected inflation in the US at about the same time, even though the UK had no stimulus program.
But we can also see quite clearly that the expected inflation channel in the typical new keynesian models was not operational. In these DSGE models, expected inflation reduces the real interest rate, which causes consumers to shift consumption from the future to the present. So, this effect, if it exists, should show up in the consumption data. But the failure of consumption to recover from its precipitous drop in 2008 is apparent from this chart. Consumption dropped and then never moved back to trend. The rationale for stimulus to work in a zero lower bound environment from this sort of new Keynesian model is contradicted by the data.
As I’ve pointed out before, the fact that the CBO claims that the stimulus was effective is tautological. Since their models assume the existence of multipliers greater than 1, of course they find the stimulus to be effective. But whether the multipliers are really greater than 1 is the question at issue. So, the CBO’s view is hardly evidence. The argument about the authority of Douglas Holtz-Eakin is just another logical fallacy: the argument from authority. Besides, Holtz-Eakin is just expressing surprise that almost a trillion dollars could be spent without having some effect. But that’s just what I’ve shown going through the data. At best, even if you believe in multipliers, the effect had to be minimal because ARRA provided very little funds to multiply. And no one should be surprised that this policy failure could happen given the policies we’ve seen over the last 5 years. Even now, the Obamacare fiasco that many of us predicted is happening, with the Administration delaying key parts in an attempt to minimize the damage.
So let’s sum up yet again:
1) The original logical fallacy committed by Jeffrey in the original post defending the stimulus remains a logical fallacy
2) The composition of GDP is inconsistent with the stimulus having worked. The contribution of government spending is often small or negative during 2009-2010. The BEA ARRA data shows that ARRA funds that show up in federal purchases is a small part of the total package. The ARRA data shows that most of the funds went to transfers and tax cuts. The state and local purchases data do not suggest that ARRA transfers to states were diverted to state and local purchases.
3) The composition of the stimulus program is inconsistent with the stimulus having worked, having been composed mostly of temporary tax cuts and transfers as shown by the ARRA data from the BEA. Romer and Bernstein themselves acknowledged that the multiplier for temporary tax cuts is less than one.
4) Expected inflation did not go up in any unusual way. Consumption did not react to any potential change to expected inflation as required by the new keynesian model I mentioned.
5) The argument from the CBO assumes what you need to prove. Appeals to the authority of Douglas Holtz-Eakin or in fact Holy Scripture do not constitute an argument for the ARRA having worked. That’s 2 more logical fallacies to add to the tally besides the fallacy noted in point 1.
The stimulus didn’t work. The only thing we have to celebrate at the 5 year anniversary is that we didn’t do another stimulus and that we have no plans to do another one.
I guess I’ll have to set you straight by getting into a lot of detail, just as I was forced to do in the recent global warming alarmism and minimum wage controversies.
I really don’t think you want to rely on your record on “global warming”. You previously claimed that because there may be flaws in the climate models, that we shouldn’t do anything at all. That’s highly unrealistic. Do you refuse to buy life insurance, because actuarial models have consistently underestimated increases in longevity?
SlugsYour arguments are so full of inconsistencies it’s making my head hurt. On one hand you think fiscal stimulus is effective when the output gap is large. But on the other hand despite a large output gap fiscal austerity after 2009 wasn’t a problem because the economy was recovering anyway, consumers were feeling better, or whatever other fluffy narratives you want to throw out. One one hand you say that the ARRA worked because I see the level or rGDP growth increase when the level of ARRA spending increased. On the other hand, fiscal austerity probably hurt the economy after 2009 but we can’t just compare the level of rGDP growth and the level of fiscal austerity because other factors are at play and more complete analysis is required to judge its exact effect. As I said to Menzie, (without a response yet) is internal consistency only something you require of others?
Jeff The output gap refers to the difference between actual GDP and potential GDP. Potential GDP just refers to where we would be if all of the economy’s resources were being employed at their normal rate. Potential slack between real and potential simply means that there is room for additional aggregate demand stimulus without having to worry about inflation getting out of control. The output gap tells us how much output we’re giving up…and giving up forever, because of inadequate demand. It’s pure waste. An output gap does mean real GDP is falling. It just means potential GDP is growing faster than aggregate demand.
Mechanically, real GDP falls if C and I fall and G is held constant (ignoring NX). If the economy starts to recover and the increase in C and I exceeds the fall in G due to stupid Tea Party policies, then obviously real GDP will still increase despite those misguided policies. It won’t increase by as much as it would have if G hadn’t fallen and there will still be an output gap. None of that means real GDP is doomed to fall if G falls. Why is this so hard? That’s a real question. I’ve noticed that a lot of my conservative friends and family members have the same problem grasping the dynamics of GDP growth through time. I don’t get it because they certainly understand that in a two income household it’s quite possible for one spouse to see a drop in income that is more than offset by an increase in the other spouse’s income. When Menzie talks about fiscal multipliers he is working in a static analysis. A world of partial derivatives in which all other factors are held constant. I don’t think Menzie ever said that other factors like C and I had to be held constant in the real world.
SlugsNone of this address the inconsistencies I pointed out. Let me say it again. You’re right that other factors play a role in GDP. I simply pointed our that you and Menzie want to conveniently sweep this fact under the rug when you claim that the rise in G in 2009 led to a rise in GDP. Then when I ask why didn’t a fall in G after cause a fall in GDP you suddenly remember these other factors are important and claim that they outweighed the fall in G. To invoke “other factors” only when the data don’t support your hypothesis is not an empirically sound argument, its just ex-post rationalization.
Jeff why didn’t a fall in G after cause a fall in GDP you suddenly remember these other factors are important and claim that they outweighed the fall in G
Well, just look at the NIPA tables. That should answer your question. In 2008 & 2009 C fell by -4.0% and -1.6% respectively. Over that same timeframe I fell by -9.4% and a whopping -21.6%. Meanwhile, G increased 3.2%. In 2010 both C and I increased (2.5% and 12.9%) with G virtually unchanged (0.1%). In 2011 G did fall by -3.2% (the same magnitude as the increase in 2009), but overall GDP increased because C and I increased by 2.5% and 4.9%. Clear? G fell, but not by as much as C and I rose. So the net effect was an increase in real GDP. It would have been higher if G had not fallen, but it was still positive.
To invoke “other factors” only when the data don’t support your hypothesis is not an empirically sound argument
I think the essence of an empirically sound argument is to let the data do the talking. Look at the numbers. The data are what they are. Real GDP growth does not have to be negative just because G falls. If that’s what you think Menzie has been arguing, then you’ve really missed the boat. His argument has been that austerity policies have been a drag on growth, not that they necessarily lead to negative growth. As in so many things in life, size matters.
Slugs You are missing the argument. Menzie, or any other stimulus proponent, is not simply arguing that GDP=C+I+G+NX and therefore any change in G will change GDP by that amount. If that’s the case then any increase in G will always increase GDP and that’s not Menzie’s argument at all. The actual argument is much more nuanced than that. Until you get beyond this simplistic view I’m afraid there isn’t much point in debating things furtherAnd as to the argument that growth would have been higher without austerity, let’s be clear on exactly what you (or Menzie) are, and are not doing. You are relying entirely on a fiscal multiplier estimated from historical data that likely does not include the recent ARRA experience. You are not letting the recent data speak for itself. Instead you are trying to tell a narrative that fits the recent experience with your prior belief in the fiscal multiplier. When you see GDP growth increase after ARRA you are simply saying, well that is consistent with my prior belief. And when you don’t see a fall in GDP after 2009 you are content to chalk it up to “other factors” and say, well GDP would have been X percent higher without austerity. No matter what data you saw you would always be able to say, well it would have been X percent higher. When your story does not change regardless of the data that is most definitely not letting “the data do the talking,” it is as I said nothing more than ex-post rationalization.
Rick Stryker: I just referred to “an Econbrowser reader”, but I will edit text to highlight your role.
Regarding what was spent, what was not, of transfers to states, recall that with balanced budget requirements in many states, decreasing tax revenues would have forced decreased spending. Hence, we don’t want to look at changes in levels only, but against what they would have been in the absence of transfers to the states. In any case, for a more careful look at the effects, please refer to notes [2] and[3] in the post.
Regarding inflation in the UK, and the comparative fiscal stimuli, I note first you don’t provided any information about expectations in the UK, and second, if you looked at total stimulus (from automatic stabilizers and discretionary), the US and UK fiscal stimuli are comparable in percent-of-GDP terms — see Table 2 of IMF (2009)
Finally, what is it with some people’s obsession with “appeal to authority”? I appeal to authority when it’s my doctor because, heck, he/she knows a lot more about medicine than I do. I appeal to authority when I believe my brother on solid state physics because he has a Ph.D. in the subject, and I don’t. It seems you are happy to quote an article from somebody when it suits your beliefs, but not when it doesn’t — which I admit is not “appeal to authority” but appeal to something else.
Mernzie, what is it with you? You were doing well countering Rick’s points then you went off into ridiculous-land ridiculing him. Why do you think ridicule trumps logic? Your brothen and doctor are not here discussing anything. His paper was not refuted, and everybody finds and uses papers that support their premise. In your own article we can find this: “Third, the assertion that Federal transfers to the states were merely used to saved by reducing borrowing flies in the face of anecdotal evidence, the fact that states face balanced budget requirements, and empirical evidence, which indicates high impact on economic activity [2] [3]. Multiplier estimates by the CBO are in concurrence with that view (Table 2 of CBO (2014)).” Appeal to authority? You weaken your own arguments.
Because of unprecedented debt to GDP, net flows to the financial sector exceed nominal GDP growth yoy, so all of this is completely and utterly irrelevant. The net cost of the rentier financial industry and gov’t to the US private sector is prohibitive to growth or real GDP per capita indefinitely hereafter.
Private debt to GDP and wages matters. Economists don’t get it or can’t publicly say it for fear of losing their legitimacy, jobs, and socioeconomic status; ergo, most economists don’t matter when it most matters.
Can you solve this?
https://www.youtube.com/watch?v=vKA4w2O61Xo
corev, i imagine menzie drives off course occasionally because responding to the drivel that comes from you, stryker, anonymous et al is bound to wear down an honest man on occasion. if menzie said the sky was blue, you all would insist it was green and even find a website to back it up!
Minzie is nothing if not amusing.
Rich Stryker, Menzie has not yet come to grips with the “Broken Window Fallacy” so he cannot grasp your point 1. (Likewise with the “seen and unseen.”) I sent him a copy of ECONOMICS IN ONE LESSON but apparently the lessons of Bastiat just do not get through.
Ed Hanson, Menzie is a hyper-Keynesian so he uses averages and approximations liberally. When he speaks the words of precision you have to always interpret them as a little less. So your questioning of his precisions conflicts with his approximations. Also bringin up TARP is another concern. Menzie is lost on the wisdon of ECONOMICS IN ONE LESSON. He cannot go back and see that the crisis was caused by government fiscal policy that redistributed wealth into real estate. He is also lost when it comes to understanding that the massive increase in the money supply engineered by the FED simply white-washed the problems with the real estate bubble until it because so large that the whole building crumbled. So in an act of faith Menzie wishes to once again begin the problems that brought us to the 2008 crash. As any true blind-faith believer do not confuse things with facts.
ricardo, i do find it baffling somebody could still claim with a straight face the crisis of 2008 was brought about by “government fiscal policy that redistributed wealth into real estate”! the crisis was not brought about by government fiscal policy. it was brought about by the private martkets becoming overzealous for profits and ignorant of risk. you simply need to admit a reality, capitalist free markets are not this panacea which you have bought into, but are susceptible to destructive crashes. you want the idea of creative destruction, you just don’t want to accept it in all its forms and glory.
Baffling,
I’m not sure I agree with everything you’ve said, but let me explain Ricardo and Stryker to you.
Rick Stryker basically said it in his response to an earlier post when he said: “But I would argue that the right response is to acknowledge that the stimulus didn’t work.”
I understand what this means because a friend of mine explained it to me. He said, “If you are not right, you are wrong.”
Got it?
Baff, if the national government had no impact on the 2008 govession, then
you must also say their stimulus program did the same.
But then governmental units never cause any market distortions only the
private market place is given that distinction.
Can someone expand upon the 25% tax breaks that where part of the
stimulus act? Thank you most kindly.
hans, show me how the federal government created the financial crisis. they certainly had an impact with the stimulus-that was a forceful act and intentional. not the case with the financial crisis. you are a fool if you imply because the government did not impact event A, it also did not impact event B. foolish.
Hear is the breakdown of the 25% monies spent on tax breaks from
the stimulus plan.
http://massresources.org/economic-stimulus-plan.html#taxcredits
Your Baffship, do you even realize (or care) the amount of control governmental
units have in your daily life? When the governmental industry has an effect
control of over 42% of GNP and you think it could not have any impact
upon our economic growth and behavior leaves me quite puzzled.
All the laws and regulations imposed upon their citizens and businesses shall
have no detrimental results upon actions and commence? This is illogical and
dangerous thinking, leading to ever declining growth rate, which are of course
not observed by the governmental advocates.
And if you are still of the opinion, that our dear CONgress and their minions
(the regulators <——what does that noun tell you) had no impact upon the
the real estate market, then we went to quite different schooools.
hans,
“Your Baffship, do you even realize (or care) the amount of control governmental
units have in your daily life? ”
i am fully aware. i drive to work every day on roads built by the government through collective taxation of my fellow citizens. the bridges i cross are safe because the government inspects and regulates their construction and maintenance. The water i drink is treated by a publicly built water plant. The wastewater i and my neighbors create is treated by a government built and maintained treatment plant, so the resultant sewage is not dispersed into the environment like is was years ago. Water and wastewater rules regulated by the government so I have a safe and clean environment. i check my internet daily, which exists because of government funded grants a couple of decades ago investigated the possibility of communications via computers. i go to sleep at night understanding the police are protecting me and my property. i do not live in fear of a foreign country invading the USA because our government has created the most powerful military on the face of the earth. patent and copyright laws protect my intellectual property and allow me to continue to expand and profit from those ideas, without the threat of harassment from business competitors with deeper pockets. if i need a medication or medical treatment, i am confident the FDA and NIH have studied the outcomes and safety of the procedure and treatment, rather than providing snakeoil.
hans i am very aware of the impact of government on everyday life. i think it is you who does not understand the importance of government in everyday life.
Your Baffship:
“government that cartelizes the private sector, centrally plans the economy to subsidize producers, exalts the police state as the source of order, denies fundamental rights and liberties to individuals, and makes the executive state the unlimited master of society.
Lew Rockwell
Your left lobe continues to function in the absence of reality.
Menzie’s mention of Birthers was interesting because most of those trying to keep Obama’s birth certificate issue alive are Progressives in an attempt to slander people they disagree with. What is interesting is that the Democrats are now making an even more stupid argument in Montana about the release of a birth certificate to check whether a Republican candidate has been a resident generations of 5 generations. With Obama it was to see if he was even a citizen for his current generation. Leave it to the Democrats to take something stupid and try to make it even more stupid. So when you think birthers, think Democrat.
Ricardo, is President Obama allowed to hold office legally by birth? Can Ted Cruz legally run for President?
Sorry, here is the link directly to the Montana Democrat web site.
It’s well and good to talk about “recovery” in the abstract, but for 300+ million Americans [we can exclude some economists], the issue is “do I have a job?”
Labor force participation rate [I won’t attempt to fix the formatting since readers here are intelligent enough to see the patterns]:
Year Jan Feb Mar Apr May Jun Jul Aug Sep Oct Nov Dec Annual
2009 65.7 65.8 65.6 65.7 65.7 65.7 65.5 65.4 65.1 65.0 65.0 64.6
2010 64.8 64.9 64.9 65.2 64.9 64.6 64.6 64.7 64.6 64.4 64.6 64.3
2011 64.2 64.2 64.2 64.2 64.2 64.0 64.0 64.1 64.2 64.1 64.1 64.0
2012 63.7 63.9 63.8 63.7 63.8 63.8 63.7 63.5 63.6 63.7 63.6 63.6
2013 63.6 63.5 63.3 63.4 63.4 63.5 63.4 63.2 63.2 62.8 63.0 62.8
2014 63.0