Today we are fortunate to have a guest contribution written by Jeffrey Frankel, Harpel Professor of Capital Formation and Growth at Harvard University, and former Member of the Council of Economic Advisers, 1997-99. He is currently a member of the National Bureau of Economic Research (NBER) Business Cycle Dating Committee.
Commentators are taking note of the five-year anniversary of the fiscal stimulus that President Obama enacted during his first month in office. Those who don’t like Obama are still asking “ if the fiscal stimulus was so great, why didn’t it work?” What is the right response?
Those who think that the spending increases and tax cuts were the right thing to do have given a number of responses, which sound a bit weak to me. The first is that the stimulus wasn’t big enough. The second was that the Great Recession would have been much worse in the absence of the stimulus, perhaps a replay of the Great Depression of the 1930s. (The media are fond of this line of reasoning because it allows them to escape making a judgment. They can just say “nobody knows what would have happened otherwise.”) The third response is that the fiscal stimulus was short-lived, and in fact was reversed by the Congress by 2010.
I believe that each of these three statements is true. But they sound weak because they look like attempts to explain away the absence of a visible positive impact. Listening to these arguments, one would think that no effect of the Obama stimulus could be seen by the naked eye in the U.S. economic statistics of 2009. Nothing could be further from the truth.
Recall the timing. Obama was sworn in on January 20, 2009. The economy and financial markets had been in freefall ever since the Lehman Brothers failure four months earlier (September 15). The President quickly proposed the American Recovery and Reinvestment Act, got it through Congress despite strong Republican opposition, and signed it into law on February 17.
If one judges by the economic statistics, the effect could not have been much more immediate, whether one looks at job loss, GDP, or financial market indicators. Look at the graphs below.
The stock market, which had been falling steeply since September, hit bottom on March 9, 2009, and then started a 5-year upward trend. The index shown in Figure 1 is the S&P 500. The turnaround can’t be missed. Wall Street should get ready to celebrate the anniversary on March 9.
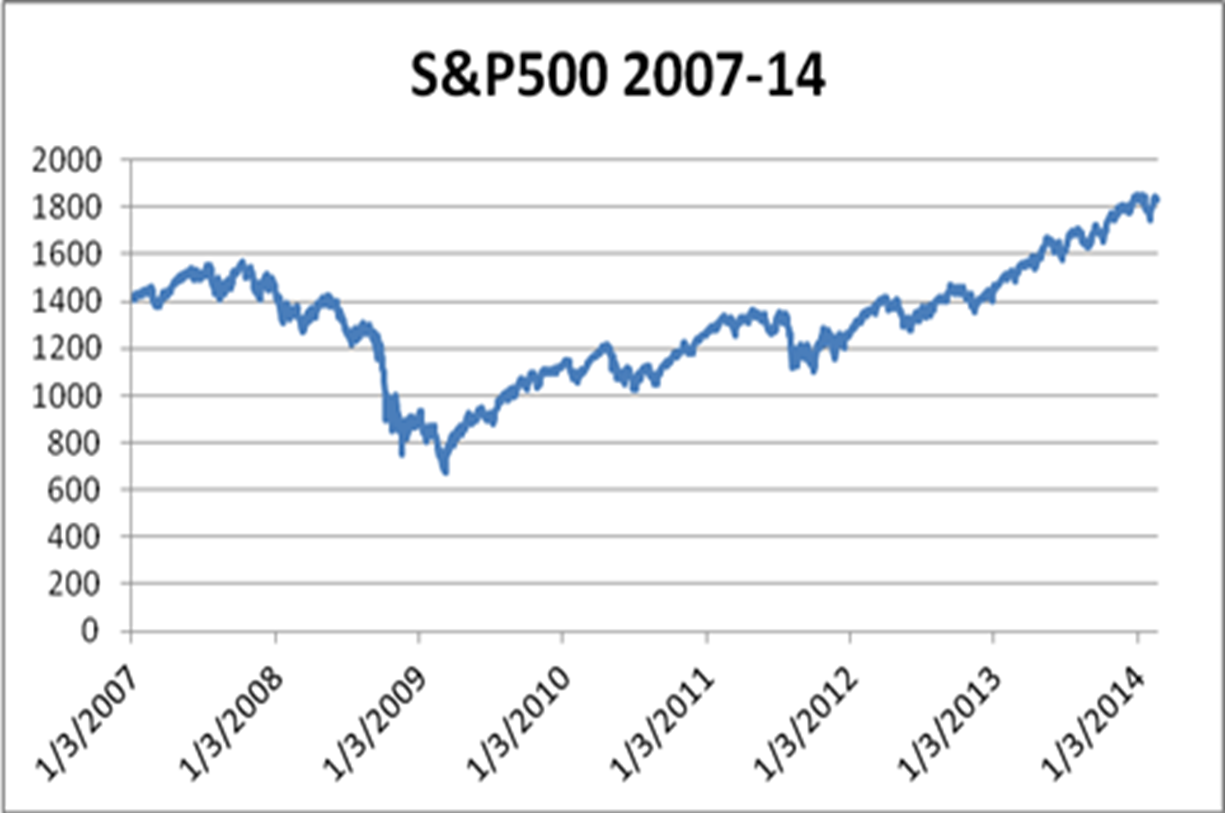
Figure 1: The stock market turned around immediately
[The much-maligned TARP and bank stress-tests also played important roles, unfreezing financial markets. Bank interest rate spreads were back to pre-Lehman levels by February 2009 and back to pre-subprime-crisis levels by June. ]
What about the real economy? That is what matters, after all. Economic output was in veritable freefall in the last quarter of 2008: a shattering 8.3 % p.a. rate of decline (BEA). More specifically, the maximum rate of contraction came in December 2008, according to the monthly GDP estimates from the highly respected MacroAdvisers. (For charts in the form of growth rates, see Figures 1 and 2 of my post on the 3-year anniversary.) The free-fall stopped in the first quarter of 2009. As the GDP graph below shows, economic activity was flat, scraping along the bottom until June, after which growth resumed. The official end of the recession thus came in June. Visible to the naked eye.
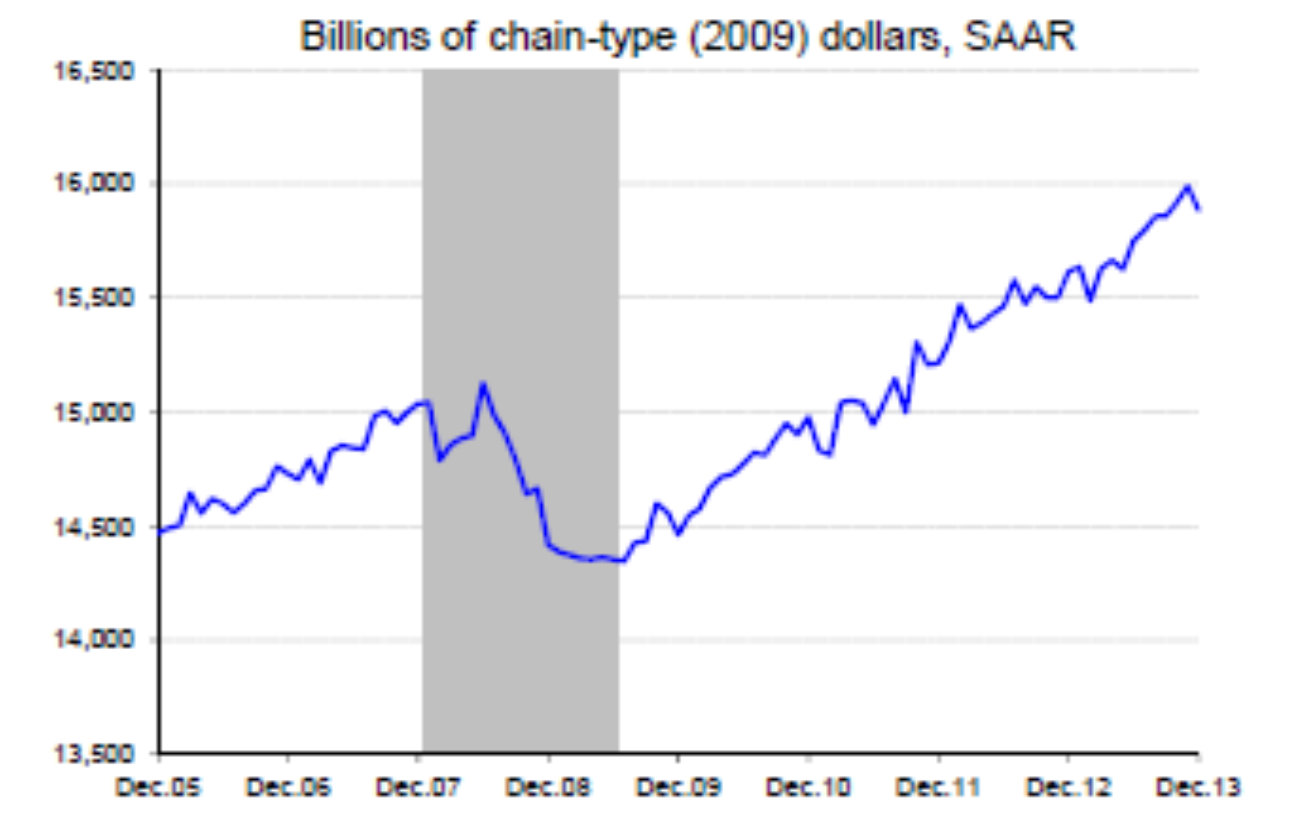
Figure 2: GDP stopped falling immediately. (The recession ended in June.) Source: Level of GDP, monthly (Dec.2006-Dec.2013), estimated by Macroeconomic Advisers.
The rate of job loss bottomed out in March 2009. It is there for anyone to see. The graph shows private sector employment changes. Thus the turnaround does not count government jobs directly created by the fiscal stimulus. Job creation turned positive after the end of the year. Since then, though employment gains have been much too slow, they have on average exceeded the rate during the corresponding period under George W. Bush.
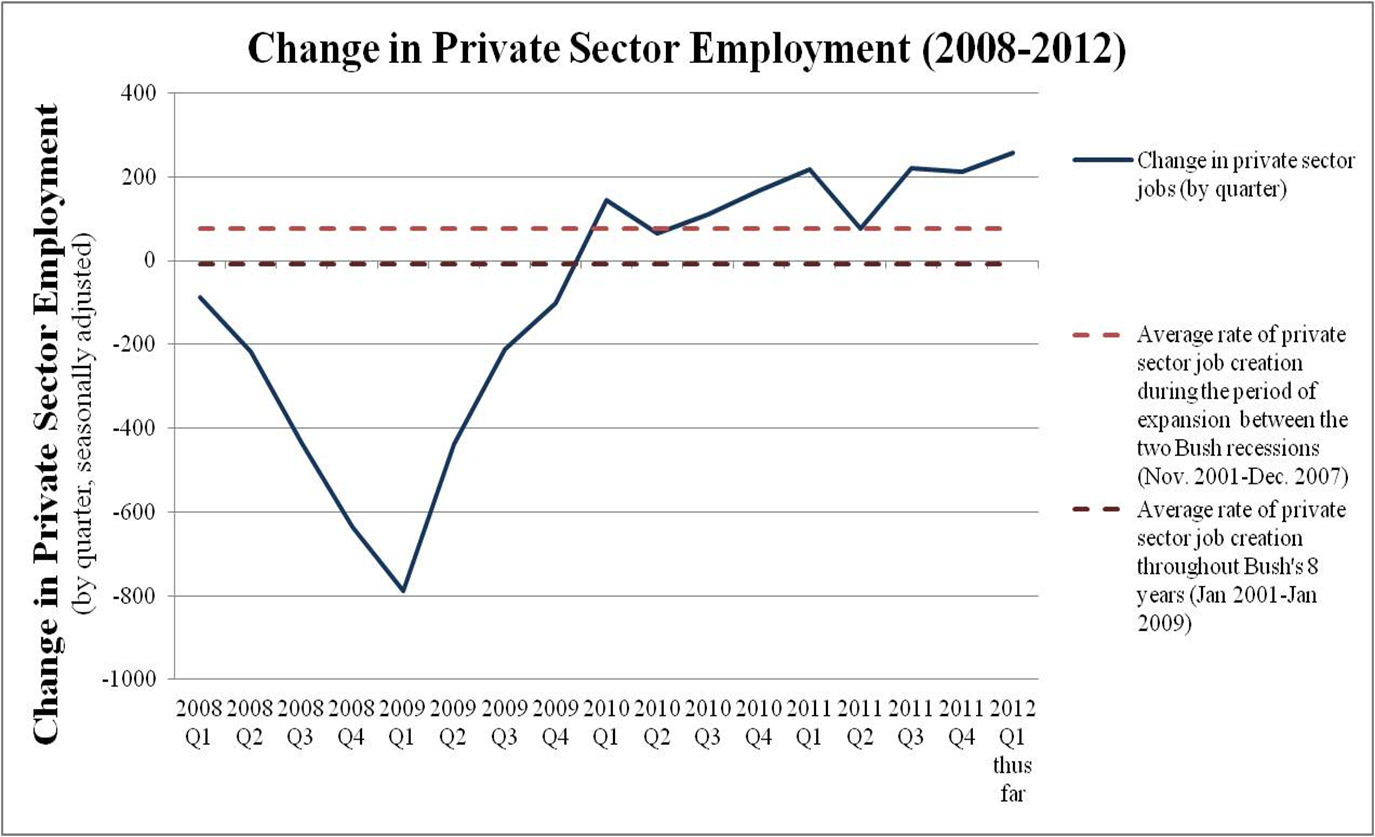
Figure 3: The rate of job loss turned around quickly
Of course there are always a lot of things going on. One cannot say for sure what was the effect of the Obama stimulus. And one can debate why the pace of the expansion slowed after 2010 (my own prime culprit is the switch to fiscal austerity). But whether looking at indicators of economic activity, the labor market, or the financial markets, one cannot say that the fiscal stimulus of February 2009 had no apparent impact in the graphs.
This post written by Jeffrey Frankel.
Jeffrey,
Thanks very much for your post. But I would argue that the right response is to acknowledge that the stimulus didn’t work.
I would certainly agree that the argument that the the stimulus wasn’t big enough or that things would have been much worse without the stimulus sounds very much like an excuse, especially when those arguments are justified by 1970s-style undergraduate macroeconomics, as is so often the case over at the NY Times. But your defense seems very much like post hoc ergo propter hoc. Just because a mild recovery followed the stimulus doesn’t mean the stimulus caused the recovery. Maybe the economy would have recovered on its own. But rather than just make this point and leave it at that, allow me to make some arguments as to why the stimulus didn’t work. I’m going to overexplain this a bit so that people who are not steeped in economics can get a better sense of what I’m saying.
First, if we want to consider graphical evidence, I would propose that we have some different charts for 2009 and 2010. Real GDP did in fact go up. But since Y = C + I + G, i.e., real GDP is the sum of consumption, investment, and government purchases, it would be instructive to show charts for the components of GDP. If you do, a couple of problems jump out. When you look at G for example, you see very little change visible from the stimulus. But the chief argument behind the stimulus is that you have to raise government purchases, which are then multiplied by the Keyensian multiplier. But it doesn’t look like much was multiplied in that chart. So, how did the stimulus actually stimulate?
That G does not appear to change much is not a surprising result really. When you look at the composition of the stimulus, it’s mostly temporary tax cuts and transfers. But Friedman’s permanent income hypothesis and similar ideas suggest that temporary tax cuts are saved rather than spent. Transfers also have very little multiplier effect. And it appears that the transfers to the states were not spent either but rather saved in the sense of allowing states to reduce borrowing.
The chart for I, investment, is instructive too. The chart would show that I is a big part of GDP growth. But the justification given for the multiplier, at least in the 1970s models, is that G multiplies consumption C through the consumption function. Why would I be a big part of the GDP growth? How did the stimulus produce that?
The data, then, viewed another way, contradict the idea that the stimulus worked. But we can also ask about the theoretical reason that the stimulus should have worked. If we dispense with the 1970s Keynesian style models and go to a modern new-Keynesian model, I think we run into difficulties. Just to overexplain a bit more, the renewed argument for the effectiveness of fiscal stimulus was about whether the multiplier is significantly greater than 1 in the presence of the zero lower bound, which is the observation that the nominal interest rate, i, can’t go lower than zero. I can decompose the nominal interest rate i into the real interest rate r and expected inflation, ExpectedInflation. So,
i = r + ExpectedInflation
or
r = i – ExpectedInflation
The problem with the zero lower bound is that r, the real interest rate, needs to get lower in order to stimulate the economy. However, if ExpectedInflation is fixed or falling and i can’t go lower than zero, then r can’t drop as much as it needs to. One solution is for the Fed to have an explicit inflation policy, which would raise ExpectedInflation and thus lower r. Some economists have propose that. But a common new Keynesian model works in somewhat the same way. When G rises, that ultimately causes expected inflation to go up, thereby reducing r and stimulating the economy. That’s how the stimulus mechanism is supposed to work in this model. But did we see any evidence of that in 2009 and 2010? Did TIPs prices provided evidence that expected inflation was rising? Did the survey of economic forecasters provide such evidence? No. We didn’t see rising inflation expectations. So, at least this kind of new Keynesian model has no plausible mechanism for supposing that the stimulus stimulated.
Of course there are other models that could perhaps provide a different mechanism for how stimulus would work. But is that mechanism obvious and can we check it against the facts? Do we have any candidate modern models that could give a theoretical reason why stimulus should have worked with implications that we can verify?
I don’t think you can fairly compare job growth during the Bush years with job growth in the aftermath of the Great Recession. The recession of 2001 was mild compared to the Great Recession, with job losses comparatively small. So, you shouldn’t expect to see very big numbers during the recovery. On the other hand, the Great Recession was very severe with huge job losses. We need to see huge job gains in a robust recovery. But instead we saw a consistently weak job picture with employment increases often just big enough to keep up with the growth in the labor force. Job growth is a particular weak spot in the current recovery and I’d not highlight that to argue for the effectiveness of the stimulus.
To summarize:
1) That some recovery, although disappointing, followed the stimulus is not an argument that the stimulus was responsible
2) The composition of GDP, particularly G, is inconsistent with the stimulus having been effective
3) The composition of the stimulus itself is inconsistent with the stimulus having been effective
4) A typical modern new-Keynesian model that works through expected inflation does not provide a believable mechanism through which stimulus could have operated
Rick Stryker: Regarding investment, I seem to remember some newfangled theory called the “accelerator model”; quite recent, Klein-Goldberger (1955)…
Rick,
Great reply. Well done!
I agree with this. As Krugman said back in early 2009 the stimulus was only about half as big as it needed to be and the fact that it was mostly tax cuts and transfers and not much government spending was going to seriously reduce its effectiveness. What really needed to happen was a big injection of spending into infrastructure programs and putting people to work, hiring back all the laid off teachers etc. Also, the fact that they never repaired the consumer balance sheets was always going to keep the economy in the doldrums, i.e. the banks got a bailout – households not so much (or even at all).
Sorry, this comment reminds me of the quip “whom are you going to believe? Me or your lying eyes?” Frankel has the better argument.
By the way, just to forestall trivial objections from commenters, let me stipulate that I left out net exports in Y just to keep the argument simple.
Another thing, you can see that the january 2008 stimulus started to work, then bear stearnsed…
It’s hard for most people to agree the stimulus worked when we were told it would keep unemployment under 8% and return the economy to growth. The average joe measures economic growth through jobs and paychecks, not GDP numbers. These are the bars the average joe holds the stimulus package to. This, coupled with $8 trillion in new debt, it’s hard to accept what a brilliant investment the stimuLOL package was.
We also expect ObamaCare to reduce our premiums by $2500 a year… but that is another story.
The 2008-9 episode was a crisis of epic proportions. It had many moving parts. Once Lehman fell (Sep 2008), these funneled down into one thing – would the financial system collapse? TARP and the Fed’s emergency programs were life-saving triage. That a massive fiscal stimulus was coming when the new president took office was a foregone conclusion. It was part of the bandaging and salve, along with the Fed’s belated lowering of the funds rate to zero. These four, the $787 billion stimulus package in an expectational sense, ensured that the financial sector patient would live. Recognize that any president taking office would have signed a massive fiscal stimulus package into law. It was appropriate in an emergency like this. The weight of financial, economic, political, and public opinion would have ensured its happening.
Given this multiplicity of policy actions, the real sector reacted. Momentum took the economy down. But already by first quarter 2009, the second derivative of real GDP had turned positive. Two quarters later the first derivative turned positive and the recovery was underway.
The fiscal stimulus did work. Its very expectation went to work even before the election. But I know of no way to quantify this early effect. Macro models give estimates of how much further output would have fallen in late-2008 and early-2009. But they are silent on the crucial question: would the system have collapsed in the absence of the fiscal prong of policy? We will not know until such time as a new mathematics is invented, that can retrospectively look back and answer this question. Present tools are still primitive.
Frankel believes (a) fiscal stimulus wasn’t large enough, (b) the recession would have been much deeper in its absence, and (c) it was short-lived. As for (a), fiscal stimulus did help accomplish the main job – the system did not collapse. It was large enough for that. Had it been larger, would the recovery have been somewhat earlier and stronger. Of course. But at what longer-term cost? The large initial impact multipliers quickly dwindle. And in their trace a long string of smaller negative multipliers play out. These have to do with getting deficit spending back down, and with the necessity of returning debt to its optimal level relative to GDP. The optimal level of government debt is nowhere to be found in the economics literature. But it will be, as Keynesian focus on the short-term and myopia regarding the longer-term is no longer tolerable.
As for (b), indeed the recession would have been deeper. But once again this goes only so far. It begs the question of the longer-run deleterious effects, all of which are part of a comprehensive analysis. Not the partial one Frankel provides. As for (c), it is a point of little importance. Any additional fiscal stimulus today will slow and/or preclude debt from getting back to optimal. In the CBO’s latest long scenario, their deficit projections terminate (around mid-century), because by then the debt ratio has gone ballistic!
The stock market reacted naturally to all this. The bank stress tests were pivotal in halting the market’s decline and setting in place the March bottom. Of course this upturn was in the context of all the policy stimulus, and the natural buoyancy of the real sector once the eye of the storm had passed. The stock market upswing was foreshadowed in December by the Fed’s announcement that there would be a QE. And the market has been boosted by all the QE since. That a bubble has grown over this time is nothing to cheer about. With each passing month of Fed tapering, the market skates on thinner ice. There will be a giveback, though none of the great market technicians have ever been able to advance-time market tops consistently.
Private sector job growth in the comparable Bush and Obama spans from where job growth turns up are 1.7 and 2.0% respectively. On this score, Obama has outperformed Bush. Yet over these exact 47-month spans, real disposable income grew 2.5% under Bush and only 1.8% under Obama. The current recovery having an advantage Bush did not have (though he did have the credit surge), the greatest injection of monetary base money in history. And a ramp-up to the highest peacetime debt ratio in history. From the top down, GDP growth now 18 quarters into the expansion is just 2.3%, compared to 3.1% at this point under Bush. Moreover, net national saving has been virtually zero for 5 years. This is unprecedented since the 30s. It will dampen productivity growth for a long time to come. Productivity growth has fallen to 1% this past 3 years (after its initial recovery kick due to the inventory rebound). At the comparable 3-year period in the Bush recovery, productivity grew at a 2.4% rate.
A stock market bubble, record debt level, still extremely high systemic risk, unwinding of the QEs and normalization of interest rates still to come, dismal productivity growth, five years of no net national saving, real income growth shortfall under Obama (-0.7%) more than his employment surfeit (0.3%). And, the slowest recovery in US history. Frankel as a member of the NBER dating panel has to know all this. Yet for whatever reason, you do not learn it from his post.
Jeffrey: I don’t find this argument all that persuasive. As you correctly point out there were a lot of things coinciding with ARRA in early 2009, in particular QE1 a couple months prior. So at best you have an inconclusive event study. To me the interesting part happens after 2009. After 2009, fiscal spending (however you want to measure it) begins to drop and you see the pace of the decline accelerate from 2012-2013. So much so that it was below pre-ARRA levels by 2013. At the same time the Fed’s QE policies were expanding rapidly. And what happens to real output over this time? It continues to grow, and grow at a greater pace. Now that’s the data you need to help untangle the inconclusive event study in 2009. If really want to argue for fiscal stimulus you have to make sense of all the data points, even the inconvenient ones, and I have yet to hear that from any ARRA supporter.
Rick, Very good.
In truth the “official” recovery did not see any change in the bad statistics. Not until the FED stopped expanding the balance sheet and the Republlicans took over the House and pulled back on spending the any signs of recovery begin. The massive spending, fraud, theft, and crony Socialism did nothing but make things worse. Even now we are not really in a recovery. What we are seeing is a money driven bubble forming to lead us into the next bust and it will probably hit us before we are anywhere near pulling out of our current funk.
The debt service (“rentier taxes”) to private debt as a share of wages and GDP is extracting a debilitating share of value-added US output, so much so that rentier income from a year flowing to the financial industry exceeds the output of nominal GDP. That, the financial industry is a net cost to the economy.
Moreover, yoy growth of real wages and salaries after debt service and “health care” costs is deeply negative, and recessionary, in fact, by historical precedent.
Thus, given the prohibitive cost of the financial industry on the private sector, the US economy is much closer to cyclical constraint and risk of a cyclical contraction than most economists realize (or admit), which implies that the secular growth gap is much smaller than is generally assumed.
The next recession will not result from rising short interest rates and an inverted yield curve but from another round of falling real business and household income as a function of the secular debt-deflationary regime, i.e., “secular stagnation” owing to Boomer demographic drag effects; Peak Oil; excessive debt to GDP; EXTREME wealth and income concentration of overvalued financial assets to the top 0.1-1% to 10% at no velocity; labor’s share of GDP at a record low; decelerating productivity; and fiscal constraint from excessive local, state, and federal public debt and debt service to GDP and wages.
There are no supply-side, Keynesian, monetarist, or socialist prescriptions for the aforementioned factors. Debt forgiveness, default, pay down, or a combination in a timely fashion is the only solution to excessive private and public debt to GDP and wages. Debt deflation also means asset deflation that persists, as in a 40-50% hit to the assets of the top 1-10% and an acceleration thereafter of labor’s share of GDP.
Of course, focusing on financialization, excessive debt, and debt service costs requires the courage to undertake a deep structural analysis of the financial sector, including the Too-Big-to-Exist primary dealer US and foreign banking syndicate, which then necessitates scrutiny of the values, motives, and actions of the principal participants, the interlocking management and ownership of the syndicate’s largest institutions, and the overwhelmingly disproportionate influence and power the principals exercise in DC and elsewhere.
Unless economists focus on the lasting pernicious effects of private debt service to GDP and wages (and the associated decline in labor’s share of GDP), which in turn is a function of deindustrialization and hyper-financialization of the economy and resulting obscene wealth and income inequality, all other discussions are akin to the proverbial pi@@ing in the wind.
Where are the equivalents of Adam Smith, David Ricardo, Karl Marx, Henry George, and Joseph Schumpeter of our time? Economists today are too comfortable in their role as imperial ministerial intellectuals whose primary job is to use dubious models based on fallacious assumptions to rationalize policies in support of Anglo-American empire and the rule by parasitic rentier elites.
Everything that Professor Frankel said is true…Also true, is a tepid recovery because of these stated acts.
Had you allow the market place to self correct, without the government’s heroin, I suspect the recovery
would by now have been more robust.
I hope everyone is enjoying this phony economic recovery, as the price for economic interference will be
paid.
Rick Stryker
1) That some recovery, although disappointing, followed the stimulus is not an argument that the stimulus was responsible
Not quite. I’ll grant you that it isn’t proof that the stimulus was responsible, but it certainly is evidence that the stimulus helped; and the presentation of evidence is itself an argument (almost by definition). If you don’t think the stimulus at least contributed to the recovery, then you need to make a convincing argument that the economy would have recovered at least as well without the stimulus. And you need to do so without invoking magical thinking. Good luck with that.
2) The composition of GDP, particularly G, is inconsistent with the stimulus having been effective
Well, there is this thing called a fiscal multiplier at the ZLB and its effects show up in C and I. But the appropriate counterfactual is to ask what would have happened absent the stimulus. Clearly G would have been lower, and this would have mechanically lowered GDP. Much of the stimulus went to support state spending in the form of federal grant aid. Or are you arguing that the incredibly stupid Tea Party governors and state legislators saw the federal stimulus dollars as an opportunity to cut state spending from what it would have been without the stimulus dollars? I suppose that’s possible, but I’m not sure that’s a knock on the stimulus package. Sounds more like an argument to vote out the idiot Tea Party types in state governments.
It’s also important to recall that what we call “government spending” can be a little slippery, and the NIPA tables do not always capture this. For example, the NIPA tables only record federal cash disbursements, which typically occur only after the economic activity already happened. Depending on the “color” of the federal dollars this lag can be up to 10 years.
3) The composition of the stimulus itself is inconsistent with the stimulus having been effective
You’re using some tricky language here. I agree that a better mix of tax cuts and new spending would have been more effective. But this is a strange argument coming from someone who was demanding that the stimulus include more tax cuts and less spending. So you and the usual suspects are blaming Obama for doing what you recommended??? In any event, saying that ARRA could have been more effective if better structured is not the same as saying that ARRA was completely ineffective. The wording of your summary strikes me as a passive aggressive way of saying imperfection equals ineffective. I don’t live in a world where the perfect is the enemy of the good.
4) A typical modern new-Keynesian model that works through expected inflation does not provide a believable mechanism through which stimulus could have operated
But it does sound like a mechanism through which stimulus could have operated using one of those old 1970s vintage IS-LM models. At least the old school IS-LM model would have gotten the sign right, which is more than can be said for many of the NK models, not to mentin the Chicago School models along with their Austerian hangers-on. For example, the old IS-LM model correctly predicted that massively increasing the money supply would not increase inflation as long as we were operating along the flat part of the LM curve; i.e., a liquidity trap. It might be simple and ad hoc, but it got the prediction right.
Finally, we shouldn’t forget that we do have something of a natural experiment to judge the stimulus. Just look to Europe, which embraced austerity in a big way. The US economy’s performance might not be much to write home about, but compared to Europe we look like nirvana. And given that this was a ZLB financial recession rather than a deliberate Fed induced recession to cool off an overheated economy, the US economy’s performance has actually been slightly better than we had a right to expect.
Jeff Hmmm…if I’m reading you right, you seem to be saying that Obama’s fiscal stimulus shouldn’t take any of the credit because the Fed’s policies were stimulative as well. Okay, but you need to remember that the next time you go on a rant about QE and how the Fed is debasing the money supply, blah, blah, blah. You’ve also got an uphill fight in showing that the Fed’s QE policies were the dominant policy tool. While it’s likely that QE-whatever worked to lower the long term interest rate, it’s hard to argue that it lowered the long term rate by much. And the Fed’s policies don’t seem to have raised inflation expectations much either.
JBH Just a suggestion. You might want to relook your post. The problem is that you don’t seem to distinguish between aggregate demand stabilization policies (which are Keynesian) and long run potential GDP issues. You jump back and forth without appearing to realize the difference between an AD curve and an AS curve. Keynesians do not believe in endless and forever increasing deficits. Running large structural deficits to support consumption spending (as opposed to infrastructure investment) is not justified when the economy is at full employment. Why else do you think so many of us thought Bush’s budgets were godawful and reckless? But your post takes the attitude that Keynesians are all grasshoppers only concerned about warm summer days. You’re also seized Say’s Law. The stimulus did not take money out of the hands of consumers and investors; the stimulus provided the demand needed to get that money out of the vaults and out from under the mattresses.
Slugs: I have no idea what rants about the Fed debasing the money supply you are talking about. My guess is that you are suffering from some sort of association fallacy. Second, I don’t think it’s an uphill battle to show the effectiveness of QE at all. The facts are quite clear, after 2009, fiscal stimulus has been dropping significantly, QE has expanding, and rGDP continues to grow. Pretty clear to me. As for the effect on inflation, prices rose quickly after QE1 and have stabilized around 1-2% since. I don’t know what more you want than that!
Jeff That’s not what I’m seeing. The Fed announced QE1 in Nov 2008. The annualized Core PCE did rise for a few months after QE1 was announced, but then it collapsed again in mid-2009. Then it peaked again in late 2009. QE2 wasn’t until Nov 2010, by which time Core PCE was already moving sideways around 1.5%. QE3 and QE4 did not change that sideways movement. Now I’ve been a supporter of the Fed’s QE policies, and I do think they probably had some positive effect at the margin, but there’s no way it deserves the lion’s share of the credit for the recovery. I doubt that even Ben Bernanke would give the Fed that much credit.
Slugs You must be doing something wrong. Monthly PCE growth went from -1.1% in 11/2008 to +.1% by 01/2008. That is the single largest turnaround in the entire history of PCE data! And it happened before ARRA got off the ground, so I think its safe to attribute that to QE1. After 01/2008 PCE growth averaged around 0.1% per month with relatively mild month-to-month fluctuations. There is no “collapse again in mid-2009.” You are right in that QE3 and QE4 did not change the movement in PCE, but a flat PCE growth is exactly what you would expect when monetary policy is doing what it’s intended to do. So like I said, you can’t ask for a better picture that monetary policy was working exactly as planned after 2009. By the way, I’m still waiting for any attempt to reconcile the fact that fiscal spending was declining after 2009 while rGDP was accelerating.
Jeff Monthly PCE growth went from -1.1% in 11/2008 to +.1% by 01/2008.
I think you meant to write “by 01/2009.” Anyway, as I said in my post, I used core PCE (seasonally adjusted). Core, not headline. And PCE, not CPI. The Fed likes to track things by core PCE because that’s their preferred measure of inflation inertia. Continuous compounding to annual rates, here’s what FRED shows for core PCE:
Sep08….1.5%
Oct08…-0.1%
Nov08….0.0%
Dec08…-0.3%
Jan09….0.4%
Feb09….1.2%
Mar09….1.5%
Apr09….3.1%
May09….1.2%
Jun09….1.6%
Jul09……0.2%
Aug09….1.4%
Sep09….2.2%
Oct09….3.5%
And the inflation rates start to fade with the stimulus dollars as you move through FY2010. Note that the immediate reaction after QE1 was announced was a sharp drop to outright deflation (-0.3%).
Like I said, you have an uphill battle if you want to show that the Fed’s QE1 policy drove the recovery. I would agree that the Fed’s QE policy was helpful, but the inflation numbers track with the stimulus better than they track with QE1. And if you look at Menzie’s chart on inflation expectations, those also seem to move more with the stimulus than with Fed policy.
Now I will grant you that showing the history of actual core PCE isn’t quite the same thing as showing inflation expectations, which is what you’d use in an NK model; however, something else that Menzie’s chart reveals is the wide divergence in inflation expectations immediately after Lehman Bros. After awhile all three measures converge, but not at the beginning. I would argue that in a highly uncertain market in which investors are in completely unfamiliar territory, the best guess of expected inflation is something very close to a naïve forecast, or at least one that puts a lot of weight on recent observations. So in that context I don’t think the historical PCEs are too far off from the inflation expectations that people had in their heads.
Yes, the Fed does use core PCE but it also looks to keep headline PCE around 2%. So I wouldn’t claim one is right and one is wrong. I would say that if your story is not invariant to the type of inflation, that is a problem. Even looking at your core numbers, or Menzie’s inflation expectations, I don’t see anything that looks like inflation is tracking better with stimulus but I guess I haven’t swallowed to kool-aid. Where is the drop in inflation after the ARRA? How do you explain the slight bump after 2011? And really all this focus around inflation distracts from the main point, which is how do you explain the fact that rGDP did not fall in response to the complete reversal in fiscal spending after 2009?
Jeff it also looks to keep headline PCE around 2%
Well, that’s what they say they’d like to do, but so far the Fed has been unable to do that. It used to be that the target was around 2.5%, but gradually that shifted to 2%. But that was supposed to be the mean target. What’s actually evolved is that 2% has effectively become a ceiling rather than a target. The Fed has been struggling mightily, but about the best the Fed has been able to do is maintain a mean of maybe 1%.
I would say that if your story is not invariant to the type of inflation, that is a problem.
I think it’s the other way around. A story that says the recovery was due to the Fed’s ability to adjust inflation expectations critically depends upon the Fed picking (and achieving) the type of inflation that matches what people expect. And one of the things that Menzie’s chart shows (in his latest post) is that inflation expectations were all over the place right after Lehman. They converged over time, but they were way different in late 2008.
how do you explain the fact that rGDP did not fall in response to the complete reversal in fiscal spending after 2009?
There wasn’t a complete reversal. It was more like an unwinding. Remember, ARRA was spread out over three years. And there were subsequent fiscal stimulus policies as well. For example, the Bush tax cuts were temporarily extended. Since these were expected to end, the agreement to temporarily extend them would have shocked expectations. Also, there was the FICA tax holiday, which clearly put more money in the hands of consumers with a high MPC. And the economy did recover over time and needed less stimulus to stay on its feet. But I would also argue that the unwinding of fiscal stimulus after 2010 was responsible for shaving a point or two off of GDP growth from what it would have been.
2slugbaits,
To answer you points:
1) I already did show that the economy would have recovered on its own without the stimulus since I showed that the stimulus was ineffective and the economy nevertheless recovered.
2) You refer to the counterfactual and say “clearly G would have been lower” and, rather than offering evidence for your claim, you talk about tea party governors. If you think state G went up, where is the evidence? If you think state or federal G would have been lower without the stimulus, where is the evidence?
3) No, the Administration did not do what I have recommended with the stimulus. I have consistently advocated permanent tax cuts and cuts in the growth rate of spending such that over time spending as a fraction of GDP would return to something like 20%. I have not advocated big cuts in spending in the short run.
4) It hardly matters what the old-style 1970s Keynesian model would say. That model is a relic of the barbarous age of macroeconomics.
Professor,
nice discussion. but you see on this blog the difficulty in finding the truth, as evidence from the responses. you have people who truly believe the economy would be better today if we had simply stepped back and let the banks fail and let gdp collapse. in their mind the economy was magically about to get better at exactly the same time stimulus was applied. they offer no rationale for why the economy would have made a u-turn in performance if the stimulus would not have been applied, other than the confidence fairy.
you get the reply by Hans “Had you allow the market place to self correct, without the government’s heroin, I suspect the recovery
would by now have been more robust.”
how do you deal with people living in this fantasy land. the economy was tanking and we were doing nothing about it, pre-stimulus. so your plan is to continue to do nothing? that would change the outcome? really? i guess at some point you would get a robust recovery, but only after you cratered gdp to 1990’s levels. go ask some of those euro periphery countries if their current high growth rates are welcome after losing over a decade of gdp!
stryker,
“1) I already did show that the economy would have recovered on its own without the stimulus since I showed that the stimulus was ineffective and the economy nevertheless recovered.”
please define recovered. is it a return to pre-recession gdp levels? or robust growth? because a slow recovery from a higher gdp is preferable to a more robust recovery from a lower gdp, at least for most folks. so how low would gdp would have dropped without stimulus?
“If you think state or federal G would have been lower without the stimulus, where is the evidence?”
what happened to state, local and federal employment during this time period? how would this affect G? would this result be different without stimulus (ie would state and local governments not layed off folks absent a stimulus?)
2slugbaits
February 27, 2014 at 3:17 pm
If you don’t think the stimulus at least contributed to the recovery, then you need to make a convincing argument that the economy would have recovered at least as well without the stimulus.”
But the stimulus cycle isn’t over until you pay back the stimulus. You need to show that we can pay off the stimlus debt and still be better off than had we just done nothing. You can’t say a leveraged investment (aka stimulus) was successful until you repay your borrowed funds. If you don’t agree, invest 100,000 with me and I’ll raise your income 100 a month and you can tell your wife what a great investment you made because your income is higher. SEE HONEY WE HAVE $100 MORE EVERY MONTH!
Anonymous
You’ve built a false comparison. I suspect it’s because you are thinking of GDP as a stock variable like a pile of cash that could be invested in alternative private sector projects. Not spending money on the stimulus did not crowd out other investment opportunities, so your comment is nonsensical. Spending $710B in stimulus (i.e., $787B minus $77B AMT) generated at least $710B in additional flows of goods and services. Not spending $710B simply would have meant $710B less in goods and services. And that loss would have been forever. Remember, GDP is a flow variable, so you cannot freeze it in one period and transfer it to another period in the way that you can a stock variable. Not spending $710B in stimulus would not have made that $710B available at a later date. I realize this is a hard thing for a lot of people to comprehend because we are in the habit of thinking of “saving” in the same way that households save. But in the aggregate the economy cannot save that way. All income is either saved or consumed, but in this context “saved” means invested. If people save a lot, then interest rates come down and investment increases. But if there’s a savings glut and the interest rate hits the ZLB, then lower interest rates cannot clear the markets. The only way the economy can equilibrate savings and investment is by reducing income. Money that just sits in a vault or under the mattress is not saved as a flow variable even though it still physically exists as a stock variable. As a flow variable it simply disappears. And the way it disappears is by shrinking income. Krugman has written a lot on this and used simple graphs to explain why. So the way you framed the question shows that you don’t understand GDP as a flow variable. Not increasing government spending would not have had an alternative use because it would have simply disappeared forever. If you’re applying the logic of investing stock variables (which is how most people intuitively understand saving), then you haven’t yet graduated from Macro 101.