Ed Hanson argues that 2013 Gross State Product (GSP) data for 2013 will show a Wisconsin renaissance:
I am looking forward to each release of data for each state. I note that preliminary data both Minnesota and Wisconsin snapped up in new employment in December, Wisconsin more so. State GDP release is months away but will be relevant to this discussion. It is an unfortunate but reality that discussions derived from economic releases are limited mostly to pre-2013 data. The discussions of our differing positions will become better as new economic releases for 2013 become available.
GSP will only be released in June, as Mr. Hanson correctly notes, but why wait? One can use already released data — namely the Philadelphia Fed coincident indices, calibrated to match trends in GSP, to estimate what 2013 GSP data will reveal.
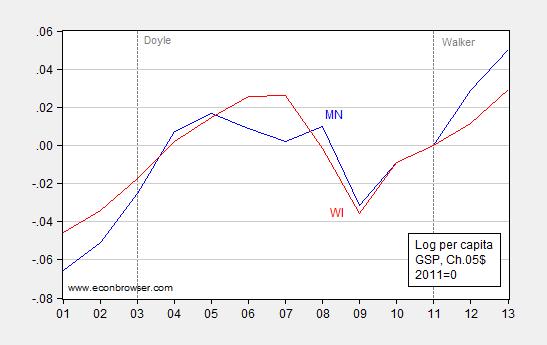
Figure 1: Log per capita Gross State Product in Wisconsin (blue red), and in Minnesota (red blue), in Ch.2005$, rescaled to 2011=0. Vertical dashed line at 2011. Data for 2013 is based on Philadelphia Fed coincident indicators. Pre-1997 data in Ch.1997$ is spliced to post-1997 data. Source: BEA, Philadelphia Fed, Census, and author’s calculations.
Since 2011, Minnesota’s per capita GSP has grown a cumulative 2.1 percentage points (log terms) more than Wisconsin’s.
Mr. Hanson also alleges that I have been avoiding the Wisconsin-Minnesota comparison of late, due to imminent improvement of Wisconsin economic performance. This post should put that notion to rest.
Well, they want to just look at the change in WI, which is improving during Walker’s time. It only looks bad when you compare it to everyone else. Is there any way you could add 95% confidence intervals around the lines? We would like to know if the difference between MN and WI is significantly different from random variations in the data…
Thank-you Menzie
for posting about 2013. I have looked closely at the Figure 1. I thought I could observe a slope change for both states; Wisconsin increasing and Minnesota decreasing in 2013. It would be so much easier to visualize if the a chart normalized to 1/1/2013.
To begin to verify what I think I see, I did a quick check into part of the components for the Coincidence Index. In this case some employment data, which I will relate.
Wisconsin increased its employment from 2838417 to 2880303 from Jan through Dec. (Dec. preliminary).
Minnesota increased its employment from 2985701 to 2971572 from Jan through Dec. (Dec. preliminary).
Thus increase of:
Wisconsin: 41886
Minnesota: 14950
Perhaps a informative statistic of economic employment activity is the labor force change, again Jan through the preliminary Dec.
Wisconsin: +21021
Minnesota: -12849
So, Wisconsin with a 2013 tax policy of less tax rate on personal and business had more people gained employment and joined the active labor force, than Minnesota with a 2013 tax policy of higher tax rates on personal and business with less people gaining employment and fewer people in the labor force.
Predictable when significant supply-side change in tax rates happen, both decreasing and increasing.
Ed
Professor Chinn,
“Log per capita Gross State Product in Wisconsin (blue), and in Minnesota (red)”.
Should this say, Wisconsin (red), and Minnesota(blue)?
The color assignments in the chart and the caption are reversed. Which is correct?
This probably doesn’t mean anything, but if you took both the blue and red lines at the zero baseline in 2011 and shifted both lines to the left so that they connected with the “.00” vertical line around mid-2003, then it looks like you’d get a pretty straight line. In other words, both would have reverted to their respective growth paths prior to mid-2003. It’s the sort of thing you might expect with a level shift, but a level shift along the horizontal temporal axis rather than the vertical axis. A temporary lull where both states move sideways for awhile. But like I said, it’s probably nothing.
AS and Richard L. Strombotne: Apologies, the legends in the graph are correct, the text in the figure notes were reversed. I have corrected that now. Thanks for flagging the error.
Ed Hanson: First, I take it that you have dropped your assertion that I am somehow avoiding comparisons of WI/MN. You made the charge, but have not responded to the multiple queries in this regard, so I would like an explicit admission on your part that you were mistaken.
Second, there is a reason why we look at composites, such as the coincident index — additional information is generally useful in tracking an economy. Even when looking at a component, it’s typical to look at percents in addition (or rather than) just absolute level changes.
Third, your comment seems to imply that labor force is a component of the coincident indices; it is not.
Finally, I know you like to focus on tax changes applying in 2013. That’s fine for you, but I’m looking at the totality of policies undertaken — in particular fiscal policies more generally defined. There, substantial policy changes were implemented in 2011 — that is well known to those of us who lived here during those events.
XO: Don’t see how to generate confidence bands for reported data (could do one for 2013 estimated GSP based on coincident indices). On the other hand,I could run a regression of log WI GSP on log MN GSP, a time trend and a dummy taking on a value of 1 for 2012 and 2013. The dummy coefficient is negative, and significant at the 10% msl, using HAC robust standard errors.
Menzie
Point to point:
Your first:
Menzie; “First, I take it that you have dropped your assertion that I am somehow avoiding comparisons of WI/MN. You made the charge, but have not responded to the multiple queries in this regard,”
My only two comments in previous posts.
Ed; “One last note. This is the second straight Wisconsin economic post steering the discussion away from the comparison of Wisconsin and Minnesota. I see that Bruce Hall has alluded to that. I suspect it is possible that you have looked at the economic outlook of Minnesota since its significant tax increase, and noted that its performance is flattening and its leading indicators are plunging. I remind you that your initial idea comparing the two states was and is an excellent use of comparative economics. It is time to return to that idea, and let the facts and figures play out.”
Ed; “Mostly I am looking forward to continued post by you comparing Wisconsin and Minnesota as you affirmed that will continue. As I have said, it is an excellent example of comparative economics between States of similar geography and history.”
The first comment was a suspicion of a possibility that you were refraining from the two state comparisons, not an assertion.
The second comment was an eager response that you affirmed the comparisons would continue, which was a response to your query. Perhaps you missed this or thought it inadequate.
So to be clear, if you took my first comment as an assertion and I was mistaken, then I was mistaken. If you did not miss my response to query in my second comment, then to be clear, I am overjoyed for and eager to read the continued two state comparisons.
Your second:
About composites. No disagreement about the use of composites. But you, Menzie, have put great emphasis on employment statistics in Wisconsin. Just because employment figures are a component of some composite, does not mean that a component has no significance in itself. As your charts have shown, since 1/2013 the Index has shown greater month to month improvement over earlier periods. I simply pointed out that employment figures you so often emphasize have grown also. Although the topic is getting somewhat stale, please read my latest post in the Wisconsin-US Gap topic, it uses composite. It answered your request about comment on its Figure 3.
Your third:
No, I made no assertion or implication that labor force participation was a direct part of the Coincidence Index. It was a separate, interesting, significant fact on its own merit. It was written in a separate paragraph. And was a general comment about a particular comparison between economic and employment activity between the two states in question.
Your final:
Yes, there were fiscal policy changes commenced in 2011. Of course, need I remind you, they were delayed by the tantrums of some of Democratic elected legislators who refused to accept the results of the election by their running and hiding out of state, in an attempt to thwart legislation that was fully discussed during the electoral process. The voters of Wisconsin chose that agenda, and only shame can be upon those in elected office who refused the democratic republic process. To what effect on Economic activity of Wisconsin, the recall efforts had I can not say. But I do know that the voters affirmed their decision for Governor and the Republican majority of the legislature. It was the Unions who were wrong or perhaps “mistaken” a better word (have they said they were mistaken). But these policy changes were not as significant as the 2013 fiscal policy changes. By the way, if fiscal policy changes are your guide, why start in 1/2011, the policy changes did not come until months later. Whether described as substantial or significant, the 2013 policy changes certainly merit its own normalized chart.
Ed
Menzie,
You often criticize those who disagree with you sometimes even using their typographical errors as a foundation for a post. Recently you have had a number of such errors. I notice that your critics do not make an issue of such things to their credit.
they were delayed by the tantrums of some of Democratic elected legislators who refused to accept the results of the election
Yes, it would be nice if the voters’ will prevailed. Of course, that would suggest that gerrymandering should be ended, the “Hastert Rule” (whereby legislation is blocked by a minority of legislators) should be abolished, and that the ACA (aka “Obamacare”) should be fully implemented (as was “fully discussed during the electoral process”).
Most importantly, it would mean that Climate Change would be openly addressed, as desired by most voters. Of course, the unelected oil industry won’t allow that to happen. There are too many $trillions in fossil fuel reserves that would be reduced in value. And that brings us back to a un-representative government, whose ability to properly implement good public policy and regulation has been crippled by those who benefit from a paralyzed government.
Address climate change! How do we “address” climate change? The climate is constantly changing, so ‘addressing’ it is easy: watch the Weather Channel. What silly terminology–Climate CHANGE. What happened to “Global Warming”? Can we openly address the scam that is climate science? That the global warming alarmists cannot explain the 17 pause in global warming, so concoct a new terminology–climate change–to continue their scare mongering. There is ‘science’ and there is ‘climate science’. Sadly, the standards and ethics of the latter has brought the former into disrepute.
The 17 year pause/hiatus/whatever in global temperatures has demonstrated the current temperature cycle is no different from the many tens of thousands of other similar cycles seen throughout geological history. The waste of money in the climate cause is truly incredible and what has it achieved apart from rising energy bills, throwing billions in taxpayer monies down a rat hole of cronyism, and ugly blots on the landscape?
How do we “address” climate change?
It’s pretty straightforward: price it into the free market with a carbon tax.
What happened to “Global Warming”?
Excess carbon in the atmosphere has many effects, which include temperature rise in some places and not others, and acidification of the oceans. Global warming is a somewhat useful term (just ask the ski resorts of the world how declining snow levels are destroying their business), but it’s too narrow.
NickG, Anon & Lazy was not me, but I certainly 2nd their opinion.
Well, do you have a specific reason?
As far as I can tell, good science says that Climate Change is a serious problem. Have you looked at the discussion by well known conservative Judge Posner about this? He says that he simply looked at the peer-reviewed literature, and concluded that the clear consensus of the relevant scientific community was that Climate Change was a serious problem. As a sensible conservative who likes to be rational, he went with the scientific consensus, rather than with….Fox news.
Have you looked at the climategate emails where we learned the global warming alarmists crowd was engaged in a concerted effort to prevent publication of papers by climate skeptics in peer-reviewed journals? Just the way the peer-review process is supposed to work. So, looking at the peer-review literature is meaningless when the process has been corrupted by the global warming crowd.
I’m somewhat familiar with “climategate”. I’m not aware of an effort to inappropriately prevent publication. On the other hand, given the generally very low quality of the research presented by climate “skeptics”, I wouldn’t be surprised if some climatologists objected to some papers based on low quality – which is how peer review is supposed to work.
I am aware of a recent Koch funded project which was intended to provide evidence against Climate Change, but which instead supported the general consensus that Climate Change is a very serious problem.
If you have a good article/source that discusses this (ideally in a good quality source, like the Wall Street Journal (outside the oped pages!) or Christian Science Monitor, to name two sources that are both highly regarded and generally perceived as politically “neutral”), I’d be curious.
Ricardo: I think in 20 posts, I have made one typographical error (figure note texts while the legends in the figure are correct), and mis-identifying one date for a Macroeconomic Advisers’ post. For these errors, I apologize to the Econbrowser audience.
The others are clarifications, where I have updated the regression results with more appropriate data. In yet another update, the change was not a correction, but a repetition of text for two commentators who did not think I had sufficiently clarified I was writing about government spending on goods and services as opposed to government spending including transfers. I edited to remove any ambiguity (at the cost of readability, I will say).
While I am not perfect, I do try to spell correctly, both terms, and people’s names.
Menzie,
My post was not about typos. I am the world’s worst on typos. My post was about using typos to criticize others. Let’s just agree to seek truth and leave the nit-picking behind.
ed hanson,
“The first comment was a suspicion of a possibility that you were refraining from the two state comparisons, not an assertion.”
when you use a “suspicion of a possibility” in a condescending tone, people will respond as such-particularly when you are incorrect but trying to make a statement to support your perspective.
ricardo,
menzie does not really criticize based on typos. he really criticizes based on stupid statements made by others. but it is not out the the realm of possibility that stupid statements and typos occur in tandem-although that is simply a suspicion of a possibility as ed would say.