I’ve read several comments lauding the move toward a structural budget balance in Wisconsin under Governor Walker’s administration. I decided to take a look at what the actual evidence for a surplus is, and what the economic impact has been of policies purported to improve economic performance.
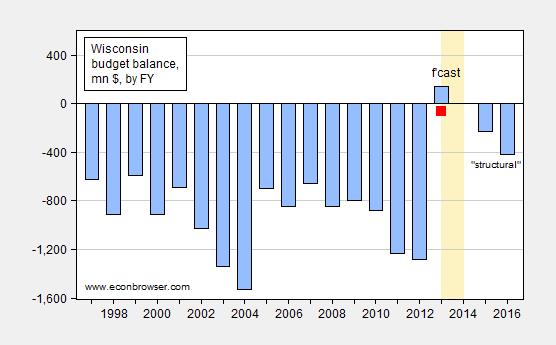
Figure 1 depicts the budget balance by fiscal year over the past decade and a half, plus projections from the Legislative Fiscal Bureau.
Figure 1: (Negative of) General Fund Amounts Necessary to Balance Budget, by Fiscal Year, in millions of dollars (blue bars); and estimate taking into account shortfall of $200 million (red square). “structural” denotes ongoing budget balance, assuming no revenue/outlay change associated with economic growth. Source: Legislative Fiscal Bureau (May 22, 2014), Table 6, Wisconsin Budget Project, and author’s calculations.
See this description of the Wisconsin budget process.
Recent actions have pushed the balances in the 2015-17 biennium into deficit.[0] But even the news for the 2013-15 biennium has turned dark. By June 2014, it was apparent that there were both tax revenue shortfalls and outlays in excess of planned [Peacock/WBP]. I’ve included an alternate projection for FY2013-14, shown as a red square in Figure 1. There are also some downside risks to the balance on the spending side (primarily Medicaid/Badgercare), which I have not included, so this is not the worst case scenario.
To some extent, the shortfall in revenues is not surprising. The administration has implemented a contractionary fiscal policy (cutting taxes [1], cutting spending to increase the budget balance which drives down output and hence revenues. The main tax cuts were:
- An income tax rate reduction, included in the state’s two-year budget that passed in 2013, which reduced revenue by $648 million over two years;
- A 2013 property tax cut of $100 million; and
- A 2014 tax package that further cut income tax rates and also included another property tax cut. The combined package reduced revenue by $507 million over two years.
The cuts amounted to $1.9 billion. [2]
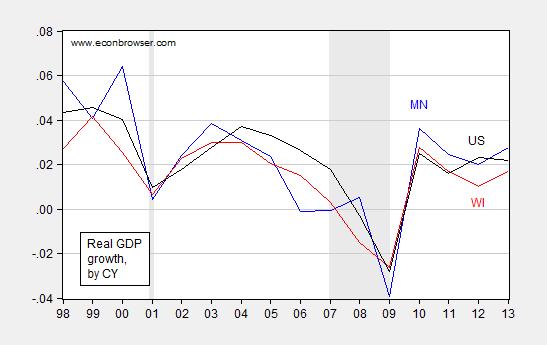
My predictions of what would occur have been borne out in actual developments in aggregate economic activity. Wisconsin has experienced substantially slower growth than it otherwise would have.
Figure 2: Growth rate of real GDP for Minnesota (blue), Wisconsin (red), and United States (black), calculated as log first differences. NBER defined recession dates shaded gray. Source: BEA, NBER, and author’s calculations.
Note that a regional comparator, Minnesota, that embarked upon a different fiscal path has experienced substantially faster growth, as documented above. Forecasts indicate continued lagging.
To sum up: A procyclical fiscal policy has been undertaken in the past three and a half years, with predictably counterproductive results. The depressed level of economic activity has resulted in a revenue shortfall.


I know very little about WI budgeting and did read the link and a few other sources. Am I correct in saying there’s a balanced budget requirement but that laws may be passed “notwithstanding”, meaning they can choose to exceed budget constraints, and that the Assembly has exempted this budget? But I don’t understand how there can be such large deficits over so many years. (And I don’t exactly understand how the chart translates into biannual budgets.)
Jonathan: Try this link. One-off revenue measures can also be used to achieve a balanced budget; one-off outlay measures as well, although those are harder to conceive of.
The observation for 2013 pertains to FY2013-14, which is the first year of the 2013-15 biennium.
Thanks, I misread the label under the chart. Clear now.
So, did the underperformance of Wisconsin in the late 90s occur because of the big deficits?
How about its performance in the 2000s, the deficits responsible for that too?
patrick, you are diverting the topic away from the current administration and economic performance.