Today the Philadelphia Fed released coincident indices (measures of aggregate economic activity) for the states and the US. Wisconsin outperforms Kansas — a very low bar — and yet has lagged all her neighbors.
Consider first Wisconsin compared to Kansas (like Wisconsin an ALEC darling) and Minnesota and California (not ALEC darlings).

Figure 1: Log coincident indices for Minnesota (blue), Wisconsin (bold red), Kansas (green), California (teal) and US (black), all normalized to 2011M01, seasonally adjusted. Source: Philadelphia Fed, and author’s calculations.
Only the disastrous trajectory of Kansas’s economy makes Wisconsin’s performance look tolerable.
Some observers have argued that the dissimilarities between these states invalidates the preceding comparison. However, the comparison with Wisconsin’s neighbors does not cast Wisconsin economic performance in a noticeably better light.
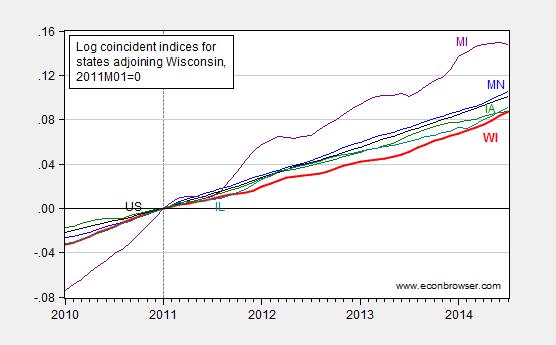
Figure 2: Log coincident indices for states adjoining Wisconsin — Minnesota (blue), Wisconsin (bold red), Illinois (teal), Iowa (green), Michigan (purple), and US (black), all normalized to 2011M01=0, seasonally adjusted. Source: Philadelphia Fed, and author’s calculations.
It is interesting to observe that — despite the ample scorn heaped upon Illinois by conservative commentators (including in the comments section of this weblog) — Illinois has outperformed Wisconsin for essentially all of the past three and a half years. And, as I mentioned, Wisconsin lags the (regional) pack.
(Note that regardless of whether one normalizes to the previous trough or peak, Minnesota outperforms Wisconsin.)
Update, 12:40PM Pacific, 8/21: Gross State Product figures released yesterday, extending up to 2013Q4 (i.e., to the end of last year) confirm the relative poor performance of Kansas and Wisconsin.

Figure 3: Log Gross State Product for Minnesota (blue), Wisconsin (bold red), Kansas (green), California (teal) and US (black), all normalized to 2011Q1, seasonally adjusted at annual rates, in Chained 2009$. Source: BEA (August 20, 2014), and author’s calculations.
As of 2013Q4, cumulative growth since 2011Q1 was 2.4% higher in Minnesota than that in Wisconsin; for the Nation as a whole, it was 2.1% higher than that in Wisconsin.
Nice graphs. What are they graphing, unemployment, GDP, government employment, state deficits, hog production?
Ahh name-calling, the last refuge of the scoundrel and the charlatan.
See those boxes in the upper left hand corner of each graph. They are called “legends”. They also contain the subject matter of the graph. Read them. Be informed.
Ricardo: Are you too lazy to click on the source hyperlink (the text that is underlined and highlighted)?
Now, I think you are being disingenuous (again), as you have commented many times in the past on posts that incorporate these indicators, without asking this question. Or are you becoming forgetful?
More on the need for an FAA. European govt spending at 49% (!) of GDP.
http://www.bloombergview.com/articles/2014-08-19/european-austerity-is-a-myth
And note the pay levels, Nick.
The growth rate in WI has been on the rise for over a year. It surpassed that of MN in March and that of the US in May. Good news for Wisconsinites. Whither from here, and on the basis of what econometric model?
JBH: And how did Wisconsin’s growth rate for the preceding 3 years compare against Minnesota’s? Geez. (And I can’t replicate the timing that indicates that WI growth exceeds MN using coincident indicators).
Menzie: In other words, you use Philly indices post after post. Yet for over a year the growth differential has been narrowing, with WI growth finally surpassing MN growth five months running. And now you claim you don’t understand why. Do I have that right?
JBH: No, as usual, you do not have it right. I was merely pointing out that I could not date the WI exceeding MN growth rates to the months you indicated.
On Wisconsin growth rate increasing, I agree; but I would say that eventually fiscal policy effects die out — so the contractionary fiscal policy undertaken by the administration led to depressed growth rate for a while, but now output is reverting toward potential. In addition, in recent months, with an eye to re-election, fiscal policy has moved to a less contractionary stance, by providing more tax cuts to higher income households (see previous discussion of the budget balance and the evaporation of the surplus).
I know for you, it’s all axiomatic, but more me, let me just restate — this is textbook analysis.
Menzie: MN July 2014 coincident indicator level = 164.83. July 2013 = 159.55. WI July 2014 = 148.23. July 2013 = 142.95. WI growth rate > MN growth rate. Similarly for WI growth in Mar, Apr, May, Jun. This new turn of events is visually evident on the graph. Per the coincident indicators, WI is at present outperforming MN in growth. What makes this so difficult for you to see? You have the raw data.
Back to my original post. My question, which you did not address, was an open one. Perhaps someone out there has a model. Many economic factors affect state growth differentials. Yet in your long-running sequence of posts on this, you do only partial and superficial analysis based mostly just on fiscal policy. By this line you attempt to prove a part of the truth, the part you want to reveal, by holding that part up to the light but never going for the whole truth.
jbh,
you still need to acknowledge how far below your potential you are currently at. that is still more important than derivative effects. you are still playing catchup, and until you actually pass the mark you cannot claim success.
Looking at the data, I get similar numbers, JBH. Since January Minn. is up 2%, Wisc. is up 2.2%. Over the past year (Aug ’13-July ’14) I get Minn. at +3% and Wisc. +3.4%.
JBH: I indicated the timing was what I had difficulty matching. I now see you were using y/y measures. If you look to m/m, you will see WI growth exceeds MN in July 2013, but then drops below again in December 2013; it rises again in January 2014. I’ll take your word for timing on WI growth rising on y/y basis.
By the way, using the newly released real GDP figures, you will see that on a q/q basis, there is no clear pattern. On a y/y basis, Wisconsin still underperforms Minnesota.
Try again…
I’ll be spreading this news all over Michigan, especially Detroit. Wow, we didn’t know we had it so good here.
You’re right Bruce you don’t have it so good in Michigan. According to quarterly State GDP data, Michigan’s GDP is down 0.6 percent since the beginning of the recession in the 4th quarter of 2007. Wisconsin’s GDP, on the other hand, is up 4.1 percent since that time. Things may not feel so good in Michigan because GDP has yet to return to its pre-recession level, unlike in Wisconsin.
What does a coincident indicator indicate?
Please explain it.
Left Coast Bernard: In the notes to both figures, there is an indication of “source”, the Philadelphia Fed. If you click on that link you will find the answer. The intent of the notes is to be explanatory, or indicate where one can obtain further information.
This is compounded by some of the bad census http://quickfacts.census.gov/qfd/maps/wisconsin_map.html indicating the substantial nature of the demographic decline of many of Wisconsin’s counties. Look, for example at Manitowoc County, containing the de-industrializing cities of Manitowoc and Two Rivers, they have as many people there as they did in 1970 except that the average age of the population has increased by 18 years.
To summarize, the young people of north and western Wisconsin are heading increasingly to the Twin Cities, others located in central Wisconsin head for Madison, while Brown County is absorbing the young of NE Wisconsin. The GOP ring around Milwaukee is made up predominately of in-state migrants without children (white flight), while Milwaukee although having a high birth rate, loses to out-migration.
This situation parallels that of Kansas which, except for Kansas City, and to a minor extent, Wichita, is also losing its young rapidly.
These would normally be regarded as the death knells for economic vitality.
How did you control for the lousy energy regulation in Wisconsin (only California and New York are less efficient)?
http://www.pacificresearch.org/fileadmin/templates/pri/images/Studies/PDFs/2013-2015/50StatesEnergy_FirstFinalWeb.pdf
Minnesota is 34th, but that’s better than Wisconsin’s 48th.
Patrick R. Sullivan: What exactly is the basis for the assertion of efficiency/growth by Pacific Research (I must confess when I used to get mailings from them, I promptly put them in the “circular file”)? I notice that 49th in rank is California. Yet where is California in terms of growth? Let me observe that in the longer document (which you did not link to), they eschewed any tests of statistical significance, which in my view is an “odd” omission (it’s not even in the footnotes). Maybe you can do a more sophisticated analysis, using ordered probit, as I did in my analysis of the ALEC-Laffer rankings and growth rankings. Econometric software access should not be a barrier to you; just download R (open source) and implement the appropriate routines.
Maybe you can do a more sophisticated analysis, using ordered probit
I believe Patrick R. Sullivan would rather choose the simpler multinomial logit option since he doesn’t seem to be terribly bothered with violating Independence of Irrelevant Alternative conditions.
You know guys, no matter how long you keep looking under the lamppost for your car keys, you aren’t going to find them there.
Patrick R. Sullivan: By your response, I can only gather that you have no idea what we are speaking of. Instead of casting aspersions, would you like to provide some sort of constructive comment, perhaps of a quantitative nature, relating to the lack of or presence of statistical significance, and/or the choice of statistical technique? Or are these irrelevant to you, as you have your priors already established?
Pacificresearch.org is a tell. Some would call it a Think Tank and others would call it a Stink Tank. Your option.
I know I can count on a scholarly comeback here, dilbert. Thanks for not disappointing. Btw, isn’t the colored map something of a clue;
http://www.philadelphiafed.org/research-and-data/regional-economy/indexes/coincident/2014/CoincidentIndexes0714.pdf
“The mission of the Pacific Research Institute (PRI) is to champion freedom, opportunity, and personal responsibility for all individuals by advancing free-market policy solutions.” — PRI Home Page
So PRI begins from an assumption of a particular answer and proceeds to a conclusion. The answer is free (sic) markets, whatever the question. So, yes, there is good reason to question the results of PRI research.
“PRI has received over $1.6 million in donations from the Koch family foundations since 1986, $1.5 million from the Koch conduits DonorsTrust and Donors Capital Fund, and millions from other right-wing foundations, including the Sarah Scaife Foundation, the Searle Freedom Trust, and the Lynde and Harry Bradley Foundation.” — SourceWatch, Center for Median and Democracy
OK, there is REALLY good reason to question the results of PRI research.
Since we’re all Philly Fed, whenever possible, here are some portentous numbers for Obamacare;
http://www.philadelphiafed.org/research-and-data/regional-economy/business-outlook-survey/2014/bos0814.cfm
Highlights; increases in part-time employment, outsourced work, employee contributions to premiums, co-pays, and prices to customers.
From Prof. Mark J Perry (a Professor of Economics) :
Ludwig von Mises :
1. A man who chooses between drinking a glass of milk and a glass of a solution of potassium cyanide does not choose between two beverages; he chooses between life and death. A society that chooses between capitalism and socialism does not choose between two social systems; it chooses between social cooperation and the disintegration of society. Socialism is not an alternative to capitalism; it is an alternative to any system under which men can live as human beings.
2. Every socialist is a disguised dictator.