DWD released August employment figures today. Attainment of Governor Walker’s 250,000 net new private sector jobs continues to be unlikely.
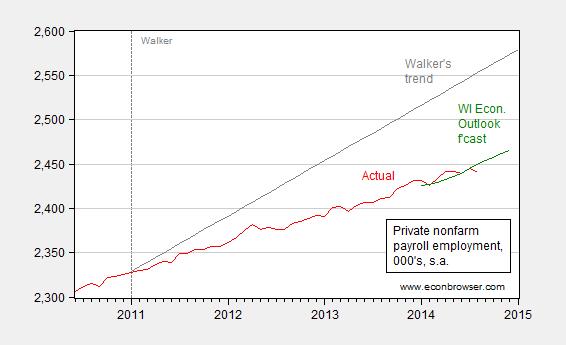
Figure 1: Private nonfarm payroll employment, s.a., in ‘000s (red), forecast from March 2014 Wisconsin Economic Outlook, interpolated from quarterly, using quadratic match (green), and linear trend consistent with Governor Walker’s pledge to create 250,000 net new private sector jobs by end of first term (gray). Source: Department of Workforce Development, Wisconsin Economic Outlook (March 2014), and author’s calculations.
Total employment did increase, attributable to a large increase in local government employment. Since August is related to the beginning of the school year, the government employment preliminary number is not particularly informative, given the difficulty in seasonal adjustment.
DWD also released Quarterly Census of Employment and Wages data through March; these figures for private employment were no different from figures released earlier, and discussed in this post. At that time, I characterized the outcome thus: “No succor from the QCEW series that the Walker Administration previously touted”.
According to BLS data, based on annual changes, Wisconsin ranked 33rd in terms of private job creation. [2]
It is interesting to look at where the decreases have been since the beginning of the year.
-5.00% Natural Resources and Mining
-4.78% State Government
-3.16% Educational Services
-2.10% Prof., Scien. & Tech. Serv.
-1.61% Real Estate, Rental, & Lease
8% of the reductions are in the bloated state government and education. Go Walker Go!!!
Up is down. Black is white. War is peace. An increase in unemployment is good.
Ricardo,
At times I have to wonder if you ever do anything other than slavishly repeat poorly informed and erroneous interpretations of these reports. If your intent is to misrepresent, you should really consider the audience. The readers of this blog are, for the most part, like myself, highly educated, mathematically capable, and informed people, familiar with statistics and statistical analysis. Your pathetic scribblings are something of a waste of energy. But I’d like to point out some of your more salient errors: 1) you apparently are using the wrong data for your conclusions about government jobs. The correct, seasonally adjusted, final revision total of government jobs at the end of December (you realize of course that the reporting points are the end of the month–don’t you?) is 99,500 (that data from 3/13/14 release). The just-released figures for revised July is 99,400 or preliminary August is 99,600. You are either using the preliminary 12/2013 data or the 01/2013 data to make your claim. In either case it is incorrect. Please admit your error and restate your analysis. 2) You also are apparently quite ignorant of the BLS occupational classifications as you state a figure for “education”. The DWD reports do not have an “education” classification–they never have and they never will. What exists is a category for “educational and health services”. This is important so pay attention; the classification includes all the health, medical and associated health care job classifications–you know, doctors, nurses, health technicians, hospital workers, home health providers, nursing homes, etc. So what you are cheering is the new trend in the state where medical employment has stagnated (since if you had even done the smallest amount of checking you would see that the medical professions dominate this classification). If you were mistakenly cheering this decline as something to do with public school teaching, your euphoria is misplaced, this classification only includes private educational institutions. (For public school teachers, go to “local government) But better yet, how about going to the BLS web site and spending a few hours understanding the employment classifications, and learn, for example, that professional and business services is predominately NOT professionals, consultants, attorneys and accountants? But I will leave the real answer for you to find out.
Dr. Morbius: Ricardo’s really big mistake is to think that public school teachers are included in the educational and health services category — they are in the local government category. As it is, he is cheering the decline in private service providers of education and health services. Perhaps he feels *all* teachers are stoopid…who needs book learnin’ anyways!
I believe that Ricardo is your mistake, Menzie, but it is your blog.
It is one thing to allow a variety of viewpoints, such that the discussion can stimulate some thought and provide information a reader might not be encountering in their perusals of habitual sources. It is another to allow a commenter to post the equivalent of a whoopee cushion at frequent intervals.
funny how the social security crowd benefited their entire life from government subsidized education through college, but now they are keen to take that opportunity from the current generation. i got mine…
Projections are the hoist for the petard.
http://www.thegatewaypundit.com/wp-content/uploads/2014/09/obama-record-charts.png
Dr. Morbius,
You caught me. I used the seasonally adjusted numbers from Menzie’s link to Department of Worksforce Development. Perhaps I had a typo. No, that can’t be. I copied and pasted the data.
Well, I guess I have to submit to your superiority because I don’t have near the education you do. My statistics courses were greatly inferiour to yours and when I took Keynesian macroeconomics I couldn’t understand it (seriously I couldn’t, not until I read Mises and discovered the Keynesians don’t understand it either). So I yield to your superior position. Yes, you should be the king of the central planners, the perfect one all the progressives are looking for to make their theories work..
Don’t be sad bro.
Ricardo: You are merely confirming the inferiority of your education (or processing thereof) by spelling “inferior” as “inferiour”. When will you learn to stop typing while you’re ahead? But as I indicated to Dr. Morbius, your really big mistake is to think that public school teachers are included in the educational and health services category — they are in the local government category. As it is, you are cheering the decline in private service providers of education and health services.
Keep up the consistently “inferiour” work!!!
Ricardo: “8% of the reductions are in the bloated state government and education. Go Walker Go!!!”
Ricardo’s even funnier blunder is that he took a percentage decline in one category, state government 4.78%, and then a different percentage decline in a different category, state government 3.16, and then added the two percentages together to come up with a total decline of 8%.
It’s like saying that Texas employment is down 5% and Maine employment is down 3% so together they represent 8% of the U.S. decline in unemployment. Huh? What?
I have to admit, Ricardo is always good for a laugh. He’s so endearingly earnest in his ineptitude.
Salient points by all. Interestingly, the alternative candidate to Walker apparently hired someone else to create a jobs creation plan for her campaign that she could release as her own. Unfortunately, it appears that she hired a consultant who simply plagiarized from past democratic candidates who lost past races. She then released her (apparently plagiarized) jobs creation plan as her own.
The key quotes are:
“This is my plan on how to drive Wisconsin’s economy forward,” Burke said.
BuzzFeed reported late Thursday that Burke’s plan, called “Invest for Success,” includes nearly verbatim passages from the economic development plans put forward by Delaware Gov. Jack Markell in 2008, Ward Cammack of Tennessee in 2009 and John Gregg of Indiana in 2012. Cammack withdrew from his race, and Gregg was defeated.
The full article is here. http://www.jsonline.com/blogs/news/275701181.html
This is, of course, a golden opportunity for Dr. Chinn to provide some consultancy services to the Burke campaign as to how to increase jobs in Wisconsin. After all, there is only about 7 weeks until the election, and Dr. Chinn has been focused on Wisconsin jobs like a laser beam. He, surely, would have great ideas to offer to Mary Burke.
Menzie,
I have consciously not commented on the many errors you have made lately in your posts. Since I am more interested in economics than in English I will continue to not comment on your mistakes.
Menzie,
Thanks for the enlightenment on the components of Education Services. I was using the Census Bureau classifications. I should have asked you. Here it their classification.
Educational services
Elementary and Secondary Schools
Junior Colleges
Colleges, Universities, and Professional Schools
Business schools & computer & management training
Business & secretarial schools
Computer training
Professional & management development training
Technical & trade schools
Beauty & cosmetology schools
Flight training
Apprenticeship training
Other technical & trade schools
Technical & trade schools (exc computer repair & truck driving)
Truck driving schools
Other schools & instruction
Fine arts schools
Dance schools (including children’s & professionals’)
Art, drama, & music schools
Sports & recreation instruction
Language schools
All other schools & instruction
Exam preparation & tutoring
Automobile driving schools
All other miscellaneous schools & instruction
Educational support services
Educational support services (exc test devop & evaluation serv)
Educational test development & evaluation services
Ricardo: DWD figures are compiled in conjunction with BLS. The BLS figures cited are from the establishment series. Hence, one should not use the Department of Commerce‘s categorization for the Department of Labor‘s ***establishment*** (not household) based tabulation of employment. Geez.
And I’m not even mentioning the fact you added up the percentages which are calculated off of different bases. When/where did you take high school math!!!! Double-geez!
I just saw the numbers for the increase in payroll jobs through August for 2014. Wisconsin has added 17,400 while Minnesota has added 13,100. Wisconsin has added 33% more payroll jobs than Minnesota. That is not an insignificant number.
Ricardo: Why compare against December 2013? If I compare against January 2011 (when Governor Walker took office), Minnesota has created 43,500 more jobs than Wisconsin. That is a cumulative growth rate of 1.7% more jobs, and that is a not insubstantial number.