I’ve been wrapping up some long term projects (not planned as long term — they just took longer than expected) on interest rate parity and term spreads, and that spurred me to look at current patterns in interest rates. Some quick observations: interest rates remain higher in emerging markets than in core industrial countries. So too are real rates are higher despite higher inflation rates. And term spreads are larger in the US than other countries.
First, consider nominal interest rates.
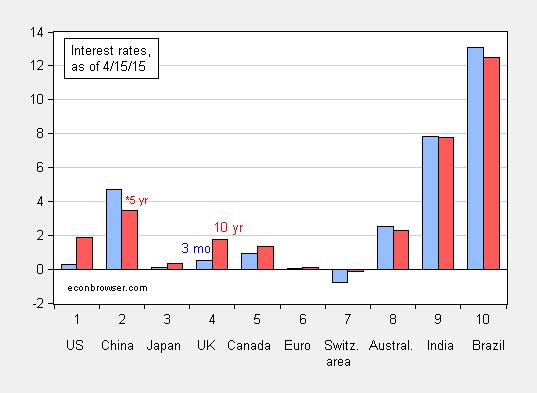
Figure 1: Three month interest rates (blue bar), and ten year interest rates (red bar), as of 4/15/2015. Euro ten year rate is for Germany. Red bar for China is five year interest rate. Source: Economist April 18th edition.
Short rates in the developed countries are low or, as in the case of Switzerland, negative. Short rates in the emerging countries are higher. Uncovered interest rate parity would suggest rough stability for the dollar against the yen, pound and euro. However, as reviewed in work by Chinn and Zhang (2015) and Chinn and Quayyum (2013), the proportion of variation in exchange rate depreciation explained by interest differentials is very small. Even at longer horizons, when interest differentials point in the right direction (at least for developed country currencies), bias has increased in recent years, as interest rates have hit the zero lower bound. Chinn and Zhang provide an explanation, as discussed in this post. For emerging market differentials with the US, it is even more unlikely that interest parity will hold; see Ito and Chinn (2007).
The variation in nominal rates is somewhat compensated for by actual inflation and expected.
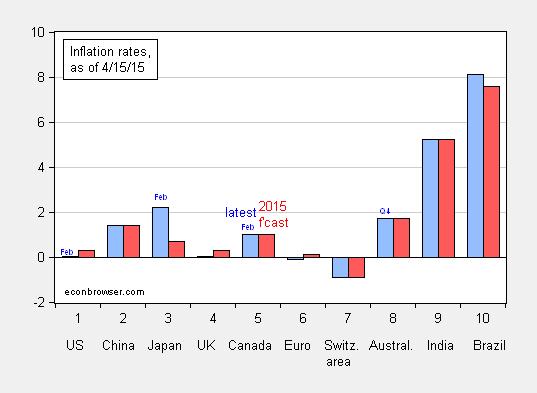
Figure 2: Year on year inflation through March unless otherwise indicated (blue bar), and forecasted inflation rate for 2015 (red bar), as of 4/15/2015. Source: Economist April 18th edition; inflation forecast from Economist Intelligence Unit.
While expected inflation, as measured by the Economist Intelligence Unit survey, is higher in emerging markets (China, Brazil, India) than in the advanced economies, they are typically not sufficiently high to result in low real rates — shown in Figure 3.
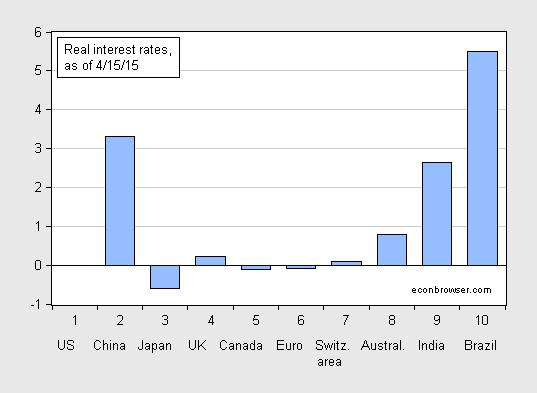
Figure 3: Real interest rates, calculated using three month interest rates and 2015 expected inflation, as of 4/15/2015 (blue bar). Source: Economist April 18th edition, and author’s calculations.
Of course, these are imperfect measures of real rates; the expected inflation horizon and interest maturities do not match. Nonetheless it is interesting that the estimated real rates differ so substantially. Empirical assessments suggest that real interest parity does not hold, so these differences should not be interpreted as deviations that will entirely dissipate over time (see Singh and Banerjee (2006)).
Finally, I thought it of interest to see what term speads look like at the current moment.
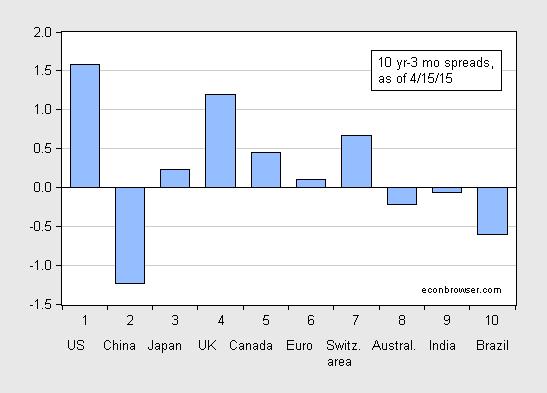
Figure 4: Ten year-three month term spreads, as of 4/15/2015 (blue bar). China observation is Five year-three month term spread. Euro ten year rate is for Germany. Source: Economist April 18th edition, and author’s calculations.
The US spread is the largest displayed. Results in Chinn and Kucko (forthcoming, International Finance) (discussed in this post) sugest continued growth in the US. The UK spread is next largest, but Chinn-Kucko did not find a statistically significant relationship between the spread and IP growth, so no particular conclusion can be drawn. The same can be said for Canada.
For the emerging markets, there is less evidence. Mehl (2006) finds some predictive power in Brazil, but none in India (using five year-three month spreads). Here is one take on the inversion in 2011 in these two countries (WSJ). The Chinese inversion might seem alarming; however, to my knowledge, there is no empirical work documenting a link between the spread and growth in China.
Menzie,
do you not think it matters whether the yield curve goes inverse because of short rates rising than long rates falling?
nottrampis: Probably does, and we have some results for recessions in the Chinn-Kucko paper. Do not know if it mattered (in an empirical sense) in our sample for growth. There are some results for the US (see Jonathan Wright) that indicate that it is sometimes.
Interesting post.
Here’s a bit from Platt’s Barrel. A simple read of the data suggests China’s in outright recession.
http://blogs.platts.com/2015/04/16/commodity-prices-chinese-gdp/#more-20147
Let me add that the Platts’ post is consistent with Jim’s analysis of oil prices, here:
https://econbrowser.com/archives/2015/01/whats-driving-the-price-of-oil-down-2
@Steven: “A simple read of the data suggests China’s in outright recession.”
This is been my conclusion, FWIW.
Namely, the net of production and exports vs. consumer spending suggests ~0% growth.
Moreover, China’s labor force is not growing and labor productivity is reported as being negative, i.e., by definition the economy is not growing.
China’s money supply to GDP is ~200%, whereas state-directed lending is growing at 14-15% for fixed investment (47-49% of GDP!!!) in increasing overcapacity in what is essentially dozens of Potemkin Village-like ghost cities.
Therefore, the state-directed lending for unprofitable, unneeded fixed investment capacity accounts for virtually all of the reported 7% real GDP growth, which requires effective gov’t deficit lending/spending equivalent to $1.2 trillion. Money velocity is in free fall.
This unprecedented (unsustainable) growth of credit and fixed investment to GDP is occurring to prevent China’s economy from decelerating to its potential or natural rate of ~0% based on demographic drag effects, excessive debt, increasing shortages of water and arable land, increasing food and energy imports, and falling productivity.
China’s “miracle” has been for many years now a runaway debt-induced “mirage”.
Interesting analysis, Menzie.
Are Euro interest rates significantly German rates? In other words how do you weight the interest rates for the various countries for the Euro (differences between Germany and Greece, for example, and significant), or is this the rate for the ECB?
Ricardo: The ten year rate is essentially the German rate. The 3 month is euro area wide.
Thanks!
Dear Menzie,
I’m not going so far as your first two respondents and suggesting China is in a recession. But is there any possibility that an expected depreciation of the renminbi relative to the dollar might explain your last graph? The Chinese are supposedly liberalizing, and such liberalization might allow for falls relative to an effectively fixed rate.
Julian
Julian Silk: I honestly have no idea. Have not seen whether UIP explains anything with respect to the yuan’s value, over the recent period (my earlier work pertains to 1980’s-1990’s).
Once the US$-denominated FDI to China sustains a protracted decline, as appears likely, the Chinese will be compelled to devalue the Yuan (drop the peg) and turn inward from the global economy to deal with internal instability and potential social unrest. Under this scenario, the new generation of PLA generals in Beijing are much more likely to exert authority and power than the billionaires now trying to get their money out of the country ASAP.
http://www.hoisingtonmgt.com/pdf/HIM2015Q1NP.pdf
The world is in a Long Wave debt-deflationary regime. There is too much debt to wages and GDP. Period.
Looking at debt, while ignoring equity, consumption, and human capital doesn’t tell you much.
Most people live month-to-month. Without a job, or with a low-paying or part-time job, debt can be a problem.
The solution is to raise monthly income by increasing production. So, people can borrow and save, to build equity, consume, and employ their human capital.
Peak, total net annual flows to the financial sector (and to the top 0.001-1% owners of a disproportionately large share of financial wealth and rentier flows) equal total annual output of the economy today. All output is effectively pledged to the top 0.001-1% to 10% forever.
Equity is grossly overvalued as a share of wages and GDP. Excessive debt and overvalued equity, i.e., financial bubbles, is synonymous with extreme wealth and income inequality and concentration of wealth to the top 1-10% (who own 85% of all financial wealth) hoarded at no velocity.
The larger the financial bubble as a share of wages and GDP, the larger and more persistent the rentier claim against labor product, profits, and gov’t receipts, and the longer “secular stagnation” will persist.
The Fed/TBTE banks’ ZIRP, NIRP, and QEternity is promoting unprecedented financial system leverage, record financial profits to GDP, record non-financial corporate debt to GDP, share buybacks, and M&A, as well as exacerbating wealth and income inequality.
All output isn’t “pledged” to the top 1% or 10%. People consume more than produce or produce more than consume.
How can equity be overvalued, since its value is determined by the market. If people are willing to pay x-dollars for an asset, why do you believe they’re overpaying?
Yes, there’s income and wealth inequality. If you work little, for example, your income may be low. If you save and invest little, your wealth may be low.
Income and wealth can be created, particularly in a high income and very wealthy country, like the U.S., to benefit everyone.
Peak, you missed the point.
Rentier claims are now so high as a share of wages, profits, and gov’t receipts that real value-added output per capita is constrained around 0% to less than 1% indefinitely since 2007-08. The overvalued equity as a share of wages, profits, and GDP is hoarded at no velocity and with the aforementioned disproportionate rentier claims on output forever. The economy cannot grow now after the net claims by the financial sector and its owners.
Said differently, the net claims by the owners of financial “wealth” are now too large as a share of the economy to permit it to grow faster than ~0% real per capita since the onset of the debt-deflationary regime in 2007-08.
The combined effects of rentier claims, the record low for wages to GDP, regressive taxes on labor and favorable treatment of unearned income are contributing to decelerating productivity, increasing labor underutilization, and to decelerating secular trend real GDP per capita towards 0%.
Having reached the cumulative differential order of exponential magnitude of growth between debt and wages and GDP since the early 1980s, the US reached the “jubilee” threshold for private debt in 2007-08.
Since 2009-10, US public debt (local, state, and federal) reached a similar “jubilee” threshold from the early 1950s.
Private AND public debt to wages and GDP can no longer grow since 2007-08. In a debt-money-based financial system, no growth of debt means no growth after debt service.
Corporate debt growth since 2009-10, and especially since 2012, has been used for share buybacks, dividends, interest, and M&A, all the while capital formation to GDP has gone nowhere and is at the level of the early to mid-1990s. This is a form of capital consumption during a period of nominal GDP, revenue, and secular peak-to-peak earnings growth to date of of 2-3%, i.e., as good as it gets given the debt load and demographics.
The primary inference is that there is a point in the Long Wave progression when financial “wealth” becomes a net rentier claim on output, prohibiting growth. Because these secular episodes occur but once in a lifetime, most economists are not trained to anticipate nor recognize the regimes, the causes, and historical resolution. If they did, they would be compelled to examine closely private debt and debt service, and to acknowledge its effects.
But few economists have the incentive to do so because it would require close scrutiny of Fed, fractional reserve banking, debt-money, the TBTE banks, Wall St., the fallacious assumptions underlying most economic models, the values, motives, expectations, behavior, and actions of the rentier top 0.001-1%, and the political system they have retained and paid to write the rules of the “money-for-nothing” game in their favor.
Talk about a bad career move.
There is simply too much debt to wages and GDP, which is synonymous with extreme wealth and income inequality (with an historical peak-demographic aspect), hoarding of overvalued assets at no velocity, and excessive rentier claims on the economy by the wealthiest households. The more the central/TBTE banks engage in QEeverywhere, the higher the stock market capitalization and corporate debt rises to wages and GDP, the larger the rentier claim on output and the longer stagnation will persist.
BC, your statement is full of contradictions. You assume there’s too much debt and then assume there’s too much equity.
You assume there’s too much equity to “wages, profits, and GDP” being “hoarded” when low interest rates facilitate consumption and investment, for households and firms, and then conclude low or zero growth.
You assume stagnation, because of lower borrowing costs, more equity, and more debt, while ignoring the effects on employment and income.
I’ve stated before how to raise employment and income more quickly. Nonetheless, you can praise the Fed later for its exceptional performance.
Peak, wow! You leave me nearly speechless/typeless. No contradictions. If one does not understand that there is a limit bound to the growth of debt to wages and GDP, then, yes, one is likely to be confused and thus perceive contradiction. The lack of understanding of the limits of growth of debt to growth of GDP is confusion, not contradiction.
Returns to equity are likely to be 0% or negative for 7-10 years or longer hereafter:
http://www.hussmanfunds.com/wmc/wmc150420.htm
Here is the Wilshire Full Cap Index as a share of GDP adjusted for CPI and the US$, real final sales per capita, and capital formation to final sales:
https://research.stlouisfed.org/fred2/graph/fredgraph.png?g=18re
Equity market cap is back to the bubbly peak of 2000 (and rolling over), real final sales per capita have grown 0.7%/year (vs. 2.1% long-term average) since 2007-08, and capital formation to final sales is down 15% from the secular peak.
Non-residential investment to final sales:
http://research.stlouisfed.org/fred2/graph/fredgraph.png?g=18rB
Non-financial corporate debt (a record going back to 1928-30 and Japan in 1989-93) to wages:
http://research.stlouisfed.org/fred2/graph/fredgraph.png?g=18rp
Non-financial debt to private wages:
http://research.stlouisfed.org/fred2/graph/fredgraph.png?g=18rt
Total debt to private wages:
http://research.stlouisfed.org/fred2/graph/fredgraph.png?g=18ru
Non-financial corporate debt to GDP:
http://research.stlouisfed.org/fred2/graph/fredgraph.png?g=18rr
Total corporate debt to after-tax profits:
http://research.stlouisfed.org/fred2/graph/fredgraph.png?g=18rU
Wages to GDP:
http://research.stlouisfed.org/fred2/graph/fredgraph.png?g=18rx
Private wages to GDP:
http://research.stlouisfed.org/fred2/graph/fredgraph.png?g=18rz
http://ineteconomics.org/sites/inet.civicactions.net/files/koo-richard-berlin-slides.ppt
Since the onset of the Long Wave debt-deflationary regime (a.k.a. a “balance sheet recession” or “slow-motion depression”) and “secular stagnation” in 2008 (as occurred in the 1830s-40s, 1890s, 1930s-40s, and Japan since 1998), growth of debt and equity is no longer adding incrementally to growth of capital formation, productivity, employment, wages, and overall real value-added output per capita. In fact, the larger the private debt and equity to GDP becomes and persists, the larger the rentier claims to current and future growth, and the longer the “secular stagnation” regime persists, risking at some point a systemic debt-deflationary crisis that will dwarf that of 2008-09.
The individual and institutional owners of a disproportionately large share of US debt and equity now have a debilitating rentier claim on wages, profits, and value-added US output forever (or until actual deleveraging occurs, which the central and TBTE banks around the world are desperately acting to prevent as part of a kind of end-game gambit of the debt-money regime to prevent what is mathematically inevitable).
BC, you continue to contradict yourself. For example, you’re critical of an equity “bubble,” while complaining of a balance sheet recession.
Economic policies can improve household and firm balance sheets, which shouldn’t be ignored.
It’s not a zero sum game. It’s expanding the economy, to raise income and wealth.
And, I’ve explained before how the economy can expand more quickly.