The Bureau of Economic Analysis announced today that U.S. real GDP grew at a 0.2% annual rate in the first quarter. And that was even after a big inventory build-up from goods produced but not sold. Taking out the inventory contribution, real final sales fell by half a percent at an annual rate.
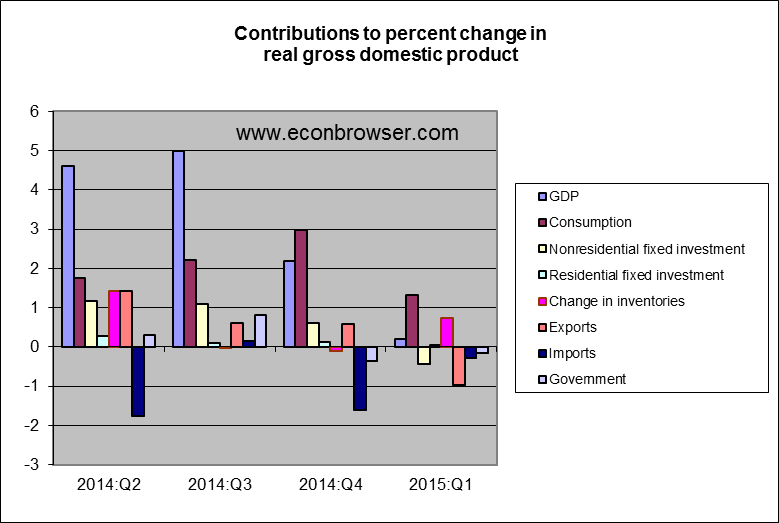
The biggest factor was a deterioration in net exports, with lower exports subtracting nearly 1 percentage point from the annual growth rate and rising imports subtracting another quarter point. The strengthening dollar, which ended the quarter 8% higher than it had started and 20% higher than it had been a year earlier surely contributed to this. To the extent the strong dollar reflects the fact that the U.S. is likely to tighten monetary policy sooner than some of its trading partners, this underscores the need for the Federal Reserve to take international developments into account. The good news is that the dollar has slipped back down 2% from where it had been at the end of March. Labor problems on west coast ports during the quarter may also have had some temporary effect on exports. But to the extent that the fall in exports reflects economic weakness outside the U.S., it is more of a source of concern.
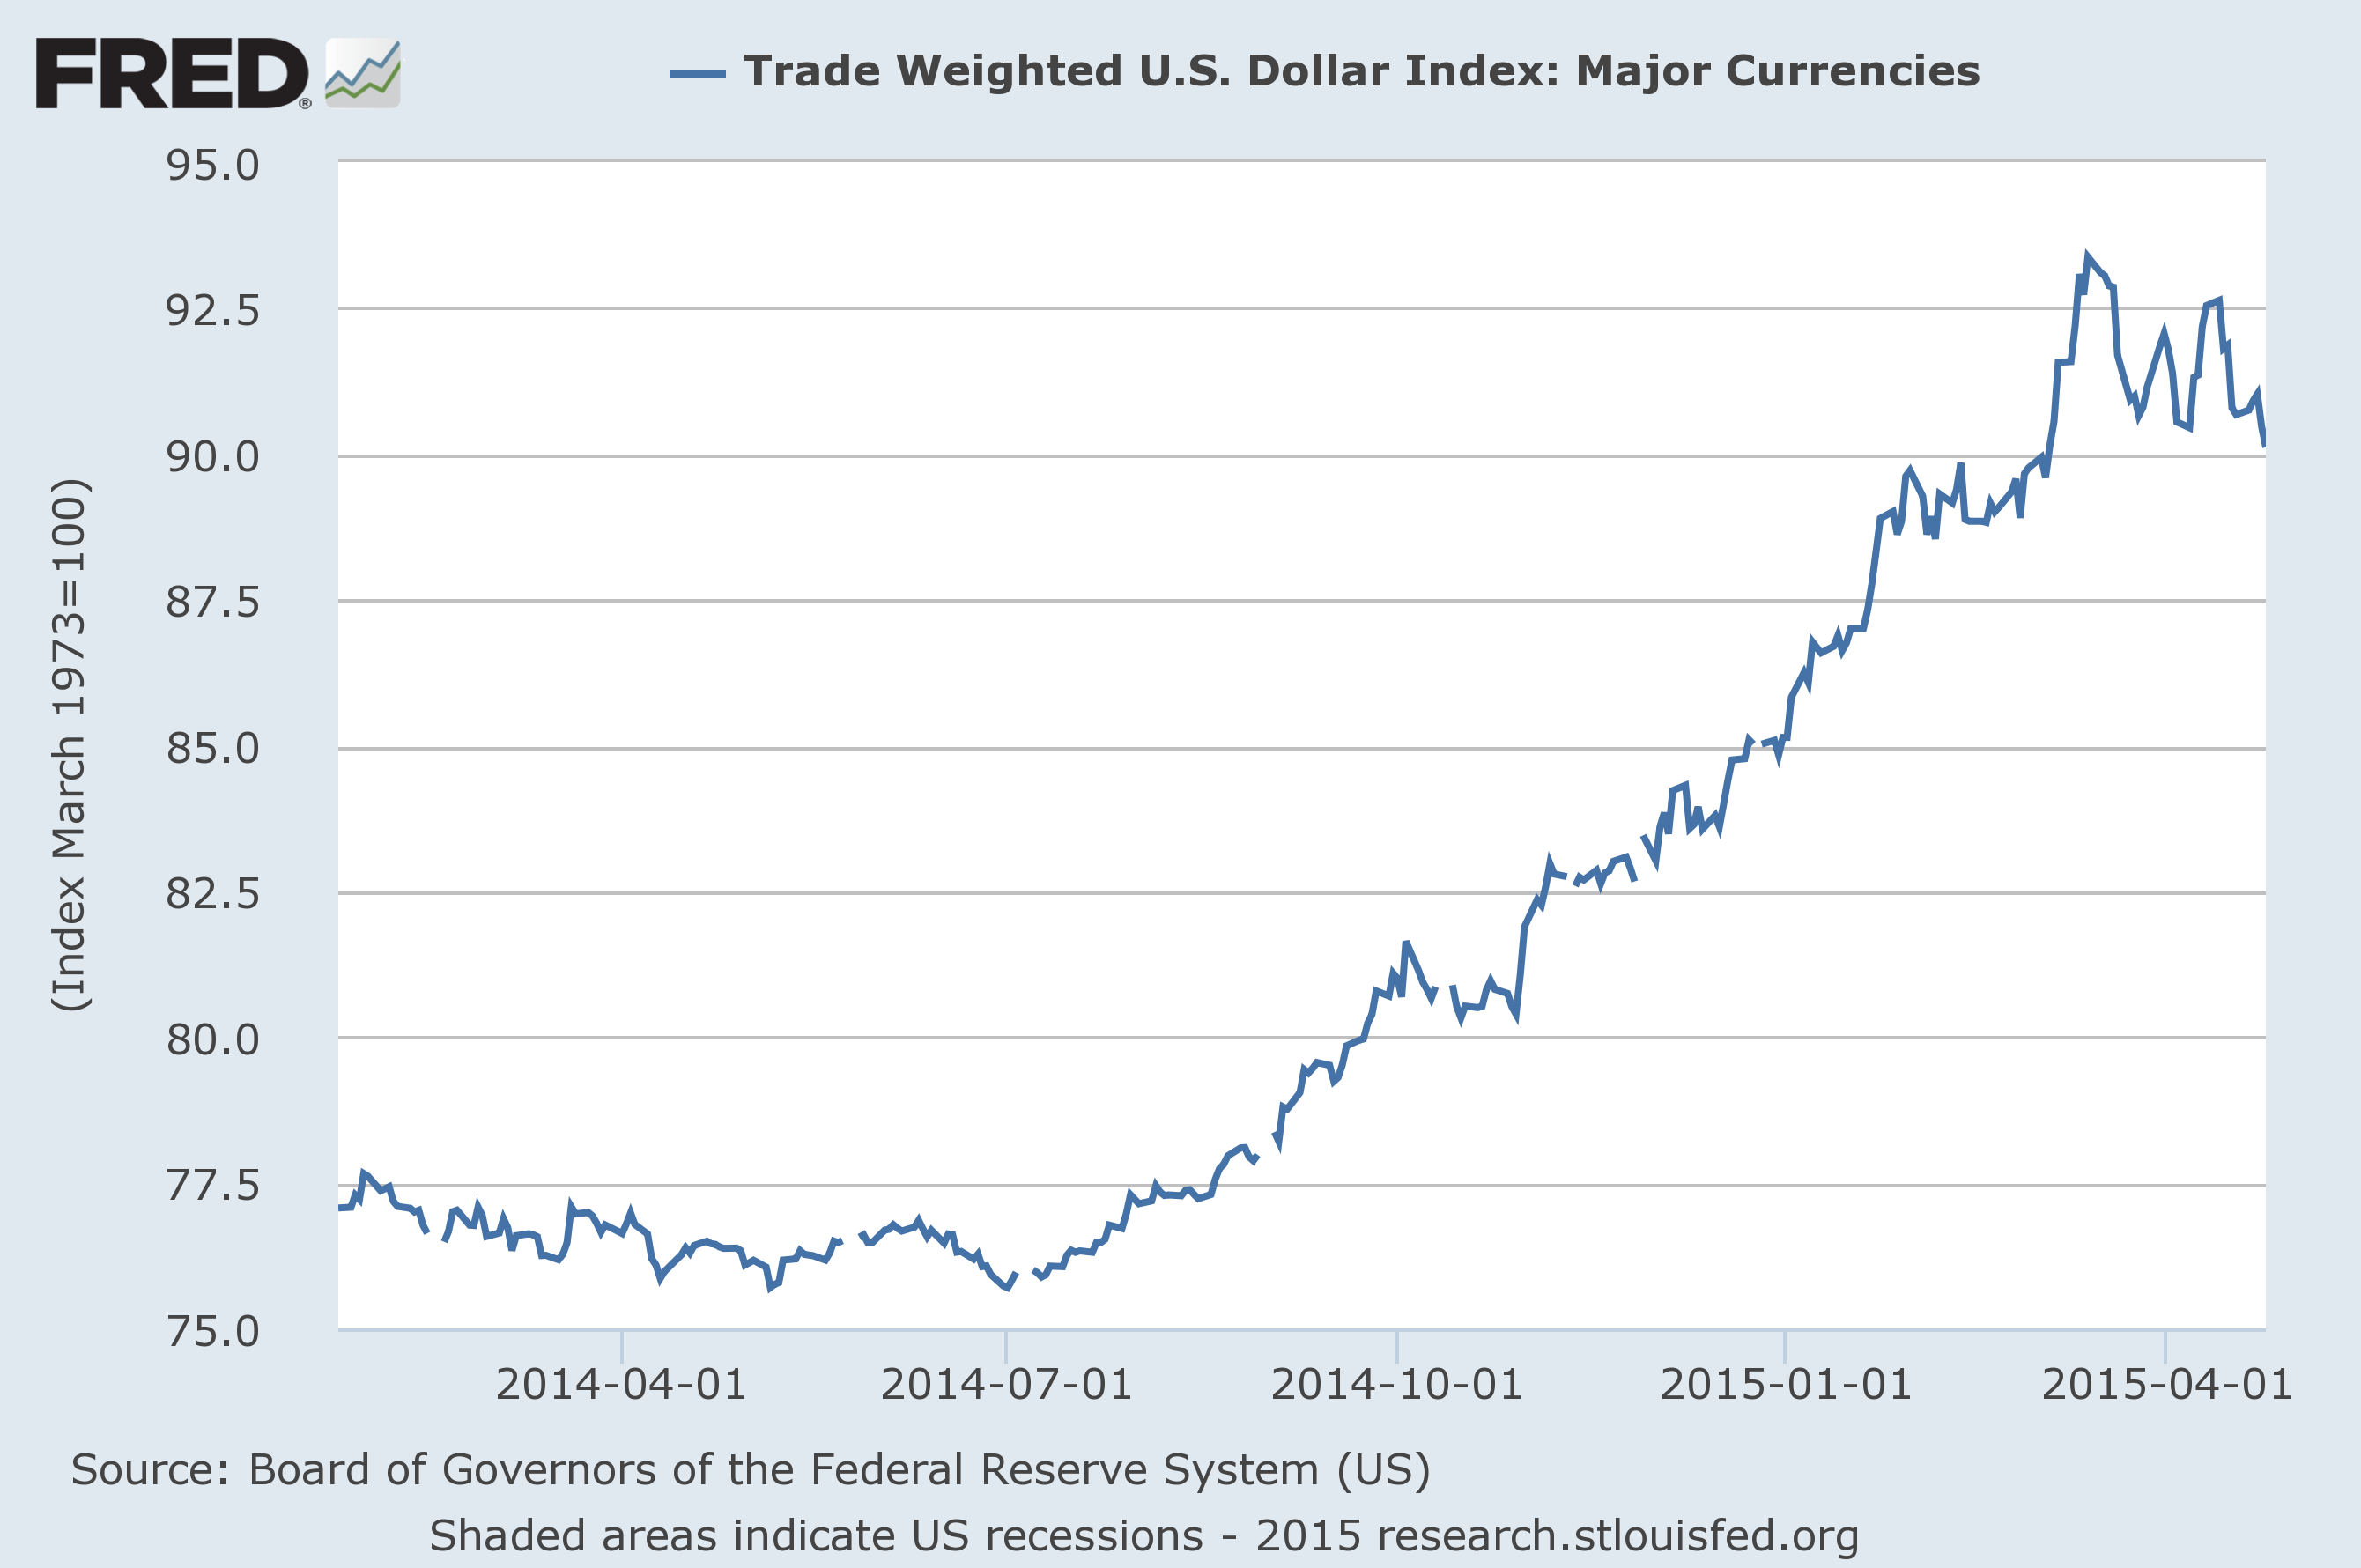
Source: FRED.
The GDP numbers also reflected weakness within the U.S., with nonresidential fixed investment subtracting 0.44 percentage points from the annual growth rate. Bill McBride thinks this “was probably due to bad weather and less investment in oil and gas.” Shale oil has changed industry dynamics in that firms get can get in and out of these operations much more quickly than most conventional oil projects. The result is that the lag between an oil price change and a response in investment spending is shorter than it used to be. I was expecting this to be more than offset by higher consumption spending as consumers spent the cash they saved at the gas pump. But consumption growth in the first quarter was also weaker than it has been.
The new GDP report brought a modest increase in our Econbrowser Recession Indicator Index up to a still quite low value of 7.9%. This uses today’s data release to form a picture of where the economy stood as of the end of 2014:Q4, and views the Q1 report as most likely a temporary disappointing blip.
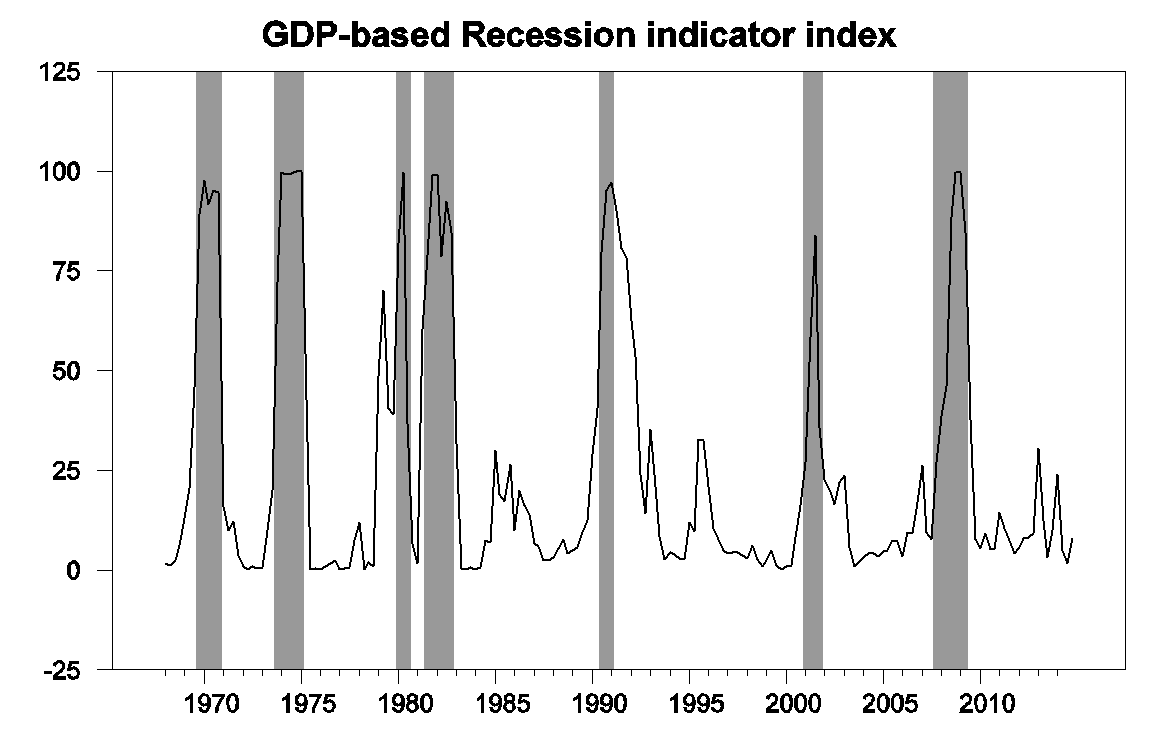
GDP-based recession indicator index. The plotted value for each date is based solely on information as it would have been publicly available and reported as of one quarter after the indicated date, with 2014:Q4 the last date shown on the graph. Shaded regions represent the NBER’s dates for recessions, which dates were not used in any way in constructing the index, and which were sometimes not reported until two years after the date.
Despite the latest numbers, U.S. real GDP in 2015:Q1 stood 3% above its value from a year earlier. The bigger picture is that U.S. economic growth continues despite temporary setbacks and some more significant headwinds.
So what do you think of the possibility that there is a problem with the 1st quarter seasonal adjustment factors.
I doubt that it is significant, since we really did have severe weather last year and this year that really did hurt the economy.
Moreover, you should expect weak trade just from the growth differences.
It’s been happening for several years now. Residual seasonality could be an issue. Net exports demonstrated this a few years ago. It’s possible that some of the new Census QSS data series that are increasingly used for PCE need more seasonal analysis.
Residual seasonality can arise for all sorts of reasons. Here’s a recent explanation from BEA:
http://www.bea.gov/faq/index.cfm?faq_id=1069
That was not a impressive “boost” to inventories. Wait for Q2……that will be a impressive boost. These “GDP” reports are so worthless. Hearing rumors of upward revisions coming in the 2010-2014 timeframe, which would be little surprise. The Republicans are right on this one, stop issuing them. They never get it right in a couple of months in a country this size.
and weak investments from the weakness in earnings or profits.
This is the third “blip” in the last four years. http://www.bea.gov/newsreleases/national/gdp/gdp_glance.htm I’d get concerned if there were a couple more quarters of similar performance, but that’s unlikely right now.
Why the surprise in increasing imports? Isn’t that what normally happens when a currency is strong against weakening foreign currencies? The whole theory of exports and imports in GDP is silly. A strong country is always going to import more than it exports, as will a final assembly economy versus a raw material economy. I went to Australia and too advantage of the AusDollar being $0.80 to the USDollar. If I had gone a few years earlier it would have been one for one. This is just one of many reasons the GDP numbers are bogus.
the deflator for PCE was negative 2.0%; the deflator for exports was negative 10.0%, the deflator for imports was negative 16.4%, and the deflator for government consumption was negative 1.7%…the only positive deflator was 0.9% for private investment, which is about 15% of GDP…so can anyone explain to me how they could arrive at a overall GDP deflator of just minus 0.1%?
see table 4: http://www.bea.gov/newsreleases/national/gdp/2015/pdf/gdp1q15_adv.pdf
From the BEA. Gross domestic purchases prices. BEA’s featured measure of inflation in the U.S. economy is the percent change in the price index for gross domestic purchases. This index measures the prices of goods and services purchased by U.S. residents, regardless of where the goods and services are produced. The gross domestic purchases price index is derived from the prices of personal consumption expenditures, gross private domestic investment, and government consumption expenditures and gross investment. Thus, for example, an increase in the price of imported cars would raise the prices paid by U.S. residents and thereby directly raise the price index for gross domestic purchases.
GDP prices. Another aggregate price measure is the price index for GDP, which measures the prices of goods and services produced in the United States. In contrast to the price index for gross domestic purchases, this index would not be directly affected by an increase in the price of imported cars. Imports are excluded from GDP because they do not represent U.S. production.
Implicit price deflator for gross domestic purchases in Q1=-1.6%. Reflect on the massive drop in import prices you cite, which along with the above gives full answer to your question.
The moral is: Go straight to Table 4, line 32 of the GDP release which for all intents and purposes is the key number. This is the inflation number the Fed uses to decide policy — read the FOMC minutes — along with the PCE price index deemed even more important. In further breakout, PCE goods=-8.7, PCE services=1.5%, services of course being little affected by the Q-to-Q change in imported goods prices. All in Table 4.
You subtract the imports. Normally this is not a problem, but when you get a sharp drop in the import deflator it creates distortions.
It happens every time oil prices fall.
The first quarter’s just released GDP figures are disappointing, but hardly surprising. Although the Great Recession officially ended years ago, economic growth since then has been lackluster when compared to other post-recessionary periods. And although last year’s midterm elections returned Republicans to power in both houses of Congress, the intense gridlock that has permeated throughout Washington since 2010 has remained and made it impossible for the nation’s political leaders to agree on solutions that could boost the economy and create more jobs. Until the president and Congress come together and pass legislation that reduces the immense amount of uncertainty in the economy that is being caused by a few specific provisions in the Affordable Care Act, a byzantine tax code that discourages economic growth instead of encourages it, proposed rules and regulations in the energy sector that have power companies spooked, and the restrictive rules that are part of the little known, but very important JOBS Act; uneven economic growth and steady, but unspectacular job gains will remain the norm. If Congress and the president can successfully address each of these issues, then the U.S. economy will finally turn the page and grow at a faster clip. But if they can’t, then don’t be surprised if future GDP figures are just as disappointing as the figures that were just released.
The cumulative loss of the output gap, since 2008, seems to be over $6 trillion, so far. The federal government lost about $1.5 trillion in tax revenue.
And, spent a lot on the unemployed.
Time for negative overnight rates?
The answer to ineffective drugs is simply more of the same ineffective drugs, no?
http://beta.ineteconomics.org/ideas-papers/blog/americas-banking-system-is-a-giant-house-of-cards-it-could-fall-on-you
“The few who understand the system will either be so interested in its profits or be so dependent upon its favours that there will be no opposition from that class, while the great body of people, mentally incapable of comprehending the tremendous advantage that capital derives from the system, will bear its burdens without complaint, and perhaps without even suspecting that the system is inimical to their interests.”
westslope, the US has become since the 1970s-80s a deindustrialized, undercapitalized, hyper-financialized, feminized (via “health care”, “education”, financial services, retail, and gov’t), militarist-imperialist, rentier-socialist corporate-state. The top 0.001-1% rentier Power Elite owners’ solution to any and all challenges is to print more TBTE fiat digital debt-money bank reserves and declining discount rates to lever up financial asset prices to goose their “wealth effect” (none, or very little, for the bottom 90%), and war (and now a perpetual global war and last-man-standing contest for the remaining resources of the planet).
The problem for the rest of us, including eventually for the professional middle class (next 9% below the top 1%), is that total annual net flows to the financial sector now absorb all US annual output of value-added goods and services, meaning that the top 0.001-1% owners of the financial sector and gov’t have a perpetual claim on all wages, profits, and gov’t receipts in perpetuity.
Since 2000 and 2007, a growing majority share of the professional middle class (Outer Party) not in the top 1% (Inner Party) have become dependent (knowingly or otherwise) upon the indirect rentier flows, including to the financialized sectors of “health care” (via medical insurance), “education” (by way of a ten-times increase in student loans), retail (revolving credit), and gov’t (now dependent upon Fed funding a growing share of the average $1 trillion deficit since 2009).
That is, the top 1-10% have become interdependent (wittingly AND otherwise) in exerting perpetual direct and indirect rentier/financialized claims/costs on the private sector and the bottom 90% of the US population, resulting in a structural impediment to real per capita growth of value-added output indefinitely hereafter.
If this condition were acknowledged by a large minority or a plurality of the professional middle-class next 9% below the top 1%, they would likewise have to concede that their income, perceived wealth, and socioeconomic status is dependent upon the top 0.001-1% rentiers continuing to successfully extract an overwhelming disproportionate share of labor product, profits, and gov’t receipts required for social goods for society. The zero-sum condition ensures that the US will continue on a path towards Third World status for a growing share of the population.
If one were to write a script for US decline, destabilization, disintegration, and eventual collapse of the oil-, auto-, debt-, suburban housing-, and mass-consumer-based economy, one could not do better than include the successive, cumulative events that have occurred since the end of the Bretton Woods reserve currency regime, NAFTA, and the serial financial asset bubbles and busts and central bank digital papering over of financial system implosions since 1987. ZIRP, NIRP, QEverywhere, TPP, and the Transatlantic Federation/Fortress Europa are the culmination of the failure of the system and the attempts by the rentier, corporate, and political elites to transition to a kind of post-Oil Age, Anthropocene, neo-feudal “Elysium”- and “Interstellar”-like world.
Real final sales per capita is averaging ~0.5% since 2007-08, ~1.3% since 2010, and ~1.1% since 2000. These rates are the secular “new normal” of the debt-deflationary “secular stagnation”. This is against the long-term rate per capita of 2.1%.
Peak Boomer demographic drag effects and little or no growth of the labor force, Peak Oil (net energy decline and rising energy cost of energy extraction), record debt to wages and GDP, a record low for wages to GDP, decelerating productivity, extreme wealth and income inequality dragging down velocity, and structural fiscal constraints hereafter ensures that there will be no “escape velocity”. We are now witnessing cyclical demand constraints from contracting profits and slowing investment that will constrain first the mfg. sector and then the rest of the economy this year.
IOW, ~0% peak-to-peak secular growth of real final sales per capita and ongoing deceleration of the post-2000 and -2007 rates is as good as it gets hereafter, i.e., as in Japan since 1996-98 and the US after 1929-30.
Nate Hagens: https://www.youtube.com/watch?v=da5sP3wRuJ8&feature=youtu.be
“The biggest factor was a deterioration in net exports, with lower exports subtracting nearly 1 percentage point from the annual growth rate and rising imports subtracting another quarter point. The strengthening dollar, which ended the quarter 8% higher than it had started and 20% higher than it had been a year earlier surely contributed to this.”
This could be viewed as supporting a point I made on these boards some time ago, when I said I thought the main effect of QE on the economy would come from the effect on trade – that is, it was basically a beggar-thy-neighbor policy akin to competitive devaluations following the Great Depression. After the effect on net capital outflows reversed, the dollar has bounced back as expected. But the initial dollar decline helped weaken the euro area, and we may yet pay a huge price for that.
The output gap could’ve been closed quickly.
The consumption boom accelerated in the 2001-07 expansion, since the country reached full employment with up to $800 billion a year trade deficits. Americans stocked-up in assets and goods, which reduced disposable income.
The weak recovery is the result of small and slow tax cuts (with many state tax hikes, or revenue raising laws, that offset much of the federal tax cuts), too much regulation (on top of excessive regulation), and too many disincentives to work (for both lower and middle class Americans).
I agree with Krugman, the stimulus was too small, to jolt the economy into a self-sustaining cycle of consumption-employment. However, the U.S. itself created headwinds, while also attempting to move the economy forward.
I should’ve stated discretionary income instead of disposable income.
“temporary disappointing blip.” Right so, James.
Wonder, if the campaign motto of Hillary “listener to the average guy” will work out.
This PR nonsense.
But if the economy is improving further, Jeb is toasted.
Buffett is already investing accordingly …
Yet another demonstration of the point I’ve made here many times: the vs year ago numbers are the ones to be watching; sa q on q are inevitably more noisy than indicative and overanalyzing/overemphasizing them is a big time waster.