Why one shouldn’t obsess on just one data set. Read on only if you don’t believe in a conspiracy so vast…
I’ve always wondered by climate change skeptics focus on satellite data; I guess “satellites” conjure up images of high-tech super-accurate measurement. But there’s a lot of stuff that can go wrong, imparting measurement error. From Yang, et al., in Nature – Climate Change (2013):
Observations of many climate variables are made by satellite sensors that were originally designed for meteorological observations. The coarse-resolution sensors carried by some satellites cannot capture climate processes occurring at finer spatial scales…
…The findings of satellite records that are used for trend detection and retrieval of the absolute levels of climate variables are greatly affected by how well the uncertainties associated with the sensors are resolved. This important step is underscored in the debate on the trend in solar radiation. Undetected drifts in sensor sensitivity have been cited as the main reason for the apparent spectrum of change57. Satellite sensors gradually lose radiometric sensitivity and stability during their operation, so good calibration is essential. Some satellite sensors cannot be recalibrated after launch due to the lack of accurate on-board or on-orbit calibrations. Procedures have been developed to calibrate these types of sensors but may still contain uncertainties92. Biases caused by instrument drifts are also common in satellite data. Satellites go through a slow change of crossing time at the local equator and a decay of orbital height, adding a spurious effect to detected trends93. Such biases must be addressed by applying a diurnal correction procedure to the data93 or by determining the precise orbit position of the satellites94.
Uncertainties can also increase when combining observations from different satellite systems to form long-term records. If the procedures for merging data from different systems are not well developed and calibrated, the uncertainties can potentially be high in combined data sets. [Emphasis added — mdc]
Given this set of caveats, what does the latest set of calibrations yield?
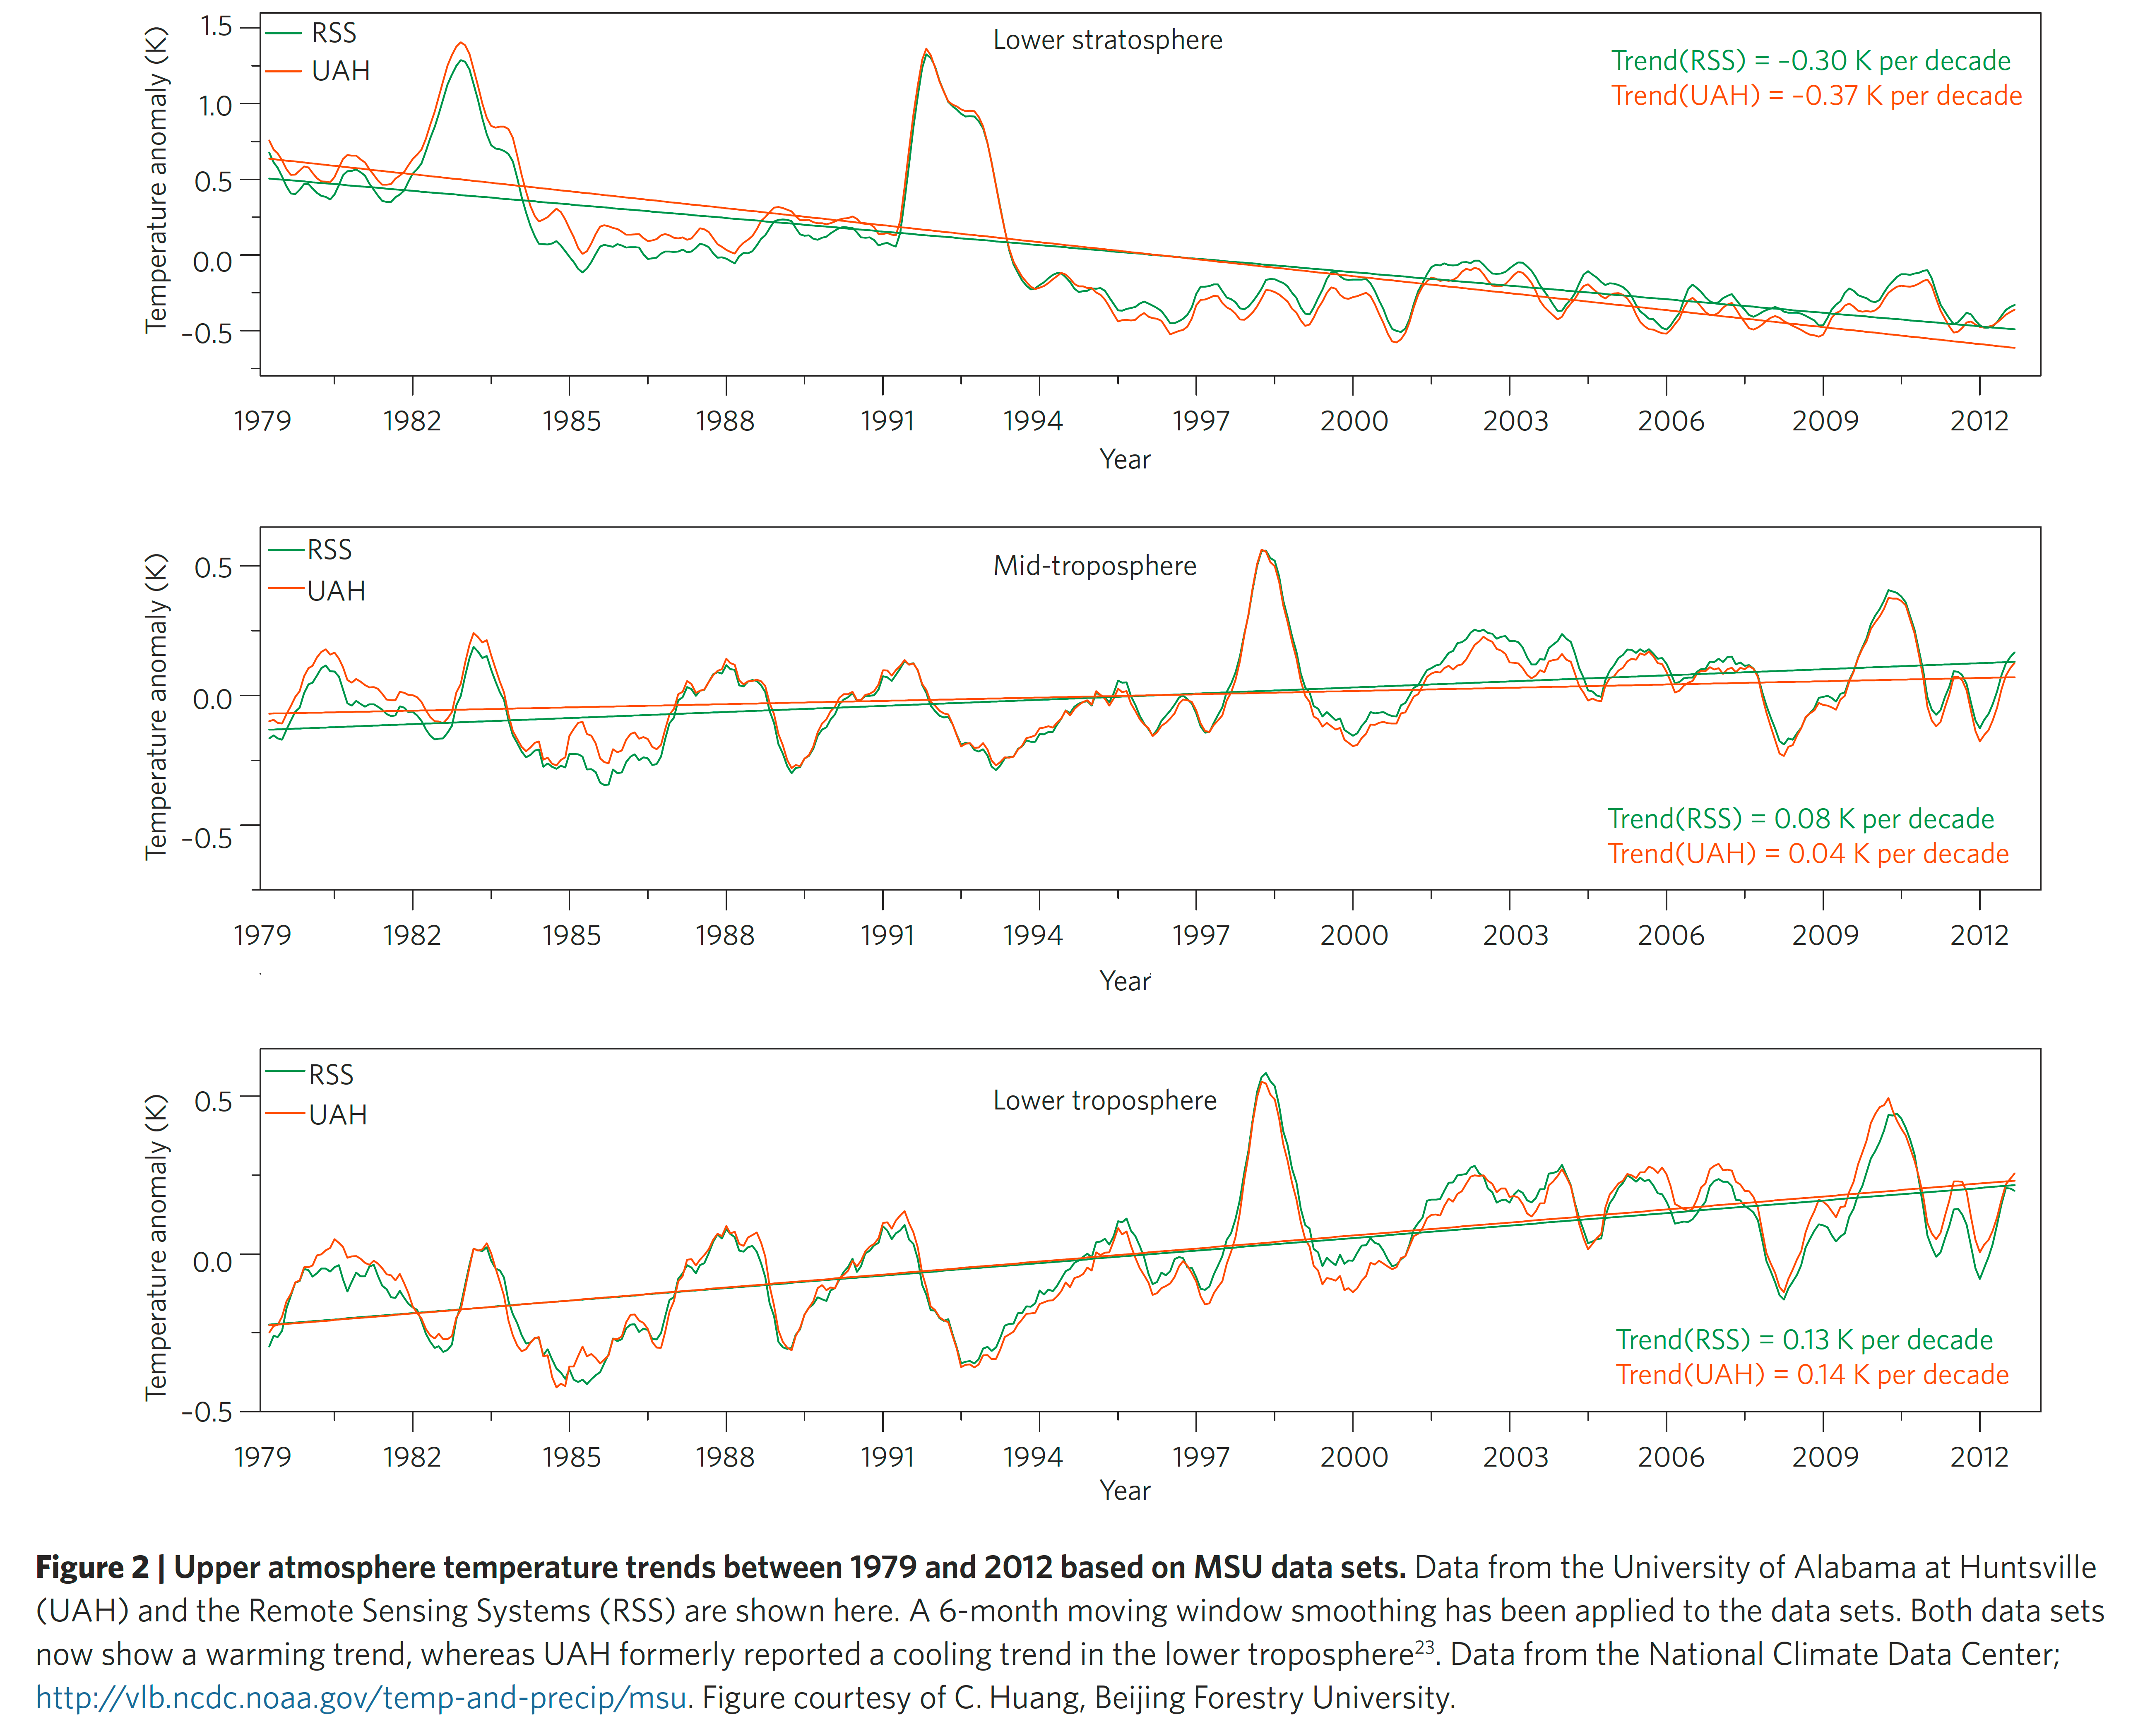
Figure 2 from Yang, et al. (2013).
From Glenn Reynolds in USAToday :
The climate change jet set.
The good news is that the public has seen through the scam. The GW jet set only ever advocate solutions that move money and graft towards them, don’t practice what they preach, and generally only damage the environment.
Menzie,
Please point out to me a real “climate change skeptic”, i.e., someone who denies that the climate changes. In lieu of which, please specify a falsifiable “climate change” hypothesis. And why did you stop calling it “Global Warming”?
Regards,
Bruce
Menzie, you are doing what skeptics are claimed to do: Adding doubt to the findings. Only for skeptics it is often claimed we are paid by big oil to do so.
Instead of generalizing the processes needed to adjust the satellite raw data, why not just go to the managers and see if they are performed. Here’s what Dr Spencer says about the latest UAH revision: http://www.drroyspencer.com/2015/04/version-6-0-of-the-uah-temperature-dataset-released-new-lt-trend-0-11-cdecade/
This is the November 2015 UAH result: http://www.drroyspencer.com/wp-content/uploads/UAH_LT_1979_thru_November_2015_v6.png P_leAse notice the date on which they published the results, December 1st, 2015. The latest revision not only chaged their adjustment processes in consideration of those items you identified, and more, they revised their operational processes to allow for near immediate publication of the entire satellite data.. That data which has more complete surface coverage, and is more readily available.
How’s NOAA doing? A hint; NOAA never reaches full data coverage of the land surface stations not of the planet’s surface, and at this point in the month is less than 50% coverage of them. At the point they report the data they will be closer to 60% and will top out in the 60-70-% range of the land/sea surface stations (not surface). This is how NOAA will depict the global temperature http://vortex.accuweather.com/adc2004/pub/includes/columns/climatechange/2015/590x455_11182025_201510map.jpg that is derived form this actual land data http://www.ncdc.noaa.gov/sotc/service/global/map-land-sfc-mntp/201510.gif Notice the date on this one, November 17, 2015. After noting the poor quality of the land surface data, the sea surface data is even far worse. From this coverage NOAA will calculate the surface temperature and release it without error bars.
Oh, and folks like Menzie, Joseph, Baffled, 2slugs et al will blindlyaccept it as the absolute truth with no possible errors.
Menzie makes this statement: “Why one shouldn’t obsess on just one data set.” While he obsesses over the ONE surface data-set. You did know that the surface data is all from the same sources? You did know that these data are not independently validated, while the satellite data are? Independent validation is important when considering quality.
There are other views on the satellite data quality, but when considering them look at the sources and consider the over riding probable cause in group think and need to support an AGW hypothesis that is either failed or at least exaggerated.
One of my recurring comments has to do about the focus on the long term data which in reality is the very, very short term. Watch this video to see why: https://player.vimeo.com/video/14366077
Menzie,
You must have a very low regard for your readers’ intelligence when you link to a comment that allegedly “believes in a conspiracy so vast” when the comment actually said “I’m not suggesting that this revision is some sort of conspiracy or hoax.”
Rick Stryker: I was just pointing out that first you say you’re not asserting a conspiracy, then you assert that the data were possibly revised in a manner so as to validate a particular view. Sounds like you are asserting “an agreement between persons with the goal of gaining political power or meeting a political objective”, which is a definition of a conspiracy. In other words, you’re trying to have it both ways.
Menzie, you’re not having a good couple of days. Showing your own bias you exaggerated Rick’s comment to: ” Sounds like you are asserting “an agreement between persons with the goal of gaining political power or meeting a political objective”, which is a definition of a conspiracy. In other words, you’re trying to have it both ways.”
Menzie,
Please point out to me a real “climate change skeptic”, i.e., someone who denies that the climate changes. In lieu of which, please specify a falsifiable “climate change” hypothesis. And why did you stop calling it “Global Warming”?
Regards,
Bruce
Reply ↓
Bruce: I think this guy is representative of a whole cottage industry. (Note I don’t call him an “expert” as he apparently has no degree in anything related to climatology.)
Menzie,
Rather than saying what it sounds like to you, why don’t you stick to what I actually said. What I said was that when the measurement changes to match the theory, that should raise questions about objectivity, especially when the weight of the other evidence (satellite data for example) goes the other way. I further explained this in this comment.
You are merely assuming that I must be alleging a political motive, since it “sounds like that.” But I said no such thing. I explicitly ruled out a conspiracy in my comment. Of course, a group can come to the wrong decision without a conspiracy taking place. Haven’t you ever heard of groupthink? And the motive does not have to be political as you seem to think. They might just have a conviction that the theory is right, as in my Einstein example in the linked comment. Or the motive might simply be scientific glory. Climate scientists have been working to explain the temperature hiatus. The NOAA scientists have an explanation–with the proper measurement, there is no hiatus. If they are right, lots of credit will come there way.
You’ve really got to stop distorting readers’ comments. Have you found the quote yet in which I claim that 500K job growth is typical in a recession? No? Keep looking. I’m sure it must have “sounded like I was saying that.”
rick, you seem to imply the satellite data is raw data, not to be disputed. and that is not the case. satellite data is data which has been transformed into equivalent surface data representation. there are many assumptions made in this data transform. the paper which indicates the hiatus is missing, simply used what they feel is an improvement on the assumptions used to transform the raw data. the surprising issue is the number of people, who by arguing this new result is flawed, are implying the original assumptions are ideal. rarely in science do the original assumptions end up superior to refined assumption in the future.
Bafled, you are clueless about the study. The errors are not based upon the assumptions, but on the omissions.
kind of like when discussing somebody else, one may begin with the statement, “I really like Rick Stryker, but he………….”and then proceed point out all the bad things about the person. common tactic.
Just as amusing in conspiracy mongering is Steven Kopits:
“The pause was becoming a thorn in the side of the AGW crew and it needed to be made to disappear, which happened with the Karl paper. Thus, we have motive and opportunity, and therefore the revision is suspect.”
When he alleges motives, I wonder if he looks in the mirror in the morning. This from a guy whose livelihood literally depends on the oil industry.
The lower troposphere is the graph most commonly discussed in climate circles. Drift is an on-going issue with satellites.
As you note, the rise is 0.14 C / decade. And in my Carney piece, I write:
“Satellite data tell a similar story. The temperature steps up by about 0.7 deg C from the early 1980s to 1998, but stabilizes thereafter. Thus, the satellite data shows a ‘pause’ in global warming since 1998. There has been no statistical warming in the satellite data for seventeen years.
“Whether this pause will last is an open question. Temperatures have been rising at the pace of 0.1 deg C per decade since 1880. Although we have seen relatively flat temperatures since 1998, even climate skeptics would envision long-term warming will resume at some point.”
Thus, my analysis is consistent with the (UAH) satellite data and long-term terrestrial temperature readings.
Skeptics tend to prefer satellite readings because they offer near global, real time, consistent readings. Thus, if there is a methodology change, it has to be applied uniformly. Finally, there are two similar satellites measuring the atmosphere, so if they start to deviate from one another, then that prompts a further investigation.
By contrast, terrestrial stations are highly heterogeneous in location, jurisdiction, geographic dispersion, etc. And our sea temperature readings are still quite incomplete and rudimentary. As a result, we believe satellite data is higher quality and less prone to tampering than terrestrial data, but of course, there is no guarantee.
RSS and UAH use the same satellite data, but they come up with significantly different products. UAH has TLT coverage from 85S to 85N. RSS has TLT coverage from 70S to 82.5N. Satellites don’t measure surface temperature. For instance, the oft-cited UAH TLT measurement approximates the temperature of the atmosphere at an altitude of close to 4500 meters. RSS is similar. Comparing them to surface temperature records is filled with numerous assumptions – several of which are dubious. The results of every surface temperature dataset is based on publicly available data and methodology. The same cannot be said for the satellite products. RSS has made much of their code public. UAH has not.
Anyone that thinks these products are superior to the surface temperature datasets doesn’t know much about their history, how the measurements are made, or what they actually represent. As I mentioned above, RSS and UAH — despite using the same satellite data — do not provide the same latitudinal products. There is a reason why. I strongly suggest anyone interested in temperature series read UAH TLT Series Not Trustworthy which includes a letter by a (now retired) satellite design engineer who published a peer-reviewed paper a dozen years ago pointing out some probable errors. RSS accepted the reality that the TLT product was being biased and they dropped coverage of problematic geographical regions.
Kevin likes to live in the past. UAH processes have been changed several times since those issues were accepted by UAH. Since Swanson wrote his paper UAH has gone though these revisions and more:
Version—Correction description———————-Temp change –Year
5.0 ——–Non-linear diurnal correction ———–0.008 ——2003
5.1 ——-Tightened criteria for data acceptance -0.004 ——2004
5.2 Correction of diurnal drift adjustment ——-0.035 ——2005
5.3 Annual cycle correction ——————————0 ————2009
5.4 New annual cycle ————————————0—————-2010
5.5
5.6
6.0v4 (the current version) Complete rewrite- –0.036 ———–2015
Constant upgrades is the way of science. How many version are there of NOAA temps, NOAA ERSST v4 SST, GISS, etc. You seem to be complaining that updates are bad for these systems. NOT TRUE.
CoRev – which of those corrections addresses the elevation/surface ice problem described by Swanson? Hint: None of them.
Which of those corrections changes the fact the satellite TLT data is equivalent to 4k meters above the surface? Hint: None of them.
It’s easy to cut and paste from Wikipedia, it’s more difficult to actually answer the questions asked.
Kevin, you pose an interesting conclusion with: ” …which of those corrections addresses the elevation/surface ice problem described by Swanson? Hint: None of them.” When in your previous comment you said this: “The same cannot be said for the satellite products. RSS has made much of their code public. UAH has not. ” Since you have not seen their code, how can you know what they did?
Furthermore, you also said: ” Comparing them (the satellite data) to surface temperature records is filled with numerous assumptions – several of which are dubious.) The most common comparison is in the trends based upon their anomalies and not their absolutes.
CoRev asks: Since you have not seen their code, how can you know what they did?
With the release of V6.0 Spencer, Christy, and Braswell wrote “Note that trends are noisy over Greenland, Antarctica, and the Tibetan Plateau, likely due to greater sensitivity of the satellite measurements to surface emission and thus to emissivity changes over high altitude terrain; trends in these high-altitude areas are much less reliable than in other areas. “
This is exactly the problem Swanson pointed out 12 years ago. It’s the problem that caused RSS to drop coverage below 70S and over problematic geographical areas.
________________________________________
CoRev writes: The most common comparison is in the trends based upon their anomalies and not their absolutes.
Whether we’re talking raw data, anomalies, or trend comparison does not negate the fact that there are numerous assumptions being made in comparing data from 4.5 km to data from the surface.
And of course when we use satellite data it’s all anomalies: with surface temperature we could, if we wanted, compare absolute temperatures – no absolute temperature data is available for the satellite series. I suspect from your comment that you never realized that there is no absolute temperature data available for either RSS or UAH.
Furthermore, pseudo-skeptics that tout the satellite data are pulling a bait and switch to fool the ignorant (or themselves). Because it’s labeled lower tropospheric temperature and we live in the lower troposphere one assumes it’s a valid comparison – but how often do you see the comparison include the fact that the satellite temperatures are a couple miles over our heads? I understand that the comparison is oranges to tangerines, scientists understand the comparison is oranges to tangerines, but many people don’t. Climate con-men can trade on that ignorance – by claiming that the satellite data ‘disagrees’ with the surface data. How can measurements of temperature at the surface and at 2 1/2 miles altitude disagree with each other? How can temperatures at that altitude better represent surface warming than actual surface measurements?
The one thing I notice about climate change deniers and skeptics is that they can not articulate the scientific argument for how climate change works. It is rather ludicrous to argue against a claim, when you don’t even know what the claim is. So let’s hear from the climate change skeptics/deniers. What is the argument put forward by scientists who claim that global warming is both real and man made? I bet you can not do it.
Ben, before answering your challenge define what you meant by ” climate change”, “works” and “global warming”. I do agree: It is rather ludicrous to argue against a claim, when you don’t even know what the claim is (or its terms mean.)” Did you mean the AGW or the Global Warming, Climate Change, and the other sub-components hypotheses of the science.
If you want to define the subcategories of each of these term then we can discuss. Otherwise the arguments center on how much of (climate change, global warming, etc.) are caused by man made. If you can find the science literature that irrefutably defines that number then we can also discuss that.
No one of any common sense would deny that the climate doesn’t change. That we have had global warming since … and cooled since … (that ole climate changing thang). If you think you have even come close to defining the argument, then define its limits for discussion. After that count how many angels dance on ….
Ben, you are probably saying to yourself I told you so, but that was one of the most infantile and inarticulate questions I have seen in many years. If you want to define the argument you want discussed, then we will.
Whether man made or not, how does climate change happen. It really is quite simple. Don’t overthink it.
Ben, that;s what I thought. You don’t know how to formulate the question. How does the climate change? Which component?
The question is properly formatted as is. Since you obviously don’t know the basics of the science, I will give you some hints. Start with the thermodynamics. Move on to how atmospheres influence the thermodynamics. Only then are you ready to interpret the data. The argument put forward by climate scientists to defend the claim that climate change is both real and man made follows this path. I don’t think you have bothered to follow the argument, though, so you get caught up in a lot of irrelevant issues like “which component”. Climate scientists have one unifying argument for how man made climate change works. What is it? If you can’t articulate it, even after all these hints, then you don’t know what you are arguing against.
Ben, you are embarrasing yourself by failing to use any detail to formulate your question. You started with: “…I notice about climate change deniers and skeptics is that they can not articulate the scientific argument for how climate change works. It is rather ludicrous to argue against a claim (question), when you don’t even know what the claim (question) is.”(My add). You then, after being challenged, clarified with:
“Whether man made or not, how does climate change happen.” Finally, after another challenge to define what you are questioning, you clarified with a hint that you were talking about “thermodynamics”. But you then eliminated one whole segment of the science natural factors, by saying this: “Climate scientists have one unifying argument for how man made climate change (AGW) works. ” After all this tooth pulling commentary to get you to define your question, it is now limited to “man made climate change”. (AGW).
Just to be clear about how poorly formed is your question, I did a search on your phrase “one unifying argument of climate change”. If it even exists it should have many links. Nope! I then went to the Wiki link that the search provided and searched within it. Nope! Worse the Wiki link talked about Global Warming, just one component of climate change. In the end your own ignorance on the climate change/AGW subjects allow you to think you are well defining a a huge and complex issue.
I suspect you are leading to the ACO2 component of global warming, but are trying to be too cute to actually formulate the question.
Menzie wrote:
“I’ve always wondered by climate change skeptics focus on satellite data; I guess “satellites” conjure up images of high-tech super-accurate measurement..”
I have never wondered why anthropomorphic global cooling, uh, I mean anthropomorphic global warming, uh, I mean anthropomorphic climate change advocates only use computer models to prove their theories. Actual measurements are such pesky things when they don’t support your agenda.
What is scientific anyway?
Ricardo: Someday it would be nice if you actually write something germane to the topic (and at the same time coherent). Do you actually have anything substantive to write regarding the upward trend in temperatures according to the latest version of the satellite data? Are they now irrelevant, since they do not conform to your Weltanschauung? Your comment indicates you don’t even understand the import of the post (or you didn’t read before writing, which I could imagine is the case).
Mernzie, do you actually have anything substantive to write regarding Ricardo’s comment? Furthermore, do you have any understanding of the import for the estimated increase by 2100 of the decadal average shown in the satellite data-sets? Can you define the importance of the estimated increase by 2100 on the CO2 sensitivity?
CoRev writes: “…do you have any understanding of the import for the estimated increase by 2100 of the decadal average shown in the satellite data-sets? ”
Satellite data from 4.5 km altitude has an undertermined import on *surface* temperatures in 2100. Meanwhile, surface temperature data indicates we are headed for Pliocene temperatures by the end of the century. The 2C Paris ‘target’ means another degree of warming by 2100 – that puts us back million of years into the Pliocene as far as temperatures are concerned. In the Pliocene we see a sea level rise of 20m. So, by moving to Pliocene temperatures are we bequeathing to some future generation 20m of sea level rise? If not, why not? Why will this time be different?
In a previous comment you noted that “…we have had global warming since … and cooled since … ” which is a necessary point to make – but you have never actually realized it’s importance. Paleoclimate has changed many times. Estimates of climate sensitivity from paleo data tell us the fast-feedback sensitivity is likely 3C to a doubling of CO2. The long-term sensitivity is higher.
Kevin, sigh! You state: “In a previous comment you noted that “…we have had global warming since … and cooled since … ” which is a necessary point to make – but you have never actually realized it’s importance. ” Of course I(i didn’t, because it was a question for Menzie.
You start off by citing the obvious: “Satellite data from 4.5 km altitude has an undertermined import on *surface* temperatures in 2100.” and then go off into climate never land with an exaggerated call for a relationship to the Pliocene for a 1C degree increase from today. Temperature was/is the only factor?
Your comment is an example of why the constant alarmist fear mongering and exaggerations have caused this issue to lose credibility and position of importance.
CoRev writes: “…an exaggerated call for a relationship to the Pliocene for a 1C degree increase from today”
Not exaggerated at all. Menzie should show this temperature graph from Earth’s Climate History: Implications for Tomorrow, Hansen & Sato (2011)
You have to go back over 3 million years to find temperatures +1C from today.
Kevin, Hansen? 😉 Your comment is an example of why the constant alarmist fear mongering and exaggerations have caused this issue to lose credibility and position of importance. But at least you are showing a long term view. Even though you are trying to say highly smoothed data, where the peaks and valleys are removed, compares to today’s shot term ?unsmoothed? temps.
As James Hansen has explained many times, the basis of our understanding is from:
1) Past Climate
2) Observations
3) Theory
4) Computer models
Anyone that thinks the science is based on computer models *isn’t* thinking. The theory existed before computer models came into existence. Computer models are a tool that can help to explain the dynamics of the climate system. They provide a laboratory environment to run experiments.
Ricardo is obviously unfamiliar with the history of the science. Here’s a short list of the most important papers prior to the introduction of computer models:
On the Temperatures of the Terrestrial Sphere and Interplanetary Space, Fourier (1824)
On the Absorption and radiation of Heat by Gases and Vapours, and on the Physical Connexion of Radiation, Absorption, and Conduction, Tyndall (1861)
On the Influence of Carbonic Acid in the Air upon the Temperature on the Ground, Arrhenius (1896)
The artificial production of carbon dioxide and its influence on temperature, Callendar (1936)
The Influence of the 15μ Carbon-Dioxide Band on the Atmospheric Infra-red Cooling Rate, Plaas (1956)
Carbon Dioxide Exchange Between Atmosphere and Ocean and the Question of an Increase of Atmospheric CO2 During the Past Decades, Revelle and Suess (1957)
Distribution of Matter in the Sea and Atmosphere: Changes in the Carbon Dioxide Content of the Atmosphere and Sea due to Fossil Fuel Combustion, Bolin and Eriksson (1958).
The Concentration and Isotopic Abundances of Carbon Dioxide in the Atmosphere, Keeling (1960)
Remove every computer model simulation of global climate and our understanding and knowledge would really change very little.
Kevin makes another strawman argument: “Anyone that thinks the science is based on computer models *isn’t* thinking.” Ricardo said this:
” climate change advocates only use computer models to prove their theories. Actual measurements are such pesky things when they don’t support your agenda.” Which you do not deny. That Ricardo comment is a long way from what you say it is.
The cite in Ricardo’s comment does say this though:
“Science is a method. Here are the fundamentals of the method:
Someone puts forth a falsifiable hypothesis. Non-falsifiable hypotheses are not part of the scientific method.
The falsifiable hypothesis is tested against data, either from observation or experiment.
If data from observation or experiment are consistent with the falsifiable hypothesis, then the hypothesis survives to be tested by additional observation or experiment. However, there is no such thing as definitive and final proof of a scientific hypothesis. No matter how much consistent evidence may be accumulated, it is always possible that further evidence may emerge that may invalidate the hypothesis.
If any data emerge that are inconsistent with the hypothesis, then the hypothesis is wrong and must be rejected. Period.”
A historical look at the climate calamity claims, most are from models, shows Ricardo to be mostly correct with his ” climate change advocates only use computer models to prove their theories. Actual measurements are such pesky things when they don’t support your agenda.”.
CoRev – You still don’t understand what a strawman argument is. It’s when you argue against something someone never said.
Ricardo: “climate change advocates only use computer models to prove their theories”
KTO: “Anyone that thinks the science is based on computer models *isn’t* thinking.”
It’s pretty clear what Ricardo said – you even quoted that yourself. So I was not making up a strawman – I was using Ricardo’s exact words and refuting them (utterly and completely) by providing numerous papers that define the theory of AGW – all written before computer models existed.
Ricardo – your “scientific” link goes to a blog page by a commercial litigation lawyer with no published scientific articles and no scientific educational background.
Do you take your pet to an auto-mechanic? Do you visit the dentist when your car breaks down?
I take my pet to a veterinarian. I take my car to the auto-mechanic. I go to scientists for questions about science. I try not to deal with lawyers at all.
Ricardo – there is only one extant theory that explains the three graphs at the top of this post – anthropogenic global warming. No other theory can explain tropospheric warming and stratospheric cooling. It was predicted by theory nearly 50 years ago using computer models before we had the data showing it as fact.
That you don’t know this reveals your ignorance of the subject. Manabe & Wetherald published “Thermal Equilibrium of the Atmosphere with a Given Distribution of Relative Humidity” in 1967. It has been voted by climate scientists as the most influential climate paper of all time. Stop reading pseudo-science from denialist websites and start reading some actual science instead.
Kevin, anthropogenic global warming (AGW) ?theory?. The abstract for your cite doesn’t even mention anthropogenic causes, so for now let’s forget that linkage. The paper does reference a CO2 sensitivity of ~2C for a doubling of CO2. But, it’ importance is often cited as the explanation of the water vapor feedback to atmospheric warming, and not the cause of CO2 increase. That further removes the direct anthropogenic cause from the Global Warming hypothesis, since it is also accepted that mankind does not directly influence atmospheric water vapor.
Climate science has conflated several climate sub-component hypotheses to understand the Thermal Equilibrium of the Atmosphere, the subject of study in your cite to develop an inclusive hypothesis. To become a widely theory versus a widely accepted hypothesis, the experiments (models) derived from it must make valid and well defined predictions. In this they have failed, miserably, so to call it a theory is premature. In the end what we see is the conflation and exaggeration endemic in the climate science debates, hypothesis to theory, and AGW versus GW.
The importance of the hiatus in this discussion is clear. In the ~50 years since Manabe & Wetherald, the satellite data shows ~36% of that period with zero or even negative warming. From that we can analyze the Manabe & Wetherald sensitivity estimate to be closer to ~1.25C instead of their ~2C. Which is more correct? Dunno, nor do you. Stop reading pseudo-science from alarmist websites and start critically reading actual science instead of exaggerating it.
CoRev – Manabe and Wetherald’s paper didn’t apply *solely* to anthropogenic global warming – it showed that increases in CO2 lead to warming. This helped explain both *past* climate changes and possible future climate changes. The physics is the same regardless the source. Nature doesn’t care if the CO2 molecule was produced by man.
More important it showed a *fingerprint* of CO2 warming: i.e., stratospheric cooling. Radiative forcing from CO2 leaves a noticeable mark in the atmospheric profile. This prediction has been borne out by observations. No other theory predicts this. Solar forcing, for instance, would not warm the troposphere while cooling the stratosphere.
Satellite data is not surface data. Attempting to conflate them is an error on your part. Satellite data cannot explain paleoclimate. Simple, naive math shows you are grossly in error. We have warmed 1C over pre-industrial. During this time we have increased CO2 from 280 to 400 ppm. A 120 ppm increas and another 160 to go until we double. This implies a sensitivity of 2.3C – and that is understating the value since even many of the fast-feedbacks aren’t fully accounted for yet. And remember, as of now we believe that *more* than 100% of the current warming is anthropogenic..
Were the 80’s warmer than the 70’s?
Were the 90’s warmer than the 80’s?
Were the 00’s warmer than the 90’s?
Are the teens on pace to be warmer than the 00’s?
Now, please explain to me the hiatus/pause in global warming. What land/ocean data series are you using? Or are you simply basing it on 4.5km altitude proxies when we have actual surface data?
Climate scientists consider this most influential paper ever written. CoRev thinks it’s rubbish. Now, do we need to revisit Dunning-Kruger?
Kevin, don’t you get tired of throwing all the straw around? “CoRev thinks it’s rubbish. ” I never said anything near that. What I do think is your analysis of it is exaggerated. you also throw straw here: “Satellite data is not surface data. Attempting to conflate them is an error on your part.” Wow! Where did I or anybody say they were the same? You also made this claim of straw: ” More important it showed a *fingerprint* of CO2 warming: i.e., stratospheric cooling… No other theory predicts this. Solar forcing, for instance, would not warm the troposphere while cooling the stratosphere. ” i dunno, some climate scientists would say the quantity of ozone has some minor 😉 influence on stratospheric temps.
You are arguing that all of the GHG influence is from ACO2. You are trying to make a case that the surface data is some how superior to the satellite data. Explain how. Your grossly misleading statements makes me think you only believe this because it supports your belief. Perhaps you think that the surface data coverage is better than the satellites? Explain this: http://www.ncdc.noaa.gov/sotc/service/global/map-land-sfc-mntp/201510.gif Perhaps you think that the satellite 4.5km altitude proxies are not as good as the surface 2 meter proxy. Explain why using the NOAA coverage information I provided.
What parts of your argument(s) can not be refuted or more clearly defined with alternative hypotheses? I am questioning your belief in absolutes.
CoRev wrote regarding Manabe and Wetherald: “they have failed, miserably”
KTO wrote: “CoRev thinks it’s rubbish.”
CoRev whines: “” I never said anything near that.”
Obviously CoRev doesn’t even remember what he wrote.
——————————————————————————————–
CoRev writes: (something … something.. unclear … ) Ozone!
Ozone will have an effect on stratospheric temperature and (especially) UV at the surface. Harmful UV is the reason why we have tried to diminish the use of CFC’s because they chemically induce ozone depletion. But you don’t understand radiative transfer physics if you think stratospheric cooling is only due to ozone. The same calculations (maths and physics) that lead to the conclusion that less ozone will cool the stratosphere also lead to the conclusion that more CO2 will cool the stratosphere. You can’t mathematically agree with one without agreeing to the other. I.e., ozone depletion cooling the stratosphere supports the AGW theory that CO2 increase will cool the stratosphere. And there is no ozone theory of global warming.
This is not an area that is conducive to soundbites. I highly recommend anyone interested read CO2 – An Insignificant Trace Gas? Part One and Stratospheric Cooling at The Science of Doom.
——————————————————————————————————————————————–
CoRev writes:” You are trying to make a case that the surface data is some how superior to the satellite data. ”
I have already answered that question. Surface data tells us temperatures at the surface – the area of interest/concern. Satellite data – even if it were perfect, without any flaws – tells us atmospheric profiles at miles above the surface. They cannot tell us temperatures at the surface – they don’t attempt to. Using them as proxies for surface temperatures is comparing oranges to tangerines.
————————————————————————————————————————————————
CoRev – the MSU temperature data was derived from 4 of 11 scan positions – that’s 36% coverage (and no data above 82.5N or below 82.5S). The satellites also passed over individual geolocations at the same time each day. Some locations at midnight, some at noon, others at 3:31AM, others at 7:43PM …. etc., etc. How did they derive a daily average passing only once over a location and at the same time each day?
There’s ole Kevin loading his wagon with straw, again. What I said was: “…Climate science has conflated several climate sub-component hypotheses to understand the Thermal Equilibrium of the Atmosphere, the subject of study in your cite to develop an inclusive hypothesis. To become a widely theory versus a widely accepted hypothesis, the experiments (models) derived from it must make valid and well defined predictions. In this they have failed, miserably, so to call it a theory is premature….”
But Kevin believes it was related to his cite: “CoRev wrote regarding Manabe and Wetherald: “they have failed, miserably”
KTO wrote: “CoRev thinks it’s rubbish.”
CoRev whines: “” I never said anything near that.””
The subject of the statement was FAR removed from Kevin’s claim “Manabe and Wetherald”.
Kevin, try again to guess what that ole subject was.
Kevin also disagrees with my answer to his absolute claim. My answer to Kkevin’s ” (something … something.. unclear … ) Ozone! “You also made this claim of straw: ” More important it showed a *fingerprint* of CO2 warming: i.e., stratospheric cooling… No other theory predicts this. Solar forcing, for instance, would not warm the troposphere while cooling the stratosphere. ” i dunno, some climate scientists would say the quantity of ozone has some minor influence on stratospheric temps.”
Kevin answered with: “Ozone will have an effect on stratospheric temperature…” No need to go further. If part of the absolute statement is wrong the whole is also.
Finally, kevin tries more slight of had with an interesting question: “How did they derive a daily average passing only once over a location and at the same time each day?”
Interesting because he already know the answer. Satellites derive a temperature for a grid pretty much the same way surface data-set processes do. Notice neither temperature is for the LOCATION unless coincidence allowed. Moreover, the satellites will have much higher likelihood of having passed over that grid and collected data, especially for ocean locations, than will the surface data have any data at all.
Kevin knows this, but to remind anyone who may still be reading NOAA, officially shows how much land coverage they actually have every month. This is the current: http://www.ncdc.noaa.gov/sotc/service/global/map-land-sfc-mntp/201510.gif Consider how much worse it is for the oceans.
So let me ask Kevin a question: How did they derive a daily average for a location/grid without any data at all?
CoRev – Manabe and Wetherald predicted that CO2 would cool the stratosphere. Did that prediction come true? Has the hypothesis been verified or falsified?
I know it’s difficult for you to answer a simple question, but please try.
Kevin asks: “CoRev – Manabe and Wetherald predicted that CO2 would cool the stratosphere. Did that prediction come true? Has the hypothesis been verified or falsified?” What prediction? It was an explanation for what was already known, that stratospheric temperature changes, from the prior decades of radiosonde data.
It is this exaggeration of importance of ACO2 over the other GHGs which causes this denial of the importance of ozone to the stratospheric temperatures, and the many other factors, including H2O, another GHG, impacting the tropospheric temperature.
CoRev writes: “What prediction? It was an explanation for what was already known, that stratospheric temperature changes, from the prior decades of radiosonde data.”
Manabe and Wetherald didn’t predict temperature would change – they predicted it would *cool* with increased CO2. No, this wasn’t known. And it couldn’t have been observed because no global stratospheric temperature time series existed then. We began a global stratospheric temperature series once satellite data became available starting in 1979. And It wasn’t until Gillett et al (2011) that Detection and Attribution confirmed the stratospheric cooling due to CO2. 44 years after Manabe and Wetherald published their paper.
You’re full of B.S. CoRev. And still denying basic facts.
Kevin stop the strawman building. Now you’ve added the term “time series” to the discussion with this latest claim: “…no global stratospheric temperature time series existed then.” Your claim exceeds credulity. With the use of the absolute “no”, for those many decades prior to the 1967 Manabe & Wetherald, all that radiosonde data was never used, shared consolidated in any way, and the stratospheric temperature changes not known? Are you trying to tell us that the stratospheric temp trends in the 50s and 60 were unknown until Manabe & Wetherald?
CoRev – show me a global radiosonde stratospheric temperature dataset from prior to 1967. Sorry, none exist. In other words – you’re still full of sh*t 🙂
Obviously it needs to be a time-series – otherwise it’s a single point in time. How can a single point in time show any changes? You’re thinking cap apparently fell of (assuming you ever had one).
You know, just waving your hands and spilling words onto the screen isn’t an argument. You claim the data existed. I’m from Missouri – show me. Pretty simple, put up or shut up time.
Kevin, this is what I said re: the stratosphere and radiosonde data: “It was an explanation for what was already known, that stratospheric temperature changes, from the prior decades of radiosonde data.” You then went off on “time series data” and limited it to “global” time series. That is adding straw to the discussion and turning it into a strawman argument, by following your introduced subject definition. Why should I take that bait?
Radiosonde data had been measuring stratospheric conditions including the rise and fall of its temperatures. Its temperature changes were a known quantity. Yes, that data was stored, mostly by the national meteorological units. Here’s NOAA’s graph of the LS radiosonde data: http://www.climate.gov/sites/default/files/Stratospherictemp_1958-2012_radiosondes.png Notice the direction before 1967. This graph shows why the theory needs some adjustment: http://junksciencearchive.com/MSU_Temps/Stratosphere1278-1204.gif You keep throwing strawmen arguments into the mix. Your absolute belief in the AGW clouds your thinking.
The issue has been “how much warming is from natural and how much from anthropogenic causes”? No amount of straw nor name calling will change that question until science can irrefutably answer that question.
CoRev – how can a graph produced in 2014 have influenced Manabe and Wetherald? Were they time travelers?
Please show a graph/table data they might actually have seen – not some product put together 5 decades later.
Do you want to know the actual state of the science regarding the stratosphere circa 1967? Try reading an actual science paper. You might find this interesting: A REVIEW OF STUDIES OF EDDY FLUXES IN THE STRATOSPHERE AND MESOSPHERE, BY REGINALD E. NEWELL, 1965. The discussion of heat transport begins at the top of page 8. Note the numerous references to ozone in the ensuing pages. Note that CO2 is never mentioned.
Science from 1965. A graph from 2014. Which is more likely to represent the state of knowledge in 1967?
Kevin, there’s that ole straw wrapped in BS again. Yes, this comment is especially smelly. You ask: “how can a graph produced in 2014 have influenced Manabe and Wetherald?” There’s the strawman by focusing on a nonentity of the reference, the graph’s date. The graph showed two things, the availability of data before 1967, and the stratospheric trend was cooling in that period.
You then provided a 1965 reference, A REVIEW OF STUDIES OF EDDY FLUXES IN THE STRATOSPHERE AND MESOSPHERE, BY REGINALD E. NEWELL, 1965, which shows the same thing.Moreover, this paper reviewed other earlier papers showing stratospheric temp data. This quote explains the availability of stratospheric time series data: “More recently the Planetary Circulations Project has been engaged in a study specifically directed towards an understanding of the mechanics of the lower stratosphere. Data from 230 stations were used at 100, 50, 30 and 10 mb.” Next, I expect you to make some insane comment that stratospheric mechanics does not include temps.
Your quote defining your beliefs : “Manabe and Wetherald didn’t predict temperature would change – they predicted it would *cool* with increased CO2. No, this wasn’t known.” Then I will point out my NOAA radiosonde reference that may show something different:” Here’s NOAA’s graph of the LS radiosonde data: http://www.climate.gov/sites/default/files/Stratospherictemp_1958-2012_radiosondes.png ” Radiosonde data surely was well developed before 1967. NOAA starts this graph in 1958, but similar data had been collected for several decades prior, and the results used by meteorological organizations. Some art the national level. You might also notice the period 1998 on. What would an average of those sources show us? Significant warming? Significant cooling? No change? My bet is on no significant anything, and perhaps even warming while CO2 did this: http://www.woodfortrees.org/plot/esrl-co2/from:1998/plot/esrl-co2/from:1998/trend
As you say: “You know, just waving your hands and spilling words onto the screen isn’t an argument. You claim the data existed. I’m from Missouri – show me. Pretty simple, put up or shut up time.” using your own 1965 reference stratospheric data existed and was well known. I’m not sure the current data irrefutably shows with clarity quite what you think it does.
CoRev – Admit it. You can’t find a single radiosonde stratosphere temperature series prior to 1967, can you?
If you can – and you claim they existed – link to one.
BTW, how many reference to CO2 did you find in Newell?
CoRev writes “Climate science has conflated several climate sub-component hypotheses to understand the Thermal Equilibrium of the Atmosphere, the subject of study in your cite to develop an inclusive hypothesis. To become a widely theory versus a widely accepted hypothesis, the experiments (models) derived from it must make valid and well defined predictions. In this they have failed, miserably, so to call it a theory is premature. In the end what we see is the conflation and exaggeration endemic in the climate science debates, hypothesis to theory, and AGW versus GW.”
This is gibberish. The first sentence is basically unintelligible. ‘Conflated’ is used in the first sentence and ‘conflation’ is used in the last, but what’s is conflated is never stated. No mention is made of which predictions failed. Just asserted. CoRev never states what the theory of AGW is – so it’s more likely his understanding is deficient.
It’s a very basic theory: AGW = anthropogenic global warming. Anthorpogenic = man-made. The theory says that: Human activities lead to increased Greenhouse Gases (chiefly CO2) in the atmosphere which leads to a warmer planet.
That’s it. Pretty simple. Any claim this theory is wrong must show that humans don’t increase GHG in the atmosphere or that increased atmospheric GHG don’t increase global temperatures.
Do human activities increase GHGs in the atmosphere? Yes, chiefly CO2 through fossil fuel use. There is no scientific debate on this fact.
Do increased GHGs in the atmosphere lead to warmer global temperatures. Yes, there is no scientific debate on this fact.
So, why do deniers claim the theory of AGW is wrong?
Because they build strawmen. When asked to define the theory of AGW they can’t or won’t ever state it. We saw CoRev do that shuffle in this thread. Stating it clearly shows they’re deniers of scientific fact. Most of the time they (like CoRev) are arguing against some phantom theory/strawman that they’ve made up in their heads.
Kevin, more straw? The subject of your quote of me related to AGW was the conflation and exaggeration and used of AGW to GW as an example. i never said the simplified AGW, actually the AGHG theory was: “… wrong must show that humans don’t increase GHG in the atmosphere or that increased atmospheric GHG don’t increase global temperatures.” (I amended the acronym to AGHG to match your comment.)
Strangely the modification from conflation and exaggeration to denial of the very simplified ACO2/AGHG/AGW theory you defined is exemplary of both. Look through the comment thread and see where iI never denied any of them. Another clear example of strawman argumentation.
Or we can look through the comment thread and find where Kevin defined a strawman argument to compare his above comment for verification.
CoRev wrote” “Climate science has conflated several climate sub-component hypotheses..” I asked, what has been conflated. No answer.
And CoRev wrote: “To become a widely theory versus a widely accepted hypothesis, the experiments (models) derived from it must make valid and well defined predictions. In this they have failed, miserably, so to call it a theory is premature.” If we ignore the sense that English must not be his first language, we can glean that Something is not a theory. It’s (something’s) predictions have failed miserably.
It’s not Manabe and Wetherald – cause CoRev denied that’s what he was talking about. It’s not AGW – because CoRev now denies that too. Apparently there is some other theory – that CoRev is secretly keeping to himself that he’s talking about. What theory has failed CoRev? What is the secret hidden theory whose predictions have failed miserably?
It’s just as likely that CoRev doesn’t know what he’s talking about. That, in fact, would make a lot of sense.
Kevin, Conflated: “to bring together : fuse” For heaven sake stop digging. your hole is deep enough to bury you and Ben together. Which answers your question. Let’s compare your simple hypothesis: “The theory says that: Human activities lead to increased Greenhouse Gases (chiefly CO2) in the atmosphere which leads to a warmer planet. ” to Ben’s 3 paragraph treatise. Yours is the simple starting point and Ben’s version is one example of the conflated hypothesis.
There’s got to be a reason for Kevin to continue this misrepresenting of what what he thinks was said while ignoring the actual comment contents. Menzie has done it, Ben has and Kevin several times just in this comment thread. Why is it you guys are so desperate to be correct and need to falsify statements?
CoRev wrote” “Climate science has conflated several climate sub-component hypotheses..” I asked, what has been conflated.? Still no answer.
CoRev, I didn’t write, “Climate science has conflated several climate sub-component hypotheses..” Ben didn’t write that sentence either. *YOU* did. So, tell us, what sub-component *hypotheses* have been conflated by climate science? I did mention that most of what you write is gibberish – now you want us to be mind-readers too?
Either you can explain what you wrote or you can’t. Obviously it’s beginning to look like you can’t.
BTW, ‘conflated’ does mean to combine two concepts. But treating two separate identities as one is often a mistake. I.e., you conflated TLT satellite sensors with SST satellite sensors. TLT sensors have always been MW, while SST were, prior to 1997, only IR. I knew back in August what your mistake was – you didn’t actually understand the subject, did a quick search, and found a page that said satellites measure temperatures using IR. You just didn’t read enough to realize they were talking about SST temperatures.
Oh, and still waiting on that comparison of satellite SSTs versus ERSST. Please show us how much better the satellites are.
Kevin, you unwittingly gave us an example of the fusion of theory/hypothesis to create a new theory. “It’s a very basic theory: AGW = anthropogenic global warming. Anthorpogenic = man-made. The theory says that: Human activities lead to increased (mankind causes increases in AGHGs faster than the sinks can remove them theory) Greenhouse Gases (the GHE theory) (chiefly CO2) in the atmosphere which leads to a warmer planet. “= (the AGW hypothesis)
Thank you for exemplifying the: ” “Climate science has conflated several climate sub-component hypotheses …” even in the simple forms. Now when we pursue climates science into more expansive and complex subjects such as “Stratospheric Cooling is due to increased CO2” it fuses even more sub-component hypotheses.
KLevin asks: “CoRev – Admit it. You can’t find a single radiosonde stratosphere temperature series prior to 1967, can you?
If you can – and you claim they existed – link to one.
BTW, how many reference to CO2 did you find in Newell?”
That was after his own Newell reference reviewed several radiosonde papers all using temperature series data. Kevin obviously thinks time series — “A time series is a sequence of data points, typically consisting of successive measurements made over a time interval” did not exist to time series analysis on his own reference. Kevin don’t you read the papers and the comments? Some how it appears your mind is so closed to ignore the obvious presented. Unless you want to say your Newell reference is rubbish, the analysis done in the papers it referenced were not done in a vacuum.
Then he shift to CO2????
CoRev – please post a citation to *any* global temperature radiosonde series prior to 1967. Newell, does not cite a single global radiosonde temperature series. He cites individual studies for single years, or year over year comparisons, typically at single locations. No global series citations
CoRev can’t prodiuce a single citation. He can’t, he won’t, they didn’t exist.
Instead he has Manabe and Wetherald time-traveling forward to 2014.
Kevin, straw??? Again???? Who cares, except you, whether there was a “global” time series. Both these terms were introduced by you, and you continue to argue over these two terms, when the issue was whether the stratospheric cooling and/or temperature changes were known in 1967. Your own reference showed that the data was available for decades.
CoRev writes: “[the] Newell reference reviewed several radiosonde papers”- more lies from CoRev.
Newell mentions radiosondes *once* – “The cross-sections of temperature used appear in Fig. 11. In addition to radiosonde and Rocket Network data, the results of the rocket grenade experiment have been taken into account in the construction of Fig. 11.” Yep, that’s CoRev’s “Newell reviewed several radiosonde papers”.
CoRev apparently missed several of Newell’s statements: “Presently there is not a global average of stations so that the third term is the only one that can be examined., Its evaluation is complicated by the fact that the sign of certain transports may change systematically with season in, the upper stratosphere (while ‘they always have the same direction in the mean in the troposphere).”
And (from the conclusion: “As far as the heat budget of the 25-80 km region is concerned the basic need is for better temperature data. The reliability of the temperature elements used with rockets must be improved and temperatures should be obtained to 70 or 80 km routihely. We can then test the ideas concerning a countergradient heat flux in the 55-80 km region. Good geographical coverage is also obviously important. ”
CoRev is consistent – consistently wrong.
Kevin, your whole argument is based on lies. This is the portion of my latest comment to which you responded: ” when the issue was whether the stratospheric cooling and/or temperature changes were known in 1967. Your own reference showed that the data was available for decades.”
You don’t want to admit that the stratospheric radiosonde data was available and widely used before1967. This is what NOAA says:
“With the formation of regional and global meteorological observation networks in the nineteenth and twentieth centuries, more data were becoming available for observation-based weather forecasting. A great stride in monitoring weather at high altitudes was made in the 1920s with the invention of the radiosonde. Small lightweight boxes equipped with weather instruments and a radio transmitter, radiosondes are carried high into the atmosphere by a hydrogen or helium-filled balloon that ascends to an altitude of about 30 kilometers before bursting. During the ascent, these instruments transmit temperature, moisture, and pressure data (called soundings) back to a ground station. ”
Its easy to ignore the strawman factor of most of your comments, as they are so ludicrously wrong. Plus, they so seldom actuyally relate to the central discussion
CoRev – Unable to defend any of his lies, completely loses track of his *original* lie: that Manabe and Wetherald made no prediction, only explained *known* stratospheric cooling.
1) You can’t explain *known* stratospheric cooling if there was no such knowledge extant at the time.
2) The fact of stratospheric cooling wasn’t known in 1967 because of insufficient data.
3) Radiosonde data was not systematically collected until the IGY 1958. If all data collected had been immediately published (which it wasn’t) it still would have been over such a short time period as to be inconclusive – especially since the eruption of Mt Agung in 1963 *warmed* the stratosphere by 5C.
4) As Newell wrote, temperature data was the largest drawback to study of the upper atmosphere.
5) It’s also evident from Newell that ozone was considered the key element to stratospheric heat transport, not CO2. Ozone is mentioned 23 times; CO2 *zero* times.
Manabe and Wetherald’s prediction was that CO2 would cause stratospheric cooling. This was completely new. Because of this it was voted *the* most important scientific paper by climate scientists. CoRev, with his wealth of misinformation, still believes *he* knows better. Believing you are smarter than all the experts in a field is generally a sign of insanity or Dunning-Kruger.
Kevin, I’m not going to follow you down this latest straw lined rabbit hole.
Kevin O’Neill,
Can you tell us what the CORRECT world average temperature should be? If not, how do you know if global climate change is either good or bad? And that is before we even ask can humans come close to having a measurable impact on the worldwide environment?
Ricardo – you ask an ill-posed question: there is no one CORRECT temperature and we do not need to know this phantom temperature to know that changing the current temperature will change the planet. Just as important as the average temperature is both it’s distribution and its extremes. We see already an increase in extreme events. What’s the optimum temperature for growing corn? For bananas? For potatoes? Etc. And with increased temperatures we also get changes in precipitation. What will be the effect on aquifers? Who will get more rainfall and who will get less? Climate models and observations give us some rough ideas on these regional changes, but they’re not robust to these types of questions and uncertainty is NOT our friend.
Because temperatures on a daily basis can vary by 20C it would seem that increasing the average temperature by a single degree or two would be small in comparison, but one needs to remember that the global difference between glacial and interglacial conditions is just a few degrees. If we increase global temperatures another degree we will have increased the Earth’s temperature to levels not seen in millions of years; before humans appeared on the scene.
At these increased temperatures we will see the arctic and antarctic icesheets erode and contribute to rising sea levels (as they have already started to do). There is large disagreement among scientists how fast this will happen – but there is no disagreement that it *will* happen. With Pleistocene temperatures there is every reason we will (eventually) have Pleistocene sea levels. Meltwater pulse 1A saw 20 meters of sea level rise in 400-500 years. Because of the present distribution of ice on the planet that speed of increase is unlikely today, but it gives an idea of how fast this can occur *naturally* without our influence.
With the types of changes in global temperature that are coming our way, all we can say for sure is that there will be significant changes. Not just for us, but for the myriad of plants and animals that also inhabit the planet. We may be able to adapt quickly, others may not. It’s a gamble with few benefits and many fat-tailed risks.
I see that CoRev is making the same sorts of mistakes here as in the thread where he responded to my challenge. For reference, here was my original challenge to all climate change deniers/skeptics:
“What is the argument put forward by scientists who claim that global warming is both real and man made? I bet you can not do it.”
CoRev made a lot of bluster about the question being poorly phrased and not sufficiently specific, but the question is very clear and has a precise answer. Kevin O’Neill has correctly pointed out that CoRev is arguing against strawmen, but what else can you expect – CoRev doesn’t know what the real argument is. It might help to explain the basics.
1. Thermodynamics. The earth absorbs heat from a heat source we call the sun. The earth also radiates energy into space. If at any time the amount of heat absorbed by the earth exceeds the amount expelled, the temperature of the earth will rise. The rising temperature will increase the rate at which heat is expelled from the earth. The temperature will stabilize at the point where the amount of energy absorbed exactly matches the amount expelled. If more heat is expelled than absorbed, the earth cools until the incoming heat exactly matches the outgoing.
2. Atmospheres and how they affect thermodynamics. To understand how an atmosphere affects the thermodynamics of a planet, it is instructive to look at an object without one – the moon. The moon receives virtually the same intensity of solar radiation as the earth, but it has a very different average temperature as well a more extreme distribution. Daytime temperatures at the equator and mid latitudes average 224 degrees Fahrenheit. Nighttime temperatures over the same region average -298 degrees Fahrenheit. Without an atmosphere heat bleeds off from the moon very quickly. All atmospheres slow this process down and allow for a more even distribution of temperatures across the celestial object. The atmosphere itself acts like a greenhouse. Radiant energy can penetrate through the walls and roof of a greenhouse, but at night these form a barrier to slow the escape of the heat. How well it works depends on the composition of the barrier – and this is true of atmospheres as well. Certain clouds can block solar radiation and reflect it back into space. Other gases allow radiation through, but slow down the rate at which the heat can radiate away from the planet. CO2, CH4, and N2O are examples of greenhouse gases that slow down this process. If human activities increase the concentration of greenhouse gasses in the atmosphere, more heat will be retained, resulting in an increased average temperature of the earth.
3. Data. To check on the presence of greenhouse gases we have a variety of sources. We have atmospheric measurements in the modern era, but we have tree ring data going back 2000 years, data from mollusks going back over 10,000 years, and we have ice core data going back 800,000+ years. The data show very clearly that in this entire time span, the fluctuations in greenhouse gas concentrations in the atmosphere were quite minimal until the industrial revolution. Since the late 1700s, these concentrations have increased beyond any natural explanation. Our industries are responsible. As far as as temperatures go, we have over 100 years of surface temperature data from around the planet. More recently, we have satellite data. However, CoRev and deniers/skeptics should bear in mind that we do not have subsurface temperature measurements. The oceans and polar ice caps can and do absorb a large percentage of the excess heat. Periodically, el nino effects suck this heat to the surface so we sometimes get larger than expected surface temperature increases, while other years show flat or even decreasing averages. This is not a gotcha moment, though climate deniers/skeptics like to think it is. We don’t have temperature data from the bottom of the Mariana Trench, but we can observe sea levels and infer that temperatures in oceans must have risen.
4. None of us are climate scientists. For this reason, none of us should be making up our own arguments. We should be looking at what actual climate scientists say. This is what I have done. Points 1-3 form the entire argument made by climate scientists when they claim that climate change is both real and man made. This is the argument that must be overcome to refute the claim. CoRev hasn’t even touched it and neither has anyone else in the denier/skeptic cottage industry. If you disagree with the climate scientists, you are welcome to your opinion, but not your own facts or your own analysis – and you ought to at least know what you are disagreeing with so you don’t keep on throwing up strawman arguments against claims that literally nobody in the scientific community has made.
What that previous comment was supposed to look like (I think)
Ben, thank you for finally putting on paper what you were asking. Except for these phrase in P3 where you began to analyze the fundamentals you provided: “To check on the presence of greenhouse gases we have a variety of sources. ” where I think you were talking about the amount of CO2
and
“Periodically, el nino effects suck this heat to the surface so we sometimes get larger than expected surface temperature increases, while other years show flat or even decreasing averages. This is not a gotcha moment, though climate deniers/skeptics like to think it is. ” Where I think you misinterpreted the el Nino/la Nina factor, suck this heat to the surface. This graph showing the sea temps at depth do not show any higher heat to be sucked to the surface. The surface is warmed and that already warm surface water is moved to areas not previous present, causing warming in previously cool areas and cooling in previously warm areas. Since you started with discussing thermodynamics, I think you probably are aware your suck this heat to the surface, breaks one of the rules.
Of course much of P4 is bogus. You made this claim: “Points 1-3 form the entire argument made by climate scientists when they claim that climate change is both real and man made. This is the argument that must be overcome to refute the claim. CoRev hasn’t even touched it and neither has anyone else in the denier/skeptic cottage industry. ”
Ben, why would I and nearly every skeptic refute that argument. That’s the ever present strawman that you folks are forever trying to prove. Menzie and Kevin, tried. Menzie by misquoting and Kevin by just adding his personal belief, but if you actually read my comments. we skeptics believe climate change is both real and some is man made.
Not all is from man. That is why the hiatus is such a knotty problem for alarmists. It is for this misbelief in what skeptics argue that I asked you to better define your question. Your explanation confirms you did not do a good job on the original question, and the Ben-centric analysis, P 4, of the climate fundamental impacts, shows you do not fully understand the man made causes for global warming let alone their impact on climate change.
Alarmists too often argue with themselves when they claim skeptics say that climate change is not real and some not man made. I know of no one who says the climate does not change nor that some of the current global temperature increase is not man made.
Argue what we say and not what you, (Kevin and Menzie) think we say. Oh, and stop trying to be cute with the got’cha questions.
CoRev said “Ben, why would I and nearly every skeptic refute that argument. That’s the ever present strawman that you folks are forever trying to prove.”
I never asked you to refute it. I challenged you to produce it. You failed. You are not ready for this debate.
Ben, I see you are back trying to be cute.
“Ben
December 7, 2015 at 9:30 am
…
Points 1-3 form the entire argument made by climate scientists when they claim that climate change is both real and man made. This is the argument that must be overcome to refute the claim CoRev hasn’t even touched it and neither has anyone else in the denier/skeptic cottage industry. ”
I don’t, nor do most skeptics, refute that climate change is both real and SOME due to mankind. You and the other alarmists can not refute that skeptical position, climate change is both real and SOME due to mankind, without restoring the strawman argument that we refute your nicely summarized description of the fundamentals.
But, when asked to define just what you meant by climate change, and to list the components of it you wished to discuss, you got cute, again. After you finally defined what you were asking, the discussion continued. Until now, when you can not remember there was a response. Just because you didn’t get what you expected, why deny it was provided?
Ben, Baffled, Kevin, Joseph, Menzie et al alarmists, here is a new paper http://papers.ssrn.com/sol3/papers.cfm?abstract_id=2654191 that concludes:
” The IPCC carbon budget contains uncertainties that are not taken into consideration in the balance computations. Since an exact account balance cannot be computed in the presence of uncertainty, we propose a stochastic method. The data are used to test the null hypothesis that the account is in balance. Only when this hypothesis can be rejected do the data provide evidence that the account is not in balance. We use a Monte Carlo simulation model to carry out uncertain flow accounting of carbon transfers to and from the atmosphere described in Figure 6.1 of the IPCC -AR5 report and find that the known rate of carbon dioxide accumulation in the atmosphere can be explained without including emissions from fossil fuel combustion. We conclude that the IPCC carbon balance is not sensitive to anthropogenic emissions in the context of uncertainties in natural flows. Natural flows are not known with sufficient precision to determine the sources of carbon that have caused atmospheric CO2 to rise since 1750. This conclusion is consistent with the findings of a previous paper that year to year changes in atmospheric CO2 are unrelated to the rate of anthropogenic emissions”
This paper is not peer reviewed.
Social Science Research Network?
B.S. detector immediately pegs red when a hard science paper seeks publication in a social science journal.
Kevin, I said it was peer reviewed. I agree, my BS meter pegs when I see comments from you, Baffled and poor Ben.
CoRev at 6:38 am: “This paper is not peer reviewed.”
CoRev at 12:07 pm: ” I said it was peer reviewed.”
This is typical. No further comment necessary.
Note: CoRev doesn’t answer: Why is a paper with a hard-science topic seeking publication in a *social* science journal?
Yup, I misspoke. Readily admit it. Do your research.
Kevin O’Neill and CoRev: Just to clarify — SSRN is a working paper repository. Pretty much anybody who has or has had an academic affiliation can place paper in SSRN. In fact, I challenge you to find any peer reviewed publications by Jamal Munshi, listed in Google Scholar or Web of Science.
Menzie, “SSRN is a working paper repository” is why I said it was not peer reviewed and asked Kevin to do his research. If you researched Munshi’s peer reviewed history give us the data. From the recent frequency of his submissions suspect he may be a student, but don’t know.
google search says he is professor emeritus. almost all of his articles appear on ssrn and not peer reviewed. why should kevin do your research? you provided the reference, you should not rely on others to provide for its credibility or lack thereof in a scientific debate. because as we all know, if it is posted on the internet, it must be true!
Baffled, yup! All good points.
Thanks Kevin. You make my point. You don’t know if global warming, global cooling, or global climate change will be beneficial or harmful. Government policy should not be made based on ignorance.
Ricardo – if that’s what you took away from my answer, then you have a reading comprehension problem.
Menzie. I strongly recommend that you study the statistics and bias issues and especially failures of the scientific method as raised by Physics Prof. Robert Brown at Duke Univ. discussing Bias & Corruption in HADCRUT & GISS. Note especially the problems of the divergence between satellite and ground temperatures, on the “strong correlation between carbon dioxide increases and adjustments to the United States Historical Climatology Network (USHCN) temperature record”, and on the numerous biases therein. Actions do not have to be fraudulent to cause major biases due to the “Streetlight effect”/Lampost fallacy
See: Problematic Adjustments And Divergences (Now Includes June Data) at WUWT
David Hagen – you do realize that the unadjusted raw temperature data actually shows *GREATER* global warming than the adjusted data, don’t you? Please explain how adjustments that *REDUCE* the global warming trend can be used to claim global warming is some sort of conspiracy by scientists nefariously adjusting the data? Wouldn’t they adjust the data to make global warming appear larger – not smaller?
BEST’s (Berkeley Earth) Zeke Hausfather tweeted this graph out earlier this year: http://twitter.com/hausfath/status/564921572096348160/photo/1
You can always download the raw data and the adjusted data and compare it yourself – many have. Apparently deniers never took the time.
Ben – you really should read a previous post from back in August and the ensuing comment thread Remember: “Global warming is a total, and very expensive, hoax!”
You’ll see that CoRev is a conspiracy nutter, doesn’t understand statistics, hasn’t a clue what satellite temperatures actually represent, and has countless other beliefs that are contradicted by both the scientific literature and basic common sense. He also has a habit of just making sh*t up. At one point he claimed satellite ‘Brightness Temperature’ was a measure of light, then it became infrared, then infrared light. He finally admitted he was wrong, but I’m still not sure he actually understands what they’re measuring.
He also believes “The science is represented by the GCMs” When it was pointed out to him that the theory of AGW predates GCMs and that GCMs are just a tool he went on many lengthy diatribes revealing his complete lack of knowledge on GCMs, how they work, what parameterization involves, and how they’re used.
I also pointed him to a graph of the raw data versus the adjusted data (more than one, actually) and he still refused to believe it. Like David Hagen above, you have to seriously question why they don’t just download the data and do the comparison themselves. In the other thread I said they *choose* to be ignorant. That’s the only explanation I can come up with. CoRev has had several months to do the comparison himself – wanna bet that he hasn’t 🙂
In short, if there’s a denier meme in existence, CoRev has bought into it.
Kevin, 😉
Kevin,
Thanks for the link. I already could tell that CoRev was a nutter, but his comments from August are beyond what I imagined possible.
In the meantime, I see he has answered my comment above without addressing any of the points made, much less providing a coherent rebuttal. He insists instead that we should:
“Argue what we say and not what you, (Kevin and Menzie) think we say. Oh, and stop trying to be cute with the got’cha questions.”
Wow! Maybe he should take his own advice. Argue what climate science says and not what CoRev makes up. The argument I gave is how climate scientists explain how climate change occurs and why they think it is man made. Rather than addressing it, he wants us to play by his nutty rules where everything is what he says it is.
Ben, again a strawman??? Did I not agree with most of 1 through 3 of your commentary explaining those parts for which I disagreed, Then I explained what was wrong with paragraph 4.
It is interesting to see what happens with alarmists when they lose the argument. They fail to read/understand/accept alternative arguments. Then they ridicule, and because their arrogance says to them: “We are correct! There can be no other view point nor explanation for what we BELIEVE! Even if/when one is presented it must be from some one who can not see their errors.” Then starts the name calling. Take a look at the comment thread with that template. Kevin did it and you are too denying –you failed to read/understand/accept my alternative arguments.
You’ve moved from being cute to denial.
How did we get from Aarhenius early thoughts about warming: “By the influence of the increasing percentage of carbonic acid in the atmosphere, we may hope to enjoy ages with more equable and better climates, especially as regards the colder regions of the Earth, ages when the Earth will bring forth more abundant crops than at present, for the benefit of a rapidly propagating mankind,” he wrote in his 1908 “Worlds in the Making.” to the doomsday predictions of today?
This is how Kevin presents his sciency sounding comments: https://www.facebook.com/1626076704335831/videos/1653873904889444/
Ben and Menzie believe the truthiness of these perambulations through the pseudo science.
ConspiracyRev writes: ““Argue what we say and not what you, (Kevin and Menzie) think we say. Oh, and stop trying to be cute…”
So does our resident nutter heed his own advice? Well, of course not. He links to a non-sequitur video trying to be cute rather than actually reply to something I’ve actually said.
What should we take away from his video link? To ConspiracyRev that video is how a science paper sounds to him. It’s gibberish; c’mon – math is hard, science is complicated, they use terms he doesn’t understand. Much easier to just repeat memes others have already laid out for him. Advanced degrees, decades of experience, and intricate knowledge of a scientific field of study is trumped by a blogpost by some random blogger. Some might call that viewpoint insane. I would.
Kev, glad you liked it.
And Isaac Newton believed in Alchemy. Einstein didn’t believe in quantum entanglement (spooky action at a distance). Alfred Russel Wallace regularly took part in seances. Francis Crick – panspermia. Not be outdone, James Watson infamously said everyone would be a lot better off if we just admitted that Africans aren’t as smart as whites.
And of course we do have to give Arrhenius some credit; first, by including the sentence that preceded your quote: “We may find a kind of consolation in the consideration that here, as in every other case, there is good mixed with the evil.” Second, Arrhenius wasn’t aware that ice ages are basically determined by orbital forcings and that CO2 is a feedback vis a vis past ice ages. Third, it’s definitely a qualified remark: ” ….we may hope ….” A very reasonable thought given the information available to him at the time.
Since then science has progressed. We know about orbital forcings, Milankovitch cycles – and fossil fuel consumption has risen dramatically since the days of Arrhenius. Arrhenius would, if he were alive today, be one of the first to point out that Pleistocene temperatures imply Pleistocene sea levels. He was concerned about future generations. And he was not a science denier.
Menzie, i don’t think anyone ever addressed the paper you referenced, and especially your extract from it: ” Satellite sensors gradually lose radiometric sensitivity and stability during their operation, so good calibration is essential. Some satellite sensors cannot be recalibrated after launch due to the lack of accurate on-board or on-orbit calibrations. Procedures have been developed to calibrate these types of sensors but may still contain uncertainties92. Biases caused by instrument drifts are also common in satellite data. Satellites go through a slow change of crossing time at the local equator and a decay of orbital height, adding a spurious effect to detected trends”
Perhaps you do not know that except for the “orbital decay issue” all surface stations have the very same sensor issues. Furthermore the satellites will generally pass over and collect data from nearly each grid that the temperature is calculated. That is not true for the surface data collected. At this time of the month NOAA will typically only have ~50-60% of the data for the land stations and far worse coverage for the oceans. Still they will develop global temperature estimates with double decimal precision and ZERO error range.
Since this Spring UAH did a major revision of its processing and added two more minor revisions since. The end result was that they issued their November Report http://www.drroyspencer.com/2015/12/2015-will-be-the-3rd-warmest-year-in-the-satellite-record/ by Dec 3rd, 2015 @ 11:07 am › Roy W. Spencer, Ph. D. I think we are still about 10 days from a NOAA release and that will be with the level of data I defined. After just checking the NOAA site they still do not have November data ready, so the latest October coverage data looks like this: http://www.ncdc.noaa.gov/sotc/service/global/map-land-sfc-mntp/201510.gif
So to answer your question, why do we prefer the satellite data? Coverage, coverage, coverage and the quality derived from it.
Menzie, to follow up on the coverage differences for SSTs, RSS explaisn the satellite coverage/process this way: “…All channels are used to simultaneously retrieve SST, wind speed, columnar water vapor, cloud liquid water, and rain rate. SST retrieval is prevented only in regions with sun-glitter, rain, or proximity to land. Since only a small number of retrievals are unsuccessful, almost complete global coverage is achieved daily. Any errors in retrieved wind speed, water vapor, or cloud liquid water can result in errors in the retrieved SSTs.
The through-cloud capabilities of microwave radiometers provide a valuable picture of global sea surface temperature (SST). To utilize this, scientists at RSS have calculated a daily, Optimally Interpolated (OI) SST product at quarter degree (~25 kilometer) resolution. This product is ideal for research activities in which a complete, daily SST map is more desirable than one with missing data due to orbital gaps or environmental conditions precluding SST retrieval.”
Almost complete SST global coverage is far better than some, mostly random coverage from the ARGO buoys and the limited surface coverage provided by ships in the shipping lanes. For SST, the satellites are far superior to the surface data-sets.
corev, can you tell me what is interpolated in the “Optimally Interpolated (OI) SST product”? also, how does the SST calculate the surface temperature? is it calibrated to anything? does that calibration change with time?
Baffled. I can only point you to the RSS site: http://www.remss.com/measurements/sea-surface-temperature Sorry, i forgot to include the link, for their explanation. I would also recommend looking through their papers. http://www.remss.com/node/5089
corev, doesn’t it bother you to use a product which has been interpolated? by definition, that is a product which is not providing fully direct measurements, but measurements which have been modified by discrete temporal-spatial data points.
“SENSOR ERRORS FOR OI ANALYSIS
Microwave SST retrieval errors are mainly a function of wind speed and SST. These errors are added in a root-sum-squared sense to the daily standard deviation (STD) derived from buoy collocations to obtain a total retrieval error.”
i also found this interesting statement. apparently the SST data is corrected based upon buoy collocations. why would satellite data need to be corrected based upon buoy observations?
when you stated “For SST, the satellites are far superior to the surface data-sets.” did you consider that the SST data is influenced by surface data itself?
Baffled, if you think the use interpolation is bad for the satellite data to be validated and error range calculated, then you need to look at the surface data where there is no validation nor data ~1/2 the surface.
corev,
i am just wondering, if satellite SST models need collocated buoy data, why are you so hung up on the superiority of satellite data over other data sets? more is not necessarily better. the accuracy of your satellite data, with respect to surface temperature, is very much related to these sparse surface data sets.
Baffled, what part of the far increased coverage issue do you not understand? What part of the buoys used to calibrate the SST data do you not understand? What part of the UKMet use of satellite data to calibrate their own surface data set do you find troublesome? This is the craziest statement I have read i a long time: “more is not necessarily better. the accuracy of your satellite data, with respect to surface temperature, is very much related to these sparse surface data sets.”
Since you are showing your ignorance on the data sets, you might also be surprised to find that often the UK data is preferred over the other surface data sets. So I can safely say: the accuracy of your UK data set data, with respect to satellite temperature, is very much related to these denser coverage of the satellite data sets.”
You, like Ben and Kevin, are just trying to be cute while providing zero content. If you have something to say, say it, and then support it.
corev, i am simply trying to discover what you actually know about remote sensing and how the resulting data set is calculated and interpreted. it seems to me you have an incomplete picture of the history of the data as it moves from the satellite sensor to final interpretation, and this creates your misunderstanding of the accuracy and completeness of the resulting data sets.
Baffled, I appreciate your concern for my knowledge, but if I were you I would be more concerned over your own ignorance about the differences of the data sets. If you are you trying to show I am not one of the UAH/RSS team members? Don’t worry yourself I am not, but it is clear from the depth of your questions you aren’t either.
corev, i am not trying to see if you are a rss team member-it is clear you are not. but you make a lot of statements regarding the corrections to data from remote sensor platforms. if you really do not understand how remote sensor data is collected, processed and presented, that would explain some of your responses. this does appear to be the case, which is unfortunate. you appear to want to spend a lot of time on this topic, which is nice, but really do not seem to have the requisite background to fully understand the process of data collection and intepretation. my advice to you. go buy a small, cheap data acquisition system with a couple of sensors-temperature, displacement, strain. most anything will do. work each step of the data collection process. pay particular attention to the idea that almost all raw data is collected in terms of voltage, and that measurement is correlated to some physical phenomena of interest. this process will be rather instructive for you, in terms of what it means to measure experimental data, record the data, and interpret the results. remote sensing is even more challenging, but this exercise would nevertheless be educational for you.
Baffled, why are you trying to prove the data collection of satellite and surface are complex? We both know it. The processing to develop a meaningful product is also complex. You start off by saying you know I’m not an RSS team member, then try to make me into one — “but really do not seem to have the requisite background to fully understand the process of data collection and intepretation”
You seem to distrust the satellite processes and prefer the surface data over them. Again explain why this data is superior: http://www.ncdc.noaa.gov/sotc/service/global/map-land-sfc-mntp/201510.gif Instead of worrying about interpolations of data for good purposes, explain how in-filling, soem from near whole cloth, is superior.
I’ll remind you UKMet interpolates the satellite data for similar reasons that RSS does.
Oh, CoRev – why don’t you study a subject before you decide to contaminate it with your puerile analysis?
Extended Reconstructed Sea Surface Temperature(ERSST) V3b
“ERSST v3 has improved low frequency tuning that reduces the SST anomaly damping before 1930 using the optimized parameters. However, the addition of satellite SSTs introduced a small residual cold bias (in the order of 0.01°C). The Advanced Very High Resolution Radiometer is an infrared-based instrument. There must be clear-sky conditions to obtain infrared measurements, and cloud contaminated data are often difficult to identify. This contamination leads to a cold SST bias in the retrievals. There were attempts to correct these biases as mentioned in “Improvements to NOAA’s Historical Merged Land-Ocean Surface Temperature Analysis (1880–2006),” but the adjustment did not fully compensate for the cold bias. While this small difference did not strongly influence the long-term trend, it was sufficient to change the rankings of the warmest months in the time series. Therefore, use of satellite SST data was discontinued. Except for the removal of the satellite aspect, ERSST v3b processing is identical to version 3.”
Duh! The surface temperature ocean datasets we’re *already* using satellite data. But a known problem with the satellite measurements introduced a 0.01C bias. Now, CoRev thinks that’s *hugely* important – changes *everything* …. LOL
Can ConspiracyRev show us a comparison of RSS SST data with ERSST V3b and explain the significance? Oh, I doubt it. I’ll hold not hold my breath waiting for that graph. Especially since RSS only has a few years of microwave SST data – the early data was infrared only.
Kevin, this just can not be true: “Especially since RSS only has a few years of microwave SST data – the early data was infrared only.” We know it not to be true since you told us that in that old thread. “…While it’s called “Brightness Temperature”, in scientific terminology this does not equate to bright as in light. The various satellites employ microwave sounders. They are passive devices that measure the intensity of the microwave radiation emitted from the earth in various frequency bands, up to 100 GHz. ” That was from your claim the satellites don’t measure light. Next we can expect a discussion of the upper and lower ranges of the he commonly used light bands of the electromagnetic spectrum. Y’ano those bands commonly listed as ultra, visible, and infrared (light).
And this statement proves: ““ERSST v3 has improved low frequency tuning that reduces the SST anomaly damping before 1930 using the optimized parameters. …” The satellite data was useless during this period because it introduced that ole “small residual cold bias (in the order of 0.01°C)” In climate change sciency gibberish, a residual cold bias translates to: since we know that the planet can only be warming from ACO2, there can not be any small residual cold bias.
Why not? Because in Kevin-speak the “small residual cold bias” is not shown in our unvalidated expectations. How was that bias proven? In my opinion from the models, and since those models which do not in any way represent the known available climate science (remember that one Kevin) we must believe their outputs over any other possible satellite evidence. Also, we must remember, that the entire climate change hypothesis is based only/solely upon the AGW theory “It’s a very basic theory: AGW = anthropogenic global warming. Anthorpogenic = man-made. The theory says that: Human activities lead to increased Greenhouse Gases (chiefly CO2) in the atmosphere which leads to a warmer planet.” and no other hypotheses matter because there is no fusion of other hypotheses to create those climate models.
That was just a small example of the Kevin-speak, sciency sounding commentary in this thread. I didn’t even add the list of strawman issues he has raised to contradict points made. It is the absolute belief in the one and only AGW truth that gets alarmists in trouble. Their mouthings sound like science until you pull off the covers, and try to get them to discuss the weaknesses or contradictions.
corev, light refers to the specific portion of the electromagnetic radiation spectrum visible to the naked eye. it generally refers to a specific wavelength range, from about 400-700 nanometers. technically, light does not refer to ulraviolet and infrared ranges. from a scientific perspective, your definition of light is much too broad. gamma rays are also electromagnetic radiation. by your definitions, one would also call them light. this would not be a good scientific description. you are confusing the definitions of light and electromagnetic radiation. that said, it is not unusual for somebody to apply the term light to mean electromagnetic radiation in general, particularly when they are being sloppy with respect to wavelength ranges. kevin was not being sloppy, he was being quite accurate. your interpretation was quite sloppy.
Baffled, on the light issue we will have to disagree. For example: http://www.ebay.com/sch/i.html?_nkw=infrared+light
or http://www.ebay.com/sch/i.html?_from=R40&_trksid=p2050601.m570.l1313.TR3.TRC0.A0.H0.TRS1&_nkw=ultraviolet+light&_sacat=0
There may be a difference in the way the light spectrum is being taught since I went to school, but we were taught that all three were included in the light spectrum. Which was different frequencies from the radio spectrum, and both were different from the atomic spectrum.
We can agree on the definition of the total spectrum.
corev, resorting to ebay as a defense gets you no points.
there is an electromagnetic radiation spectrum-that is the entire spectrum. within that spectrum, you have various groups of frequencies. light (or visible light) is one such group of frequencies. one does not refer to microwaves as light, as that is a different spectrum of frequencies. when one is referencing frequency ranges, light does have a very specific meaning. if one is referring specifically to photons, as in quantum mechanics, one can be general in referencing light as any frequency photon. but once you categorize groups of frequencies, light has a very particular meaning.
my guess is you were actually taught the differences accurately in school, but you misunderstood the details of the differences. which is fine, since you are not a physicist. but this distinction has been taught properly in schools for decades. going forward, use the proper definitions when making an argument on a scientific topic to avoid confusion in discussions.
CoRev – you’ve (again) displayed your ignorance. You’ve conflated two different measurements. The TLT measurement is based on microwave radiation – just as I’ve always said.. The SST measurement was infrared, but now incorporates microwave as well. The UAH/RSS Lower Troposphere temperatures are based on ‘Brightness Temperature’ which you obviously knew nothing about.
The SST measurements are a completely different measurement/dataset – they only measure ocean temps. Note, the infrared measurements are what were the problem with using the satellite data in ERSST. It’s also why RSS moved to using microwave radiation for SST’s as well as atmospheric measurements. If the RSS satellite microwave SST measurements prove to be correct and free of bias I’m confident they will be incorporated into ERSST.
I asked you to provide a comparison of satellite SST data versus ERSST – I said you would not. You have (again) proved my powers of prediction 🙂
For anyone interested in looking at how the satellite data compares to radiosonde data (there’s an obvious change-point circa 2000) Tamino at Open Mind has done the comparison.
Baffled, points? Ebay was used to show the common usage. Moreover, I described what I was taught. We are undoubtedly of different ages that might explain the difference in training. Since that was my training it is unlikely that we will agree. So be it. Neither of us are writing a paper.
kevin, thanks for the link to the Tamino page. very interesting. his data plots show a steady rise since 1970 in temperatures. already argued with corev on this item. he seems to be in denial. he likes to use the scatter in the data to argue against the trends. the article is interesting in noting that the pause did not appear in the thermometer data-direct measurements. it only seems to appear in the satellite data. the pause also does not appear in the global sea level data-not on the linked page but relevant nevertheless. i have argued the hiatus is not true, and is an artifact of the measurement data methodology. in particular, such a drastic and distinct change in the temperature trends would have to be observed by actual discreet changes in the current world climate. i don’t think we have observed any such changes. real changes in trends should be accompanied by something physically observable which corroborates such changes in trend.
kevin, could you confirm the timing of the change in satellite date to include both microwave and infrared? did this occur at about the time of the apparent pause? my understanding is the two methods measure different regions of the atmosphere. is the apparent pause in the satellite data an artifact of the weighting factors used in combining the two different measurement techniques?
corev,
“Ebay was used to show the common usage. Moreover, I described what I was taught. ”
kevin made a statement using very specific terminology related to electromagnetic radiation and light. your response to him was incorrect. you were not taught incorrectly. you simply learned it incorrectly. and even if you were taught “incorrectly” in the past, that still does not make your statement “correct” today. if you propagate an error into the future unknowingly, you still are propagating an error.
baffling – prior to 1997 the SST satellite measurements were infrared only. RSS now produces two SST products; one MW only and the other MW+IR. Reasons for the change-point have been speculated upon, but I believe that’s only seen in the TLT product, thus not related to IR. Some believe it’s due to the MSU-AMSU transition. The first AMSU, NOAA-15, was launched in May 1998 and is still in service. Thus, the AMSU channel 5 (TMT) on this satellite is the backbone of all TLT measurements since 1998. It can also be seen that that there is a big difference between the temperature trends of channel 5 and the nearby channel 4 . In addition the measured channel 5 frequency is also out of specifications.
It’s interesting to note that Spencer & Christy’s V6.0 UAH data now is pretty much indistinguishable from RSS. It’s almost like they set out to get the same results as RSS. Meanwhile an explanation for the change-point/divergence may be forthcoming. Rumor has it a paper is in the pipeline. See this comment by Victor Venema and the one immediately following it by dana1981 (Dana Nuccitelli). If a paper is indeed forthcoming, UAH V6.0 won’t be long-lived 🙂
Baffled, This is another interesting misstatement/misunderstanding from you: ” the article is interesting in noting that the pause did not appear in the thermometer data-direct measurements. it only seems to appear in the satellite data.” Before the use of ERSSTv4 in the surface data trends, all surface data set showed the pause of varying lengths and slightly different end dates.
The fact that you didn’t know this is why I point to your own ignorance of the actual data.
corev, for your educational pleasure i will repost the link provided by kevin, so that you may better understand the data trends we have observed to date. it is a nice, short article for those with limited attention spans. the ratpac data in particular is illuminating.
https://tamino.wordpress.com/2015/09/24/exogenous-redux/
data which shows a pause is data which includes the satellite data. ratpac results show no pause. and when the exogenous data is accounted for, even the satellite data loses the strength of the pause. the question one should ask, is if there appears to be a divergence between satellite data and other sources, why? it does appear the pause only exists in the satellite data. other data sources use thousands of different sensors, replaced over time, and still produce consistent results. the satellite data is sourced from the same instruments over time. do you really think there is a collusion amongst the thousands of separate nonsatellite sensors to minimize the pause? or is it more likely the consistent trend, seen only in the satellite data, is an artifact of that same sensor system used repeatedly over time? my bet is that the satellite data measurement system has become biased, and as soon as we identify that bias in sensor measurement, the hiatus will also disappear. where do you think the greater possibility of consistent error occurs, the thousands of thermometers, or the few satellite sensors?
Baffled, you seem intent as does Kevin to to throw straw in wrapped BS against the wall to see if any sticks. The only thing sticking is the BS, especially the watery/loose/smelly stuff.
You seem to think I was unaware of Tammy’s latest claim. I wasn’t. This is what the NOAA radiosonde data shows: http://www.ncdc.noaa.gov/sotc/service/global/ratpac/201101-201103.gif It is exaggerated over the LS graph I showed earlier. Of note, do you see what happened to MS temps right after Kevin’s oft repeated reference? How does that fit the theory.
Moreover, this is what the actual RSS expert says: http://www.remss.com/measurements/upper-air-temperature/validation
It should heighten your concern that the RSS satellite data is interpolated, extrapolated and even validated by exogenous data sources. 😉 (Or if its not clear /sarc) Why would anyone take Tammy, and agenda driven statistician, over the the scientists who are most familiar with the ACTUAL data?
Kevin made a big point/exaggerated the importance of a minor paper that described an issue with satellite monitors interpretation of height/altitude over ice, and that RSS chose to drop the polar regions. I’m sure you ar4e unaware that the RSS team, REMSS, is a private concern, and that their decision making is driven by the needs of their customers. Can you guess how many customers they may have for the polar data? UAH, is a science/academic/research group, and they made the determination that the issue was minor and the data worth showing. The same situation exists in the surface data set. GISS shows polar data, and UKMet/Hadley does not. Care to, like Kevin, make some issue over this?
I suspect much of this is new to you, so I add naive, due to your blind following of Kevin, to my findings of your ignorance over the subject of temperature data sets. /sarc
corev, it does not concern you that a company whose business is predicated on the download and manipulation of satellite data would emphasize the importance and accuracy of such data over all other data sets? when rss promotes the superiority of their product, you do understand they have a business side incentive to do so?
as i have asked on this blog multiple times, if you believe in the trend change which began around 2000, what physical observations have you made to corroborate this trend in change? this was a distinct change in trend, something other than satellite data measurements should have been able to detect such a change. what observable have you found with respect to this change in trend? particularly in light of data such as sea level and ratpac which do not demonstrate such a trend. again i ask, why would you not question the accuracy of your data?
Baffled, Nope! to your first question, and “Before the use of ERSSTv4 in the surface data trends, all surface data set showed the pause of varying lengths and slightly different end dates.” Wrap it up in pretty bows, its still the same BS.
CoRev – the radiosonde graph you show is over the pressure range of 850 to 300mb. What does the weighting function for UAH or RSS peak at? Yeah, I thought so. Nice try.
CoRev – zero surface measurement datasets showed a *significant* pause. It’s colder where I live today than yesterday – global warming is disproved! Do we need to revisit the definition of ‘climate’? Do we need to revisit exogenous forcings? It’s been done. Do we want to consider OHC? There never was a pause in global warming. That surface temperatures fluctuate is hardly earth shattering news (sic).
I asked earlier: (no answer of course)
Were the 80s warmer than the 70s?
Were the 90s warmer than the 80s?
Were the 00s warmer than the 90s?
Are the teens warmer than the 00s?
Please explain this so-called pause to me again in light of the answers to the questions above 🙂
Or cherry-pick a date and make superficial, non-scientific, insignificant claims – you’re good at that 🙂
In a 1990 paper, Spencer and Christy claimed that since the start of routine satellite temperature observations in 1979 there had been no tropospheric warming, despite apparently rapid surface warming. The paper raised questions about both the veracity of the surface temperature record and our understanding of the climate system. Oops – then that mean old orbital decay paper was published showing their data was a mess. S & C cry in their beer. They’ve been crying ever since. RSS was started because no one trusted S & C to do the job right. I trust Dr Carl Mears at RSS. He’s a scientist. If the data’s wrong he’ll admit it, fix it, and move on. S & C always deny there’s ever a problem.
Tamino on satellites and RATPAC again today.
Ted Cruz Just Plain Wrong.
i find it quite fascinating that in light of the divergence between ratpac and rss satellite curves, nutters like corev will not even consider the possibility that there is a problem with the satellite date calibration. now in a vacuum, i could see how his nutter mind might prefer the curve that corresponds to his world view. but when you consider additional measures such as sea level
http://climate.nasa.gov/vital-signs/sea-level/
or global ocean heat content measures
https://www.nodc.noaa.gov/OC5/3M_HEAT_CONTENT/
the evidence suggests we have continued to warm. if the satellite curves do not show this warming, a couple of possibilities exist. first, perhaps there is something peculiar to the regions measured by satellite that are producing this divergence. come up with a model that explains why this region of the troposphere is not gaining energy while the rest of the earth is gaining energy. still waiting on that explanation. or second, perhaps there is an issue with the correlation of satellite data to actual temperature. at this point, unless you are a nutter biased towards the anti-science viewpoint, one should look a bit more carefully at that satellite data to be absolutely sure it is accurate. that is the data set that is in the minority at this point. unless you believe in the conspiracy that all the other sensor systems are corrupted.
ConspiracyRev writes: “Still they will develop global temperature estimates with double decimal precision and ZERO error range.”
I did say he has a habit of making sh*t up. The uncertainty analysis for every major surface temperature dataset is widely and publicly available.
Here, for instance is NASA GISS and
NCDC NOAA
BEST and HADCRUT also provide uncertainties.
Like most of CoRev’s claims it’s just another made-up, science-denying, non-fact. Which denial site gave you that stupid little not-factoid, ConspiracyRev?
It also displays CoRev’s complete lack of knowledge about metrology. I make *8* decimal point precision measurements using instruments that can only read out to *5* decimal places. 1000 times more precision than an individual instrument could provide. These measurements are verified annually to NIST and simply rely on the power of statistics and sampling size. Math works. Statistics work. Obviously ConspiracyRev doesn’t know much about either.
Kevin, I guess we’ll just have to wait for the next NOAA announcement to see where they include the error range with their global average temperature estimate. Since you said it is there it should be obvious for the average reader to find and use.
Copied directly from the NOAA October Report:
http://www.ncdc.noaa.gov/sotc/global/201510
Anomaly
Global °C °F
Land +1.33 ± 0.15 +2.39 ± 0.27
Ocean +0.85 ± 0.03 +1.53 ± 0.05
Land and Ocean +0.98 ± 0.07 +1.76 ± 0.13
So why do we have to wait? Oh, because once again you can’t admit you’re wrong and just making sh*t up. Do you ever reflect on how you can be wrong about such simple *facts*? What is the excuse for not being able to find the uncertainty in a simple table of values? Why and where would you subscribe to such a belief?
Kevin, and this is how they report/brief the SOTC: http://www.ncdc.noaa.gov/sotc/briefings/201511.pdf. A sample of a slide:
_____________________________________________________________________________
•October +1.76° F warmer than 20th century average
–
Warmest October on record
–
Largest warm departure from average for any month on record
• Land: +2.39° F
–
Warmest October ”
• Ocean: +1.53° F
–
Warmest October
–
Largest warm departure from average for any month”
_____________________________________________________________________________________________________________________
Or we can look at the summary released: http://www.ncdc.noaa.gov/sotc/summary-info
On the global section do a search on error or uncertainty/ies. Tell us what you find.
We all know that there are uncertainties associated with the data sets, but when announcements for general consumption are made, those uncertainties are conveniently forgotten.
It is just another example of the exaggeration of exactitude we so often see in these pronouncements and PR products. Its folks like you who shout LOOK THE UNCERTAINTY IS THERE, while ignoring all the areas where it was ignored for the general public’s consumption. Thanks for taking the bait. Skeptics can get cute too. 😉
CoRev wrote: “Still they will develop global temperature estimates with double decimal precision and ZERO error range.”
When shown to be wrong he can’t admit it.
Kevin, wrong? I’m going to do what you do and just ignore the question and move on.
CoRev, you don’t get to totally ignore what the vast majority of climate scientists say and make up your own debate. You also don’t get to take the moral high ground and say, “You and the other alarmists can not refute that skeptical position, climate changeis both real and SOME due to mankind…”. Climate scientists have maintained a consensus for some time now that ALL the variation from trend in the last 30+ years is due to human activities. They maintain that no natural changes could account for the variance. The sun has not increased it’s radiation in any meaningful amount. The Earth’s orbit has not changed. On top of that, all of the increased heat is happening on the dark side of the planet. We aren’t getting warmer because of additional heat entering the system. It can only come from changes to the composition of the atmosphere. There have been no meaningful natural additions to greenhouse gases, but human activities have released a lot.
Your arguments are pretty silly. You can’t be taken seriously if you want the entire scientific establishment to frame the evidence and analysis in a way that makes you happy instead of the way that makes sense to them. It is also pretty silly to insist that the scientific community is making mistakes and/or deliberately fabricating false data just because you can’t figure out what they did. It is most silly of all to claim that scientists cannot “…refute that skeptical position, climate changeis both real and SOME due to mankind…” when they already have.
Welcome back Ben! This is just crazy talk: 1) “that ALL the variation from trend in the last 30+ years is due to human activities.”
(Not supported by science and many scientists –Just one example re: Arctic ice an old claim https://www2.ucar.edu/atmosnews/news/18283/ncar-develops-method-predict-sea-ice-changes-years-advance In it they say: “Decadal prediction relies on the idea that some natural variations in the climate system, such as changes in the strength of ocean currents, unfold predictably over several years. At times, their impacts can overwhelm the general warming trend caused by greenhouse gases released into the atmosphere by humans” Natural variations= Nature not mankind.
2) “They maintain that no natural changes could account for the variance.”
Also not supported by science see the above quote/reference also are you so totally aware that we are in an el Nino year, which raises Sea Surface Temperatures (SSTs)? The the seas make up ~70% of the planet’s surface and a rise in their temps does effect overall average temps. Do you know that there is little/no proof that el Ninos are influenced by man kind? While we are talking about the sea surface influence are you aware of the ~60-65 oscillations (1/2 warm and 1/2 cool) in temps in both the Pacific and Atlantic oceans. We are entering the cooling phase of the Atlantic and have entered the cooling phase of the Pacific. And I doubt you know their signals are clear in the temperature records.
3) “The sun has not increased it’s radiation in any meaningful amount”. Not an issue
4) “The Earth’s orbit has not changed.”
This is nutter territory. The Earth’s orbit and its orientation to the Sun is always changing. Have you not hear of Milankovitch cycles? If not you shold do a little research to see what science says is a possible impact.
5) “On top of that, all of the increased heat is happening on the dark side of the planet.”
WOW! This is completely nutter. No further explanation necessary.
6) “We aren’t getting warmer because of additional heat entering the system.”
Are you just trying to be cute again? Depending on the answer we might discuss further what you mean. We may even agree, but due to your previous statements I can not be sure.
You obviously believe what you are writing, but as in the previous comment string it is too muddled, and much just plain wrong.
Wow CoRev! In spite of Kevin’s warning I was not prepared for you to demonstrate such ignorance of basic statistics. Suppose I generate a sample of 1000 independent realizations of a random variable with distribution N (0,1). The data points will show some variation, but there will also be a trend. Suppose I generate a new sample of 1000 independent realizations of a random variable with distribution N (10,1). This new sample will show variation as well, but the trend will be different. This difference is known as the variation in trend.
When I say “…ALL the variation from trend in the last 30+ years is due to human activities.” I am not saying there is no variation to natural climate. I am saying that it is fairly basic and obvious to scientists that you need to filter out the natural variation so you can see how the trend is changing. They do this and the result is agreement that for last 30 years all the variation from trend is coming from human factors.
Your failure to understand the basics leads you to mistake the increase in sea surface temperatures for a natural phenomenon. It is not. Scientists agree that about 98% of the excess heat from global warming is absorbed by the oceans and the polar ice caps. As the oceans get hotter the periodic result is for SST to experience greater variation. When the SST are lower, the measurements on land will reflect this so it will look like a hiatus in global warming has occurred, when this is not the case.
As for your points 4, 5, and 6, if I’m a nutter for making these claims, I am in good company. The Birch Aquarium at UC San Diego says the same thing in their FAQ . Seriously, you should read some basic science. Of course, you won’t. Anything that goes over your head will just prompt your, “Are you trying to be cute again?” line.
Ben, now you believe we know what is and specific values for each and every natural factor to climate. Be claimed: ” am saying that it is fairly basic and obvious to scientists that you need to filter out the natural variation so you can see how the trend is changing.” Here’s a hint. List just the known cycles within an interglacial to see if even those are filtered to determine a trend.
Your 2nd comment is just as nutty as the 1st. You claim: “Your failure to understand the basics leads you to mistake the increase in sea surface temperatures for a natural phenomenon. It is not. Scientists agree that about 98% of the excess heat from global warming is absorbed by the oceans and the polar ice caps.” The key to this misunderstanding is the term excess heat. Excess in comparison to what? We almost agree. ~98% of the heat from the Sun is stored in the oceans. Any heat returned due to GHGs would also be stored in the oceans. Since CO2 makes up ~ 4% of the GHGs and only a ~3% of total CO2 is from anthropogenic causes, even the already small amount of heat returned due to GHGs is barely calculable. To think the anthropogenic portion is measurable is crazy talk. So, again you are trying to make a case for AGW/ACO2 impacts on SSTs as significant. They are not.
Clouds are a far larger impact on SSTs, but even their impact is incalculable since we have no good measurement for amount, depth, makeup, duration etc for clouds. We humans know they are impactful every time we walk under one. The rest of your SST comment is barely English.
Your points 4, 5 and 6 are not addressed in the aquarium reference.
4) “The Earth’s orbit has not changed.”
This is nutter territory. The Earth’s orbit and its orientation to the Sun is always changing. Have you not hear of Milankovitch cycles? If not you shold do a little research to see what science says is a possible impact.
5) “On top of that, all of the increased heat is happening on the dark side of the planet.”
WOW! This is completely nutter. No further explanation necessary.
6) “We aren’t getting warmer because of additional heat entering the system.” Did you try to explain this?
CoRev, did you even read the aquarium link? Right at the beginning it says, “… The pattern of the current warming is also highly unnatural. For example, it is warming more at night than during the day; this is expected for CO2-caused heat trapping, because CO2 works at night, whereas natural warming would be more in the day.” This takes care of 5. Yes I did say ALL when I should have said MORE, but it is pretty clear from the record that the slowing in heat leaving the planet must take place primarily at night.
About orbit change, do recall we are talking about a period of 30 years – far too short for Milankovitch cycles – and again you didn’t read the aquarium page if you couldn’t find where it said, “…Known natural causes of warming, such as the sun, have been constant in the past 30 years…”. If the orbit had changed this statement could not be true. That covers 4 indirectly and it covers 6 explicitly. Please try to keep up.
I don’t know where you get the claim “Since CO2 makes up ~ 4% of the GHGs and only a ~3% of total CO2 is from anthropogenic causes”. GHGs have increased enormously. CO2 alone has increased 30% in the last 150 years – all of that from anthropogenic causes. GHGs slow down the heat that is able to leave the earth. While human activity has increased the amount of energy reflected into space, this has only offset about 1/3 of the warming due to trapping of heat by GHGs. When more heat is entering the system as is leaving we end up with excess heat entering compared to leaving. The excess heat is measurable and indeed has been measured. We can see it in the actual temperatures, in the rising sea levels, and in the melting glaciers and polar ice caps.
As to your statement, “Here’s a hint. List just the known cycles within an interglacial to see if even those are filtered to determine a trend.” Are you seriously claiming that scientists have not pieced together the entire natural climate record going back hundreds of thousands of years? Between ice cores, tree rings, pollen, ocean sediments, and glacier lengths we have an extremely accurate picture of natural variations in climate and what causes them. This knowledge allows us to see the variation in trend.
Ben, some of the problem is you phrasing, but the fundamentals are wrong.
You started by saying this: “On top of that, all of the increased heat is happening on the dark side of the planet.” You now have modified it to: “For example, it is warming more at night than during the day.” Both a phrasing and understanding problem.
You now have shifted the orbit comment to: “About orbit change, do recall we are talking about a period of 30 years…” No. It was another absolute statement. Regardless, the orbit has changed even though only 30 years. Have we moved closer to the orbital tipping point? We actually don’t know what triggers the glaciations, but even using your limited 30 years we are closer.
The CO2 and GHG % numbers are fundamentals that are known. That’s why we have estimates like 0.047C total temperature change from the current COP21 proposals if implemented. I don’t intend to do your research for you. Especially after you claimed I didn’t know the fundamentals. BTW, what you have done is common for alarmists, because you have been fed and believe the rhetoric without doing the simplest math.
This is also wrong: “The excess heat is measurable and indeed has been measured.” Show us, but this was your original statement: “… increase in sea surface temperatures for a natural phenomenon. It is not.” Show us how much of the warming is from mankind. The best we get from climate scientists is estimated from models.
I asked YOU to list the know cycles and show how they are accounted for. You said this: “” am saying that it is fairly basic and obvious to scientists that you need to filter out the natural variation so you can see how the trend is changing.” List them and show us where they are accounted for in the models, because that’s the only place they can accounted.
Ben – Don’t forget that we also measure incoming and outgoing radiation from *satellites* – apparently those satellites must be really unreliable for CoRev to dismiss those Top-of-the-atmosphere measurements. Who would have guessed that CoRev distrusts and disregards satellite measurements?
ben, you have to understand when discussing with corev, he looks for typos and then uses them to try and disqualify any statements made. he is not really interested in understanding and learning-he knows it all. he feels his “gotcha” moments override the general accuracy of ones argument. there was a misguided tirade against kevin because corev did not understand the implication of using “microwaves” versus “light”. this type of behavior is why we call them nutters.
Kevin, another strawman argument. What does the satellite TOA measurements have to do with Ben’s or my comments?
Baffled claims: ” he feels his “gotcha” moments override the general accuracy of ones argument.” The only ones playing got’cha games was Ben and you. You both got caught out with plain data and logic. Does it not bother you that interpolations is … answered with a reference to the actual experts explanations. and then Ben’s — Deniers never state the … the questions was as general as the …’s. When asked to better define what he wanted to discus he answered his original question, but his analysis in paragraph 4 of the 1-3 previous pretty complete fundamental paragraphs were way off.
Kevin, OTH, is just bullying and uses strawman argumentation to try to cover up his mistakes by constant dance.
Ben, I missed this nutter comment in my previous response: “it is warming more at night than during the day; this is expected for CO2-caused heat trapping, because CO2 works at night, whereas natural warming would be more in the day.” Ben, can you describe the physics that turns on/off CO2 capturing an IR photon with day/night? More importantly, you do realize even in your 30 year window, that we are talking about the entire globe? It will be daylight somewhere on the globe at any given time. How does CO2 stop/start again?
This comment I can not ascribe to poor phrasing. Its grossly erroneous examples like this that show how ignorant you are of actual climate science.
I could rephrase your comment so that it would be more accurate in accordance with the science, but you started off being cute. You wrote a pretty good explanation of the science in paras 1-3 , but now I think you just copied it. I think Para 4 was your own, and is as grossly in error as the above statement.
CoRev says, “Ben, can you describe the physics that turns on/off CO2 capturing an IR photon with day/night? More importantly, you do realize even in your 30 year window, that we are talking about the entire globe? It will be daylight somewhere on the globe at any given time. How does CO2 stop/start again?”
Now that I have picked myself up from rollng on the floor laughing, I will answer your question. CO2 does not turn itself on and off. At night, the trapping of heat via GHGs is the only warming mechanism at work. In the day, this is not the case. In addition to trapping the IR radiation, we have reflection. We have enough increase in reflection due to aerosols that this reflection offsets a third of the heat increase from GHGs planet wide. CoRev, it took a special kind of stupid to ask that question.
The rest of your drivel is just climate denier nonsense. You are not a skeptic, CoRev. You deny that climate scientists actually know the things they know. You deny decades of research. Then you flat out lie about what Kevin, Baffling, and I say. When I say:
“Climate scientists have maintained a consensus for some time now that ALL the variation from trend in the last 30+ years is due to human activities. They maintain that no natural changes could account for the variance. The sun has not increased it’s radiation in any meaningful amount. The Earth’s orbit has not changed. On top of that…”.
A reasonable person would understand the 30+ years to apply to the entire paragraph. You understand it this way, too, but you are deliberately lying so you can pretend that you still have points to make. You don’t.
Now you think my 1-3 is pretty good science but I must have copied it from somewhere. Didn’t you even consider what I said? I told you this was the argument that climate scientists make. I wrote it, but it was a summary of the core arguments used to justify claim that climate change is real and man made. The fact that you have to speculate about where I got the arguments is proof positive that you have never heard it before. As I said before, you aren’t ready for this debate.
CoRev says, “The CO2 and GHG % numbers are fundamentals that are known. That’s why we have estimates like 0.047C total temperature change from the current COP21 proposals if implemented. I don’t intend to do your research for you…” Yep, you made this up or got it from a conspiracy nut website.
CoRev says, “Kevin, another strawman argument. What does the satellite TOA measurements have to do with Ben’s or my comments?” Kevin’s point goes right over your head.
Let’s face it, CoRev. You aren’t interested in explanations or evidence. You are a conspiracy nutter who will never be convinced no matter how wrong your ideas prove. Pretty pathetic, really.
This is for all the “pause/hiatus” deniers. The before ERSSTv4 picture: http://wattsupwiththat.files.wordpress.com/2013/01/wb4.png?w=720
This is what ERSSTv4 and the current el Nino did to the data and for the deniers:
http://www.woodfortrees.org/plot/hadcrut3gl/from:1997.33/trend/plot/gistemp/from:2001.33/trend/plot/rss/from:1997.0/trend/plot/wti/from:2000.9/trend/plot/hadsst2gl/from:1997.1/trend/plot/hadcrut4gl/from:2000.9/trend/plot/uah/from:2004.75/trend/plot/hadcrut3gl/from:1997.33/plot/gistemp/from:2001.33/plot/rss/from:1997/plot/wti/from:2000.9/plot/hadsst2gl/from:1997.1/plot/hadcrut4gl/from:2000.9/plot/uah/from:2004.75
Discuss at your leisure. Be aware that a la Nina usually follows an el Nino.
CoRev – why not just do a direct comparison of global temps with ERSST Version 3b vs global temps with ERSST Version 4? Nick Stokes at Moyhu has already done it – months ago.
Here’s the graph: http://www.moyhu.org.s3.amazonaws.com/TempLS/compar2.png
His post on it is here: http://moyhu.blogspot.com/2015/06/templs-and-new-ersst-v4-noaa-is-now.html
My god, I think I see 0.02 degree differences in places. Meanwhile UAH’s latest revision changed some data by almost 0.2 degrees – ten times the adjustments we see in ERSST. Now which one should be questioned?
Oh, notice ERSST *also* warmed the oldest data – meaning they actually *reduced* the trend (again) those sneaky scientists – always reducing the trend to make global warming appear smaller than it actually has been. I say we just go with the raw data.
Kevin I did just that in comment to which you responded. http://wattsupwiththat.files.wordpress.com/2013/01/wb4.png?w=720
and
http://www.woodfortrees.org/plot/hadcrut3gl/from:1997.33/trend/plot/gistemp/from:2001.33/trend/plot/rss/from:1997.0/trend/plot/wti/from:2000.9/trend/plot/hadsst2gl/from:1997.1/trend/plot/hadcrut4gl/from:2000.9/trend/plot/uah/from:2004.75/trend/plot/hadcrut3gl/from:1997.33/plot/gistemp/from:2001.33/plot/rss/from:1997/plot/wti/from:2000.9/plot/hadsst2gl/from:1997.1/plot/hadcrut4gl/from:2000.9/plot/uah/from:2004.75
They are exactly the same looks at the data before and after ERSSTv4.
The only changes are the extension to latest data and the inclusion of ERSSTv4 data. Normal processing usually maintains the old an new data-sets. UAH is internally using 6.0v4 and also reporting the 5.6 version. Indeed that is what is shown in the WFT graphs provided above.
You are correct ERSSTv4 raised GISS ~0.029C, baseline and all data.
What I found interesting was this comment in Stokes:
“Nick StokesJune 21, 2015 at 10:20 PM
Olof,
“Nick, have You ever produced a fully global land station only TempLS mesh”
All it needs is to leave out the SST stations. I have experimented over the years with reduced stations numbers, as here and here. There actually isn’t, IMO, much justification for retaining the full land set with the oceans so poorly represented. ”
Oh wait. Who has been trying to make that point?
Baffled doesn’t get it. Ben thinks all those ocean influences are factored out, and who knows what you think.
Baffled, it does not concern you that what you call the majority opinion on global average temps is predicated on the manipulation of measurement data that is this sparse: http://www.ncdc.noaa.gov/sotc/service/global/map-land-sfc-mntp/201510.gif? It does not concern you that data trends change so drastically after a single questionable NOAA adjustment? It does not concenr you that RATPAC data is interpolate?
“pInterpolation
In another effort to reduce random errors, the LKS authors used linear interpolation between months of data to fill data gaps of less than four months before removing data at the times of metadata events. The use of interpolation is only at stations where data removal occurred due to metadata events. The mean number of months of data added by interpolation to these 38 stations was about six per station”
It does not concern you that the RATPAC dat, already far more sparse than the majority surface data, uses spatial averaging across large zones: ” Each 30-degree zonal band was divided into three longitudinal regions of 120 degrees each” ? It does not concern you that Tammy’s analysis converted this grossly averaged data to compare with the RSS data based upon much, much smaller gridded data? It does not concern you about the quality of the conversion done by Tammy, not know to be an expert on either RATPAC nor RSS data. It does not concern you that Tammy converted to monthly the averaged 3 month RATPAC data?
corev, if i am looking at trends, then as long as i am consistent in how i represent the data i am able to observe a trend, or lack thereof. once again, the hiatus appears to be linked to a single source, the satellite data. since it conflicts with data observed from multiple other sources, the pertinent thing to do would be to examine that data in detail to be sure there is not a bias in the readings. that is what a competent analyst would do.
No matter how many times you say it, you are denying the data up to release and implementation of the NOAA ERSSTv4 this Spring: http://wattsupwiththat.files.wordpress.com/2013/01/wb4.png?w=720
CoRev – any link to WUWT gets ignored. I try to read science – not fantasy.
In case any explanation is needed regarding WUWT – here’s one for starters:
http://reallysciency.blogspot.com/2012/01/zombie-lies.html
A comprehensive list would double the size of the web and take several lifetimes to compile. Though Sou at Hot Whopper does a yeoman’s job trying to at least hit the lowlights.
.Kevin, WUWT is just the place holder for the graph in the”Wayback” machine. Since you’ve been so wrong in this comment thread, it is no surprise you would ignore the actual data.
Baffled wants more data analysis, but doesn’t understand when it is presented.
corev, still no consideration of rising sea levels and increasing ocean heat content? sea level measurables are not considered in the world of corev? you are simply a broken record with no interest in the truth.
Baffled, nope! We’ve covered it in the past. We both know there is a difference in response time for water and atmosphere. You still seem to have returned to that ole strawman argument that skeptics don’t believe that the planet has warmed.
corev, actually we have not covered this in the past. i have asked the question repeatedly, but you simply dodge the question. it is very simple. the sea level is continuing to rise. this means it continues to absorb heat. response time is a false argument. now if you want to argue the sea is simply absorbing the heat from the atmosphere, at first glance this is plausible. but for the thermodynamics to work properly, the atmosphere must then be losing heat. not rising in temperature. and not holding steady in temperature. for your argument to be valid, atmospheric energy must actually be dropping. we see that nowhere in the data. the heat may take time to work itself through to equilibrium in the ocean-your response time argument- but that process will not really have any effect, at least to first order, on the energy-temperature expansion of the ocean itself. this is an interesting conundrum for deniers to address-hence they won’t address it with science.
“You still seem to have returned to that ole strawman argument that skeptics don’t believe that the planet has warmed.”
skeptics have been forced over time to believe the planet has warmed-that in itself has been a miraculous change in denier position. however, deniers still do not believe the changes must follow the laws of physics. we are still working on your education in this area.
Baffled, you memory is failing you re: past discussions as is your knowledge of the temperature data sets.
corev, then humor my failed memory. give me an explanation. please describe your mechanics behind the rising sea levels in which we have no decrease in temperature elsewhere in the system, and supports “your” decade long lack of global warming.
It’s interesting that the same deniers that tout the satellite TLT data ignore:
1) the way satellite temperatures are derived
2) the satellite SST data
Regarding #1, satellite atmospheric temperatures use computer models (yep – those dastardly GCMs) to *correct* for diurnal error. Surface temperature datasets don’t rely on GCMs at all. It’s just another glaring inconsistency.
Regarding #2, the satellite SST product validates that the allegedly poor spatial observations for ocean surface temperatures are actually very good. There are only minute differences between the two.
In short, we know the surface temperature data is correct. We don’t know why the satellite TLT product is no longer (circa 2000) strongly coupled to SSTs. Given the history of the satellite data, its short duration with major errors and inconsistencies, virtually all climate scientists basically disregard the TLT data as erroneous. Most believe that – as happened multiple times in the past – some physical scientist will eventually take the time to point out where the next correction to the satellite data needs to be made. It’s time away from their major research area, but someone will take an interest in it. Po Chedley at Univ. of Washington would be my bet.
I see Ben has started digging his hole deeper. “At night, the trapping of heat via GHGs is the only warming mechanism at work.” Warming is the sensible change in temperature over a period. (My definition) So any physical change in an environment causing the day time heat to be stored causing its release (cooling) to be extended into the night can create sensible heat. For global warming the period of these measurements are years and/or decades. Ben, here are just two minor examples of many other sources of night time warming, 1) clouds, 2 and urban heat island (UHI). Clouds can trap the heat during the day and release downward at night, but at night they also block and reflect (slow) the IR photons as they escape to space. We daily feel the effect of UHI. Water, seas, lakes oceans etc. also mitigate the effects of heat gain and loss by actually storing and releasing it over much longer time frames than a GHG molecule.
Which brings me to another simple question. Since you used the term capturing/traps and slows IR photons to space. Can you tell us, on average how long this atmospheric GHG process takes to occur from capture to release? Yes, it does release the photon or else we would be in a runaway situation. We already know that the UHI and water-based (my above description applies) can take hours to centuries respectively.
The rest of your rant is a series of pronouncement which appear to be causes by someone questioning your knowledge. Your paras 1-3 were actually a good summary of the fundamental science. I told you so. Your para 4 was just more of your inept analysis, which I think is due to your lack of knowledge of the fundamental numbers.
I will ask gain. what is the % of GHGs of the atmosphere? Of the atmospheric GHG what % is H2O, % of CO2, % others. Of these non-H2O GHGs what is the % of anthropogenic origin? Knowing these numbers is important to calculate the temperature impacts of things like the current COP21 promises.
Why all the anger?
Ben, a test of the depth of knowledge of a science subject is the quality of the references used. IIRC you have not yet referenced an actual science paper. I often use the actual data, and don’t as often reference a paper The reason for that is there just aren’t as many papers supporting the skeptical arguments.
CoRev writes : “Ben, a test of the depth of knowledge of a science subject is the quality of the references used….”
Like non-scientist, non-peer reviewed works in progress on the Social Science Research network by someone who has never published anything?
Now who in this discussion would have offered that up?
LOL, ya really can’t make this sh*t up.
corev “Water, seas, lakes oceans etc. also mitigate the effects of heat gain and loss by actually storing and releasing it over much longer time frames than a GHG molecule.”
you emphasized “storing” in your original response. from your commentary it does not appear you fully understand the thermodynamics with respect to “storing”. when the ocean is “storing” the heat content, it is increasing its energy. the increase in energy manifests itself as volume expansion of the water. what physical effect do you observe from this “storing” of energy? rising sea levels-volume expansion. now i have asked you repeatedly about this issue, and you have ignored it. your comment on “storing” indicates you really do not understand this mechanism at all.
“Ben, here are just two minor examples of many other sources of night time warming, 1) clouds, 2 and urban heat island (UHI).”
lets focus on the major examples then.
Baffled, I said not again.
corev, not again? i will give you credit, you have tried to respond in the past, but in a scientifically inconsistent manner.
but to be clear, you do not respond to the question because you have no scientifically valid response. that is what happens when nutters are faced with the reality of physics. you can argue with a blog, but you cannot argue with the laws of thermodynamics.
Baffled, why did you lie about not previously discussing? “i will give you credit, you have tried to respond in the past,…” There haws been a lot of lying, name calling and strawman argumentation in this comment thread. I’m not sure that’s what Menzie wanted, but it is common in these climate discussion threads.
From a skeptics view point this level of discussion is because the science is so bad it must be debated with emotion and not fact/logic.
corev, i was simply tossing you a bone. you have never been able to defend the issue of global sea rise and the “hiatus”. to be blunt, you have never been able to present a rational, scientific argument to explain the conflict. i simply gave you credit for the silly responses you have given in the past-you appear to be too stupid to even understand that concession. so again, present a scientifically valid explanation for this conflict in the observable data. as already noted, your time lag argument holds no water. there is no straw man argument here, as you like to use the excuse. it is a simple conflict of observable data. give me an explanation that is scientifically valid.
Baffled, Now a lie becomes throwing ME a bone? As Kevin has said: “LOL, ya really can’t make this sh*t up.”
I said not again because we have done it already. Nothing has changed in the record/science and both our minds are made up that the other is wrong or exaggerating the importance.
Just as you did not want to discus the effect of ERSSTv4 on the surface data-sets.
corev, there is no lie. you are simply trying to make a distraction from the main issue. you have never, ever, come up with a sound scientific reason for the difference in the observed data. what you do is simply ignore the issue, rather than confront the possibility that the sst data, on which all of your arguments depend, may have some bias crucial to your position. you cannot address this issue because you do not understand physics. your commentary on heat storage illustrated this clearly. as i said previously, you can argue with a blog-which you do here daily-but you cannot argue with thermodynamics. the fact that you are unwilling to examine this discrepancy indicates either your are not educated enough and/or you are in denial.
i have been quite clear. the satellite data as presented over the past 15 years demonstrates a trend inconsistent with the past, and it also demonstrates a trend inconsistent with other recorded data. that should raise some questions, and fuel further investigation into the data interpretation. you are unwilling to even acknowledge the issue exists. that is the behavior of a denier-not a scientist.
Baffled claims “corev, there is no lie. you are simply trying to make a distraction from the main issue.” The issue raised by:
“baffling
December 11, 2015 at 6:23 pm
corev, still no consideration of rising sea levels and increasing ocean heat content? …
CoRev
December 12, 2015 at 6:59 am
Baffled, nope! We’ve covered it in the past. …
baffling
December 12, 2015 at 8:10 am
THE LIE corev, actually we have not covered this in the past. …
He finally admits after being cornered: “corev, i was simply tossing you a bone.” I do not intend to rehas that old subject as nothing has changed.
As for the subject of Menzies’s article, the satellite data, Baffled say this: “i have been quite clear. the satellite data as presented over the past 15 years demonstrates a trend inconsistent with the past, ”
15 years? From where does this come? An inconsistent trend implies something has changed. Well the 15 year trends are not even different. Matching the same temperature conditions in the period prior to the 97-98 grand el Nino to that after it (Baffled 15 year window) we find this: http://www.woodfortrees.org/plot/rss/plot/rss/from:2000.9/trend/plot/rss/from:1979.4/to:1994.4/trend
Baffled also claims: “…and it also demonstrates a trend inconsistent with other recorded data. ” This I can not replicate because the surface dataset replaced their original pre-ERSSTv4 data, so it is no longer available for comparison. But there are copies of the various trends captured prior to ERSSTv4 implementation in them: http://wattsupwiththat.files.wordpress.com/2013/01/wb4.png?w=720 Regrettably the Mark 1 eyeball is all I can use to show Baffled 15 years window using that last graph. I don’t see any inconsistencies in the trends
Baffled concludes: “that should raise some questions, and fuel further investigation into the data interpretation. you are unwilling to even acknowledge the issue exists.” Indeed, it should raise some questions over ERSSTv4 and the practices of the surface data-set managers to replace without maintaining availability to the old data. I think he is concerned over the wrong data-sets. The trend inconsistencies are occurring in the surface and not the satellite data., and the reason is very clear.
Is there any wonder there is a Congressional investigation into NOAA over ERSSTv4?
corev, show me where you have been able to defend the issue of global sea rise and the “hiatus”. you have not done so. quit creating excuses. if you have an answer, present that answer. its amazing how a denier goes silent when asked to present the science. deniers are either too ignorant of science, or know their position is not supported by the laws of physics. but deniers never address the physics of the problem.
CoRev asks: “Can you tell us, on average how long this atmospheric GHG process takes to occur from capture to release?”
and a bunch of other questions in another gish gallop of inanity
Zeke Hausfather answers: “Determining the residence time of carbon dioxide in the atmosphere is a rather complex problem. A common misconception arises from simply looking at the annual carbon flux and the atmospheric stock; after all, with 230 gigatons absorbed by the oceans and land every year, and a total atmospheric stock of 720 gigatons, one might expect the average molecule of CO2 to remain in the atmosphere for only three to four years.
Such an approach poorly frames the issue, however. It is not the residence time of an individual molecule that is relevant. What really matters is just how long it will take for the stock of anthropogenic carbon emissions that has accumulated in the atmosphere to be reabsorbed.
The simplest way to approximate the time it will take to reabsorb the anthropogenic flux is to calculate how long it would take for the atmosphere to revert to preindustrial levels of 280 parts per million if humans could cease emissions immediately. If the current net sink of around 4 gigatons of carbon per year remained constant over time, it would take about 50 years for the atmosphere to return to 280 ppm. However, there is no reason to think that these sinks would remain constant as emissions decrease. Indeed, it is more realistic to anticipate that the net sink would shrink in proportion to the decrease in emissions.”
and
“Using a combination of various methods, researchers have estimated that about 50 percent of the net anthropogenic pulse would be absorbed in the first 50 years, and about 70 percent in the first 100 years. Absorption by sinks slows dramatically after that, with an additional 10 percent or so being removed after 300 years and the remaining 20 percent lasting tens if not hundreds of thousands of years before being removed.
As University of Washington scientist David Archer explains, this “long tail” of absorption means that the mean lifetime of the pulse attributable to anthropogenic emissions is around 30,000 to 35,000 years.”
Nick Stokes has a nice series of posts on airborne fraction of CO2 and carbon emissions.
The CO2 Added to the Air Is Ours
CO2 accumulation accounted for by emission and land use
Why is cumulative CO2 Airborne Fraction nearly constant?.
Total Precipitable Water is tightly coupled to SSTs. A warmer atmosphere holds more water. Numerous TPW figures are available from satellite data. Via feedback, increases in TPW accounts for about 20% of total radiative forcing due to CO2. Line by line code for radiative transfer calculations are available, but far above your paygrade**
**where ‘paygrade’ is a euphemism for understanding and intelligence
Kevin, another strawman argument. I talked about the physics at the molecular/photon level and you respond with residence time which has ranges from from 1+ decades to centuries.
I forgot to complete my thought: “you respond with residence time which in the scientific literature has ranges from from 1+ decades to centuries.
Kevin, thank you. It was not an disingenuous question. Of course I knew the answer, but that was the point. After days someone finally did the research to find out what “trapped” actually meant in the ?science?. Because “trapped” has so often been used to exaggerate the GHG impacts. Photon loss to space can be defined as a short few seconds (due to many, many collisions with GHGs) to a sub-second delay (micro second if few GHG collisions occur ), which explains why the science may have over estimated its importance since Arrhenius and until today’s models.
My point was to show the ignorance of basic physics and fundamentals % numbers in the alarmist/believer communities.
BTW, this was the entire question: “Since you used the term capturing/traps and slows IR photons to space. Can you tell us, on average how long this atmospheric GHG process takes to occur from capture to release? Yes, it does release the photon or else we would be in a runaway situation. …”
Kevin, maybe you would like to answer the question. I posed it because it is critical to the understanding of the processes, and the misconceptions fostered by the use of ” term capturing/trap” versus “slows”. That is similar to knowledge about the percentages of atmospheric content to estimate and understand the impacts of climate policy solutions.
Its because these basic and fundamental data are so de-emphasized, that I use *exaggerated* so often.
corev, go ahead and enlighten us on the physics of the process. i am curious about your understanding of the physics at the molecular/photon level. why is kevin wrong?
CoRev – The isolated radiative lifetime of CO2(0,1^0,0) is ~1.1 s.
But for every CO2 molecule there are approximately 2500 other molecules in the same volume of air. So the loss of the vibrational energy is essentially a race between radiation emission and collision – where collision wins most of the time.
The best study of this is probably The vibrational deactivation of the (00^o1) and (01^1 0): Modes of CO2 measured down to 140 K, R.M. Siddles, G.J. Wilson, C.J.S.M. Simpson, 1994. From their work the dynamic lifetime can be calculated as approximately 10 us.
Now, you either know these answers already, in which case your question was disingenuous – or you think the answer actually means something that scientists haven’t already taken into account. Well, similar estimates can be found going back to the 1950s. Scientists figured these things out long ago. But please, feed us some more misinformation.
Baffled, I see you are also baffled by the question, and don’t know the answer. I’m not going to bite on another got’cha attempt by you. But, if you want to start, as did Ben, we might further discuss. If you do define the before and after molecular vibrational frequencies before and after capturing the photon, and the atmospheric pressure at which you are defining the event to further provide the probability of molecular collisions, and etc. etc. Or you could just give us the estimated average residence time in that particular CO2 molecule for the ?trapped? photon. Which is what Ii asked for.
Kevin is wrong because he is comparing an auto to a hydro-carbon molecule. just because they may be co-resident doesn’t put them in the same category.
corev, that little paragraph demonstrates you are a scientific illiterate. as i suspected, you cannot and will not actually address the issue, because you do not have the scientific horsepower. as a denier, you should know better than to try and discuss the physics-it is out of your league.
as kevin already provided the answer, i will not elaborate. but it is clear you do not understand that a single molecule can absorb and emit energy repeatedly. it is not a one time affair. and this is why you are so confused by the timescales. your confusion is based on your ignorance in science. that is why i would just love to hear how you reconcile the rising sea levels with your beloved sst data.
Baffled, of course a single molecule can “can absorb and emit energy (a photon) repeatedly”, but the time frame for each event is the important point. How long does “trapped” actually mean?
I did notice that only Kevin and I discussed the actual physics, and you sat on the sidelines arrogantly sniping. I also noticed that when shown your satellite data trend comment being wrong, you are silent. It is seldom that a belief structure will trump the data, and that is what is being discussed in this article and comment thread.
corev
“Baffled, of course a single molecule can “can absorb and emit energy (a photon) repeatedly”, but the time frame for each event is the important point. How long does “trapped” actually mean?”
the time frame for each event is not the important point. if the photon is absorbed into one molecule, and released into the atmosphere and absorbed into another molecule, the the time frame for each event is not that important. what is important is the density of the molecules. are they dense enough to keep the photon trapped in the atmosphere, or are they scarce enough to allow it to escape from the atmosphere. now the frequency at which these events occur can affect how quickly the overall process occur, but the overall behavior is still once again tied to the density of the molecules in the atmosphere. again, your commentary implies you do not understand this distinction. if enough co2 is in the atmosphere, it makes it very hard for the photon to escape, because it goes through this absorption/emission process repeatedly in a dense environment.
“I did notice that only Kevin and I discussed the actual physics” first, you were not correct in your discussion. in the past i gave you credit (a bone) for this effort, and you complained. won’t do that again. you only get credit for discussing physics when you actually discuss physics properly. and i did state the physics. you are not scientifically literate enough to understand that. again, the problem with deniers is they are arguing about a very scientific topic and yet they are scientifically illiterate, which is probably how you can make some of your statements with a straight face-you don’t know any better.
Baffled, you show your blind belief and ignorance, once again: ” if enough co2 is in the atmosphere, it makes it very hard for the photon to escape, because it goes through this absorption/emission processrepeatedly in a dense environment.” Maybe if you had said GHGs instead of CO2 (and actually meaning ACO2), then your comment would have made sense as far as how long the whole process would take before escape to space.
You also missed the other major factor, height. Height effects both density and the angle of incidence for the photon to return to the surface. Of course “AGW believers” seldom consider the basic physics where convection is important to the GHE process. Moreover the impression you give re: “… it makes it very hard for the photon to escape,…” is that the period is extensive. When GHGs make up 3-4% of the total atmosphere would indicate that at best 96-97% of the photons escape without running into any GHG molecule, but after its release in the few micro-seconds it is captured, that 96-97% chance is further reduced by all those factors we just discussed, height, angle of incidence, density, pure chance and several others not yet discussed factors. An IR photon finding a second GHG molecules is significantly reduced from the original 96-97%. What is the likelihood of that IR photon finding sufficient GHG molecules for the total residence time in the atmosphere to exceed a second?
What I do not understand is the anger and arrogance you are projecting.
corev, i project arrogance and anger at a scientifically illiterate individual who parrots words from denier websites, but actually has no understanding of the science he is claiming. it is easy for you to be deceived by these denier websites because you do not have the scientific horsepower to actually understand when arguments are made that are incorrect. even worse, if you did recognize such you would still not challenge it because it would contradict your world view.
you then try to change the argument and throw doubt. go ahead and replace co2 with ghg, i have no problem. i didn’t want to change the molecule name knowing how difficult it is for you to follow the science. doesn’t change the model one bit.
“all those factors we just discussed, height, angle of incidence, density, pure chance and several others not yet discussed factors.”
none of that change the basic mechanisms by which the greenhouse effect occurs. it still occurs. and it occurs on time scales we can observe. you lose site of the forest for the trees.
“An IR photon finding a second GHG molecules is significantly reduced from the original 96-97%.”
first, you are confusing probabilities with concentrations in your discussion. two different concepts. second, what makes you believe finding a second ghg molecules becomes such a low probability event? you are wandering into topics which you have no competency in discussing. this is my point, people get talking points from web sites which prove to be scientifically illiterate. and then repeat them ad nauseam with authority. rubbish.
corev, if you want to think through the science and learn, i have no problem with people making mistakes and learning from them. that is part of the educational process. but you need to take some time and learn about the physical world and how it works in its entirety-and accept those rules. you fell victim to distraction with your belief that the time the photon was “trapped” contradicts the global warming time frame, probably because a denier website makes that argument. but from a physics perspective, there is no problem. what we observe is a statistical results of the billions of interactions taking place each second over a large volume. it is this macro scale you should be focusing on, rather than looking for false excuses at the nanoscale.
Baffled, wow! Try to have a scientific discussion with you, and then all we see is name calling and crazy unsupported claims such as: ” who parrots words from denier websites” Really, you must have examples for the comment and the site then?
Or your comment that show no understanding that importance probabilities: “you then try to change the argument and throw doubt. go ahead and replace co2 with ghg, i have no problem. i didn’t want to change the molecule name knowing how difficult it is for you to follow the science. doesn’t change the model one bit.” I changed to GHGs to better match the GHE model and not the AGW. I gave you the benefit of the doubt thatg you would understand it improved probability of colliding with another GHG molecule. Clearly you don’t understand what the % of CO2 is for GHGs and what the ACO2 % is of CO2. If you did you wouldn’t make foolish claims like: “you are confusing probabilities with concentrations in your discussion.” If you insist we can stay with CO2 and reduce the probability of the IR photon colliding with another CO2 molecule. Can you guess what the reduced likelihood factor is?
There is no point in covering the other errors in your understanding with just this comment. you have shown you do not understand the differences in the temperature data-sets. You place all your faith on data processes to fix gross holes in the surface data. I’ll repeat a prior comment: ” I also noticed that when shown your satellite data trend comment being wrong, you are silent. It is seldom that a belief structure will trump the data, and that is what is being discussed in this article and comment thread.” You have failed miserably to discuss the science, and strangely, when you think you are it is horribly wrong. More importantly you can not discuss any of the data nor give examples for your beliefs.
corev, one cannot have a scientific discussion with you because you have no respect for science. you are illiterate on the topic. and you are unwilling to actually learn about science. so i will continue to challenge you on these topics.
regarding the data sets, i have already raised the issue comparing them to other observations in the world, including sea level and heat content. sea levels have continued to rise throughout your hiatus. give me an explanation for the continued rise in sea levels if we are no longer warming. and it needs to be consistent with the physics. just give me a plausible model.
look corev, the mechanisms behind greenhouse gas warming have been shown to be valid. your entire exercise on this blog is simply to throw doubt on those mechanisms. but you throw doubt on them with scientifically illiterate arguments. your “capture” time ramblings is a prime example. the mechanism is valid. all you have been able to do is demonstrate your lack of scientific understanding, which you demonstrate clearly when you are forced to explain your positions based on science-you are unable to do so.
if you have a valid, science based model to back up your positions, i can respect that. but you do not have such a model. and that i have no respect for.
Baffled, you have failed miserably to talk to any science topic under discussion, while continuously trying to move the discussion to a subject of your interest. Not once have you answered any of my questions. On the issue of the physics related to the GHE theory at the molecular level you have added nothing. On the subject of the article, the satellite data, you have added nothing.
Try to have a scientific discussion with you, and then all we see is name calling and crazy unsupported claims.
corev, “Baffled, you have failed miserably to talk to any science topic under discussion”
no corev. initially i tried to talk science with you. you refuse to discuss things in scientifically relevant ways. that is the problem. you get your science from denier websites, and then repeat. unfortunately it is flawed science, which is why one cannot have a scientific discussion with you.
i have asked you repeatedly to give me a valid scientific explanation for continued rise in sea level and heat content while under the influence of your “hiatus”. you have not responded because you do not have the scientific ability to do so. take that as a hint to stop learning science from a denier web site, and go learn from the scientists actually conducting this type of research. you seem to think, as a novice, you have some greater insight than the scientists who have dedicated entire careers to understanding the basic physics impacting global climate change. that hubris is ridiculous. look, you cannot even bring yourself to admit that the greenhouse gas mechanism actually exists and influences our planets heat content. how does one have a scientific discussion with illiteracy?
Baffled, repetition of a comment does not improve it. 😉 You were asked for evidence of this claim, specifically the site.
G’day to you!
corev, i have asked you repeatedly to give me a valid scientific explanation for continued rise in sea level and heat content while under the influence of your “hiatus”. prior to your request. and you have not responded because you do not have the scientific ability to do so.
you obviously are not getting your information from scientifically sound sources, otherwise you could provide competent scientific responses to questions on this blog. and you are not scientifically literate enough to even understand the poor science you are repeating. as i said before, take some time and actually learn the science from scientists in this field rather than some anti blog with the same limited scientific background as yourself. a high school physics background does not help your cause, even if you did stay in a holiday inn express last night.
2015 AGU – Fall Meeting
Thursday, 17 December 2015 11:35 – 11:50 Moscone West – 3012
Uncertainty in Long-Term Atmospheric Data Records from MSU and AMSU
The temperature of the Earth’s atmosphere has been continuously observed by satellite-borne microwave sounders since late 1978. These measurements, made by the Microwave Sounding Units (MSUs) and the Advanced Microwave Sounding Units (AMSUs) yield one of the longest truly global records of Earth’s climate. To be useful for climate studies, measurements made by different satellites and satellite systems need to be merged into a single long-term dataset. Before and during the merging process, a number of adjustments made to the satellite measurements. These adjustments are intended to account for issues such as calibration drifts or changes in local measurement time. Because the adjustments are made with imperfect knowledge, they are therefore not likely to reduce errors to zero, and thus introduce uncertainty into the resulting long-term data record. In this presentation, we will discuss a Monte-Carlo-based approach to calculating and describing the effects of these uncertainty sources on the final merged dataset. The result of our uncertainty analysis is an ensemble of possible datasets, with the applied adjustments varied within reasonable bounds, and other error sources such as sampling noise taken into account. The ensemble approach makes it easy for the user community to assess the effects of uncertainty on their work by simply repeating their analysis for each ensemble member.
Author
Carl Mears
Remote Sensing Systems
Kevin discusses uncertainty as presented by Mears of REMSS/RSS. Dr Christy presented an interesting testimony on empirical evidence in the recent Senate hearing. It coincidentally covers many of trhe various subject so far discussed in this comment thread.
“Evidence-Based Science: John Christy’s written testimony was a solid challenge to the Paris conference and the EPA’s claim that CO2 emissions endanger human health and welfare (EPA’s Endangerment Finding). Key points include:
· Many of UAH datasets are used to test hypotheses of climate variability and change
· Outputs of the models are hypotheses (or claims) and do not provide proof of links between climate variations and greenhouse gases
· Equations are not exact, but at best approximations
· Fundamental: if we understand a system, then we should be able to predict its behavior. If we cannot predict, then at least some factors in the system are not well defined or perhaps even missing. [This is more restrictive than mere replication – which reproduces but does not guarantee the fundamental physics are well known. One can get the right answer for the wrong reasons.]
For Christy, the relevant question is how much heat is accumulating in the global atmosphere? CO2-caused warming should be easily detectible by now. Since 1979, two independent means to monitor this layer [from surface to about 50,000 feet], balloons from below and satellites from above. Yet, the hot spot is missing.
To demonstrate his findings Christy presented the results of 102 CMIP-5 rcp4.5 (representative concentration pathways) climate model simulations. Yet only one group of the 32 groupings of models runs is close to observations through November 2015
However, there is a very tight correspondence between the average of 4 balloon datasets and the average of 3 satellite datasets, extremely tight correspondence since 2005. On average, models over-estimate real world warming rate by 3 times – since 1979 – 37 years.
“Using the scientific method we would conclude that the models do not accurately represent at least some of the important processes that impact the climate because they were unable to “predict” what has already occurred. In other words, these models failed at the simple test of telling us “what” has already happened, and thus would not be in a position to give us a confident answer to “what” may happen in the future and “why.” As such, they would be of highly questionable value in determining policy that should depend on a very confident understanding of how the climate system works. “
Christy went on to present the evidence from the tropical Mid-Troposphere, where the “hot spot” should occur. This gives more detail on how well the models perform regarding greenhouse gases. In the models, the tropical atmosphere warms even more than the global atmosphere. The difference between the observations and the models is even more extreme, but since 2012 convergence of the average of the balloon datasets and the satellite datasets is not quite as tight as with global data. On average, models over-estimate real world warming rate over the tropics by 4 times – since 1979 – 37 years.
He then went on to assume the US stopped emitting carbon dioxide as of May 13, 2015, using the IPCC impact tool known as the Assessment of Greenhouse-gas Induced Climate Change (MAGICC) and a climate sensitivity of 1.8 ºC, which is indicated by empirical data. Even with no US CO2 emissions for the next 50 years, Christy and his assistant calculated that the model based increase in global temperatures would be only 0.05 to 0.08 ºC less than with US emissions. This minimal increase is less than observed monthly fluctuations in temperatures.
Christy went on to discuss extreme weather events: in the US, 100 º F days per year are down (from 1895 to 2014); wildfires down (1960 to 2014); forest fires down (1965 to 2013); no Global increase in droughts (1982 to 2012) no major increase in flood or droughts in US (1895 to 2015) and world grain production, wheat, rice, and course grains, up significantly (1961-2012).
Christy expressed disappointment in the scientific process used by the IPCC and its followers. Climate science is murky, with large uncertainties. There must be rigorous hypothesis testing (testing of claims). Yet, there is little or none. The IPCC Fifth Assessment Report (AR5), in every case, overestimated the tropical response to extra greenhouse gases, indicating the assumed climate response to greenhouse gases is too sensitive.
He states a bias in government funding, with a (false) consensus more meaningful than objective investigation. Consensus is a form of “argument from authority” The consensus is little more than a consensus of those selected to agree with the consensus, with the Climate Establishment as the gatekeepers of information and opinion. Christy recommends that five to ten percent of government funding goes to exploring alternative hypotheses.
Christy concludes that IPCC science has severe failings:
1) Theoretical understanding of the way greenhouse gases affects climate fails simple tests;
2) Even if one accepts climate models, the effect of proposed regulations will be negligible;
3) Claims of extreme weather events are not supported by evidence;
4) Official information is largely controlled by biased government agencies
See links under Questioning the Orthodoxy – The Hearing
*******************”
CoRev – you’ve obviously drunk the Kool-Aid. Have you read Christy’s testimony? By my count their are 8 Figures in the text. Not one of them contains any uncertainty bars or textual explanation of the uncertainty in the Figure. One might think Christy’s whole testimony was about politics – not science.
Gavin Schmidt has already ripped Christy’s CMIP5 TMT comparison graphs to shreds. And why did Christy only show mid-troposphere temperatures? Why didn’t he show show surface data or lower troposhere data – wouldn’t they be more relevant? One might think he was being political – and not scientific.
Or take something non-temperature related: World grain production. No mention of technology advances in farm implements, herbicides, pesticides, crop rotation, irrigation, etc. Just a chart with numbers on an axis. No uncertainties and no attribution of the numerous factors that affect crop production. Yet he unscientifically asserts that there cannot be climate damage to crops. Is he now an agricultural expert, too? One might think he was being political – and not scientific.
It would be easier to recite a list of things Christy got correct. His name.
Kevin asks: ” And why did Christy only show mid-troposphere temperatures? ” From my comment the answer is:
“Christy went on to present the evidence from the tropical Mid-Troposphere, where the “hot spot” should occur. This gives more detail on how well the models perform regarding greenhouse gases. ”
This comment is fascinating, that at a political</b hearing: " One might think he was being political – and not scientific." From what I saw the science would have put all the lightweights to sleep, and that description would apply to every politician and ADM Titley. I saw no graph that was beyond elementary.
When talking about uncertainty, you want us to believe the3 coverage shown this surface data: http://www.ncdc.noaa.gov/sotc/service/global/map-land-sfc-mntp/201510.gif provides better and more certain data than the coverage shown in this satellite data: http://fermi.jhuapl.edu/avhrr/gallery/passes/map.html (Note this description of the actual coverage: “The satellite scans 6 lines of 2048 pixels across its path every second using its motion to space the scan lines apart. This map shows every 200th scan line.“) Also please remember this is only one pass of one satellite where multiple satellites exist and multiple passes for each happen each day over land and sea.
Baffled believes that consistency in surface data processes will correct the loss/lack of data. You believe that the satellite data processes are worse/more error prone than the surface data that manufactures data for those large to huge areas where coverage is lost/lacking. And you guys want us to believe that?
Menzie, do you understand why the satellite data is the better data? “I’ve always wondered by climate change skeptics focus on satellite data; I guess “satellites” conjure up images of high-tech super-accurate measurement. But there’s a lot of stuff that can go wrong, imparting measurement error.” Yes, the processing of satellite data is extensive and complex, but the data is available. The surface data is also just as extensive and complex, but for large to huge portions of the surface data are non-existent. As i’ve shown the implementation of ERSSTv4 changed the surface data trends. Remember the phrases extensive and complex, but the real issue with SST is the huge lack of coverage. How did NOAA solve that?
Kevin and Baffling,
You are far too accommodating when CoRev asks an inane question or suggests an idiotic technique. You have to understand that deniers like CoRev depend critically on framing the science in as complicated a way as possible and then demanding that you present an argument that jumps through all these crazy unnecessary hoops. For example, CoRev says: “Which brings me to another simple question. Since you used the term capturing/traps and slows IR photons to space. Can you tell us, on average how long this atmospheric GHG process takes to occur from capture to release? Yes, it does release the photon or else we would be in a runaway situation. We already know that the UHI and water-based (my above description applies) can take hours to centuries respectively.” In subsequent comments he insists it is absolutely necessary to get all the way down to the photon level and model heat trapping molecule by molecule in order to calculate the amount of time it takes for the average photon to escape the earth’s atmosphere. This is an unnecessarily complicated Rube Goldberg method that has near zero chance of working. The proper technique is to just observe the aggregates. Total heat absorbed minus total heat expelled gets the correct calculation of excess heat. These aggregate quantities are observable. There is no need to do an analysis at the molecular level. There is no reason to chase CoRev’s rabbits down these holes.
CoRev also wants to get us to think that heat island effects and cloud cover are separate warming trends that work at night. Newsflash for CoRev, clouds are formed from cooling water vapor, which is a GHG and heat island effects are local perturbations that are part of the global noise not the global signal. Heat island effects allow cities to absorb more heat during the day than a pasture or a forest would. This is, of course, part of the global heat absorption in the day – so not separate. The lesson from this is aggregate, aggregate, aggregate. Observation is so much easier when you do it the easy way.
As far as linking, I doubt you will read or comprehend if you do, so I will refer you to very basic sites ad you are badly in need of authoritative sources that can explain the basics. You are not ready for peer reviewed research. Here are David Archer’s lecures . Here is some information from the University of Maine. Here is some information from UC San Diego.
I am also not angry. I am amused. You are a remarkable demonstration of the Dunning Kruger effect.
Ben, you are amazingly arrogant. Had you actually referenced a scientific paper, instead of the general information sites you have provided, I might have considered you comments as meaningful, but alas, you still have not.
I did listen to Archer’s “Greenhouse Physics Lecture”, and it was strangely it was at the molecular level. Aren’t you amazed? It did not say anything different than what we have discussed simpler than we had discussed here. Indeed, since it was a “General information” lecture it was much more basic.
An interesting comment in this lecture was that :gas molecules emit LIGHT i the ultraviolet range. Maybe you or kevin or Baffled could explain that, since you all seem to believe that light is only in the human visible range.
Ben, we can also look at your U Maine Ice Core reference. I bet you believe the Ice Core/CO2 chart actually shows absolute values for CO2 content, don’cha? Earlier you claimed I didn’t know anything. I do know that you do not splice unsmoothed data onto SMOOTHED data. That’s exactly what your U Maine chart shows. I didn’t go past that on the U Maine site. Didn’t need to, if that’s what they consider math/science.
Marcott et al 13 tried the same trick and when challenged had to say this about his own paper: http://www.realclimate.org/index.php/archives/2013/03/response-by-marcott-et-al/comment-page-2/
“Q: What do paleotemperature reconstructions show about the temperature of the last 100 years?
A: Our global paleotemperature reconstruction includes a so-called “uptick” in temperatures during the 20th-century. However, in the paper we make the point that this particular feature is of shorter duration than the inherent smoothing in our statistical averaging procedure, and that it is based on only a few available paleo-reconstructions of the type we used. Thus, the 20th century portion of our paleotemperature stack is not statistically robust, cannot be considered representative of global temperature changes, and therefore is not the basis of any of our conclusions. …” Except that not what the press release said.
The paper’s abstract: https://www.sciencemag.org/content/339/6124/1198.abstract
Since you like Ice Core data my favorite example is this one: http://jonova.s3.amazonaws.com/graphs/lappi/gisp-last-10000-new.png It appears to have 200-300 year smoothing, so appending the temperature record at its end is just as statistically invalid as Marcott’s and U Maine. More importantly compare it with the interglacials (IGs) in the Maine chart and see how similar it is, starts high and cools throughout until the next glaciation.
It’s these simple and fundamental things that you are getting wrong that makes me understand the level of your knowledge. When you refer to entry level cites, the aquarium, Dr Archer, and U Maine, then those confirm my conclusions that you are still learning at the entry level and have a long way to go. I know you think you have a background, but it is very limited.
What you think is the absolute truth is not. It almost never is in science.
CoRev, I am arrogant? That’s rich coming from you. Here you think you have the skill set to immediately dismiss scientific consensus on temperature records inferred from ice cores when you can’t even figure out what terms like “variation from trend” and “excess heat” mean in the context of climate change. Reading a peer reviewed article in Science or Nature won’t help when you need someone to explain what excess heat means.
I see nothing surprising about Professor Archer’s explanation at the molecular level about how CO2, CH4, and H2O can vibrate in a way that allows them to absorb IR while O2 and N2 cannot. Did you notice when he laid out the mechanism for tracking photons through the atmosphere to find out how long it takes on average to escape into space? Yeah, neither did I. That’s because that would be a really dumb idea.
As far as the definition of light goes, I certainly agree that it encompasses the entire electromagnetic spectrum. The physics department at the University of Wisconsin and the department of physics and astronomy at John Hopkins University both have basic explanation that say as much. Everything from radio waves to gamma rays are light. This doesn’t help with most of your arguments, though. Different instruments have to be used to sense different ranges within the spectrum. A microwave sensor is not the same as an infrared sensor. You don’t use a radio to detect X-rays.
Absolute truth is not as rare as you contend. While scientists disagree about a lot of things and sometimes engage in rather contentious debates, on many issues the facts are quite well known. What would it take to convince physicists and chemists that there was no such thing as molecules? What would it take to convince biologists that cells do not exist? What would it take to convince astronomers that galaxies do not contain billions of stars? What would it take to convince climate scientists that they had gotten the fundamentals of climate science wrong? I suppose it could happen, but each of these examples is a pretty tall order.
As far as my background goes, you don’t know what I think. I certainly am not trying to convince you that I have an advanced background in climate science. I am merely pointing out that your background is not as advanced as these basic sites. The proof is how hard you try to find a statistical argument against a particular analysis of complex data sets when you can’t even get the basic terminology right. Does it really never occur to you that thousands of studies have confirmed the results? That the results have been widely accepted as correct in the scientific community? Do you really think some simple mistake was made that invalidated the entire corpus of scientific research and that CoRev is the clever fellow who could spot it in minutes? That is beyond arrogant.
Ben, you never fail to amaze. You state: “Did you notice when he laid out the mechanism for tracking photons through the atmosphere to find out how long it takes on average to escape into space? Yeah, neither did I. That’s because that would be a really dumb idea. ” Dumb idea? How do we measure a change without including location and TIME? Location = molecular level because that is the basis of the GHE theory. Time = the period of change, molecular = sub-second (nano-micro-second) AVERAGE TIME. Atmosphere = the sum of the molecular AVERAGE TIMES before escape to space. All other warming measurements depend on the same two functions location/region and time between measurements. That is what you think is a dumb idea.
That is why I question your understanding of the fundamentals. You are arguing points of basic science/understanding from the wrong direction. If your understandings of the fundamentals are so wrong then your so are your beliefs. When asked simple questions to define what you wish to discuss, and you can not, then the basis of your beliefs are questioned. If after multiple paragraphs and many days of discussion, wherein you provided a reasonably good description of climate change, but continue to get the the fundamentals wrong, the you have disproved your own hypothesis. If you even remember was: “The one thing I notice about climate change deniers and skeptics is that they can not articulate the scientific argument for how climate change works. It is rather ludicrous to argue against a claim, when you don’t even know what the claim is. So let’s hear from the climate change skeptics/deniers. What is the argument put forward by scientists who claim that global warming is both real and man made? I bet you can not do it.”
You then went on to claim I was deficient on the basics of the science. After all this time you evidence that YOU, multiple times, do not understand the simplest of the basics.
You have shown you are a blind believer, without knowledge of what and why you so believe. Then you arrogantly claim deniers/skeptics can not articulate an argument? The failures are with the believers’ ability to support those beliefs without strawman, lies and arrogant errors.
CoRev, you really have zero reading comprehension when you say, “How do we measure a change without including location and TIME?” . I already explained this and you do use both location and time. Location is the earth – all of it. Pick any unit of time – this could be a year, a month, a day, an hour or any other interval. Then take the following 2 observations: 1. Total heat absorbed by the earth in the time interval and 2. Total heat radiated into space by the earth in the same time interval. The difference is the earth’s excess heat over that time interval. The process for doing so is described here . It is very simple as compared to your Rube Goldberg technique – which only makes sense if you want to insist on denying that scientists have the ability to make these observations. Your position isn’t skeptical at all – just idiotic.
I well remember my original challenge. I also remember that you were not up to it. You were not challenged to agree with the argument or say that it had some merit. You were challenged to produce it. You failed. Afterwards you belittled the argument saying you saw no point in refuting it. This in no way changes the fact that you couldn’t produce it and insisted beforehand that it was a poorly phrased question.
And now that all your arguments have failed, you resort to exhibiting more of the Dunning Kruger effect.
ben, these types of responses are what i mean when i say corev cannot see the forrest for the trees. his lack of science precludes him from understanding that the only way you can really relate the atomic scale activities with the macro scale activities is through efforts such as statistical mechanics. it is simply because the number of computations to directly move across scales exceeds our computing capacity. one cannot follow exclusively the individual movement of the energy as it leaves the earth’s surface and escapes the atmoshphere. but one can model and measure the aggregate behavior.
statements such as “Time = the period of change, molecular = sub-second (nano-micro-second) AVERAGE TIME. Atmosphere = the sum of the molecular AVERAGE TIMES before escape to space. ” are simply jibberish. sum of the molecular average time means you know the exact path. you do not know this exact path, therefore this calculation is meaningless. uneducated deniers think of this as a gotcha moment.
it is so difficult to have a scientific battle with an unarmed man.
B squared. i8t is so funny debating with alarmist believers who can not actually support those beliefs without strawman, lies and arrogant errors. (and I forgot name calling) 😉
Baffled remember that ole density argument? I don’t suppose a calculation could be made on that basis? I mean otherwise how could the models work. Oh I forgot they don’t. Maybe you are correct, they need the to know the exact path.
I know it is difficult to follow logic when you “believe” trapped in a GHG molecule is for some significant time such as year, a month, a day, an hour or any other interval. That other interval was the point of the discussion and the location was a GHG molecule not the whole planet. And you wonder why I asked questions to pin down what you wanted to discuss.
Even when discussing at the molecular level you jump tot he planet?
This discussion has gotten too bizarre for me. Hope you have a nice holidays.
corev,
“I know it is difficult to follow logic when you “believe” trapped in a GHG molecule is for some significant time such as year, a month, a day, an hour or any other interval. ”
“And you wonder why I asked questions to pin down what you wanted to discuss.”
this is the type of statement that explains exactly your scientific illiteracy. you do not understand the context in which the scientific facts are known. this is why you fail miserably when discussions of topics cross time and length scales. you probably have a scientific background equivalent to high school physics. nobody taking college level physics-even intro level- would make the claims you make. and you believe your high school level physics and “sharp” mind give you insight and knowledge beyond what is known by the experts in the fields. your hubris is truly baffling.
i must say, ben hit it on the spot. Dunning Kruger effect on full display with corev.
CoRev reveals his poor reading comprehension yet again when he says, ‘I know it is difficult to follow logic when you “believe” trapped in a GHG molecule is for some significant time such as year, a month, a day, an hour or any other interval.’ CoRev, Literally nobody believes that a photon is trapped in a GHG molecule for such a long period of time! I never said it, Baffling never said it, Kevin never said it. We all agree the photon is released very quickly. What we are saying is that this is irrelevant to the climate change discussion. You don’t need to measure the average length of time the photon takes to escape the successive GHG molecules that trap it. We instead measure a totally different parameter – excess heat. In any given period of time, the earth absorbs heat from the sun and expels heat into space. If they are different (and they are) the earth is warming. This is true no matter how quickly the photons are escaping the GHGs. God you are stupid!
i know exactly how archer feels, when discussing with corev 🙂
http://geosci.uchicago.edu/~archer/science_debate_cartoon.pdf